. 2023 Aug;620(7976):1089-1100.
doi: 10.1038/s41586-023-06415-8. Epub 2023 Jul 11.

De novo design of protein structure and function with RFdiffusion

Affiliations

De novo design of protein structure and function with RFdiffusion

Joseph L Watson et al. Nature. 2023 Aug.

Abstract

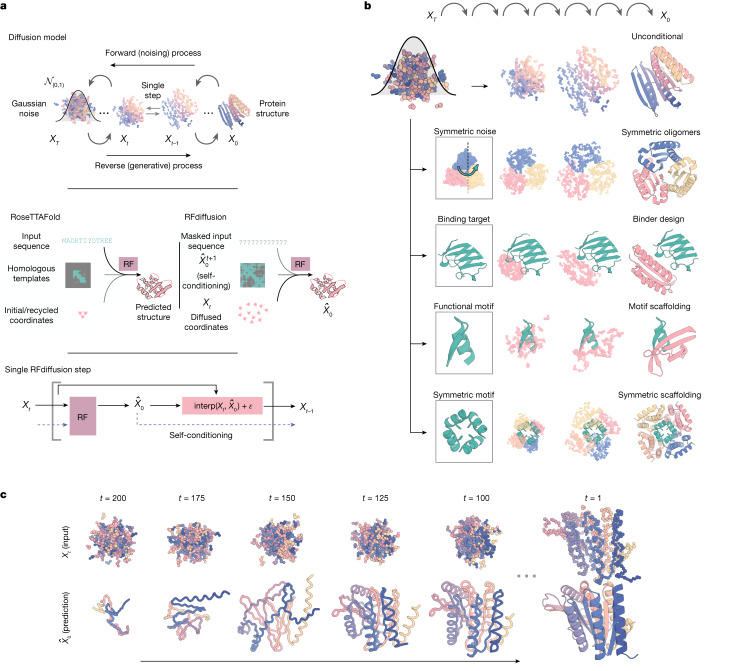
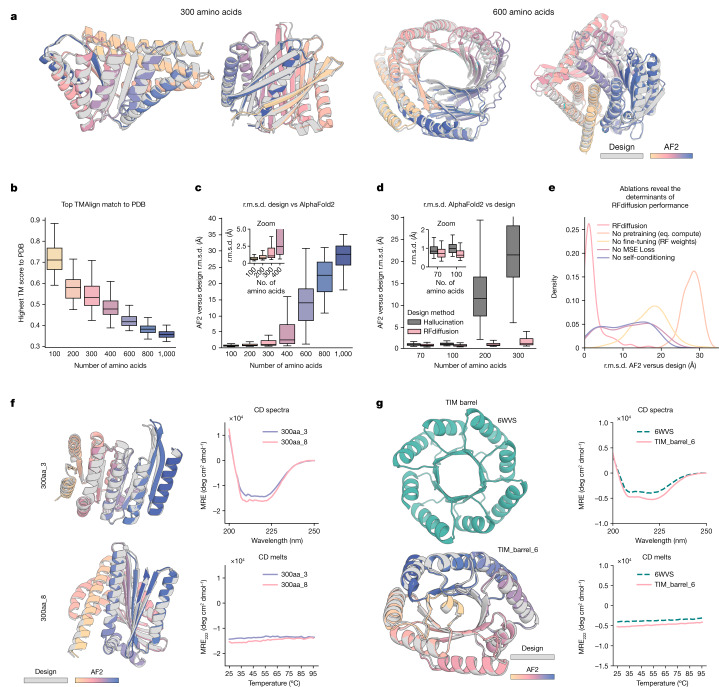
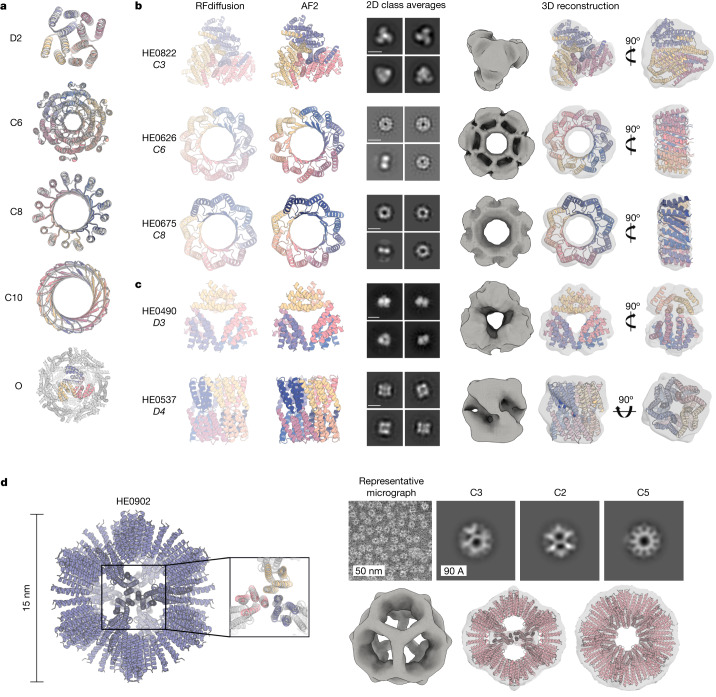
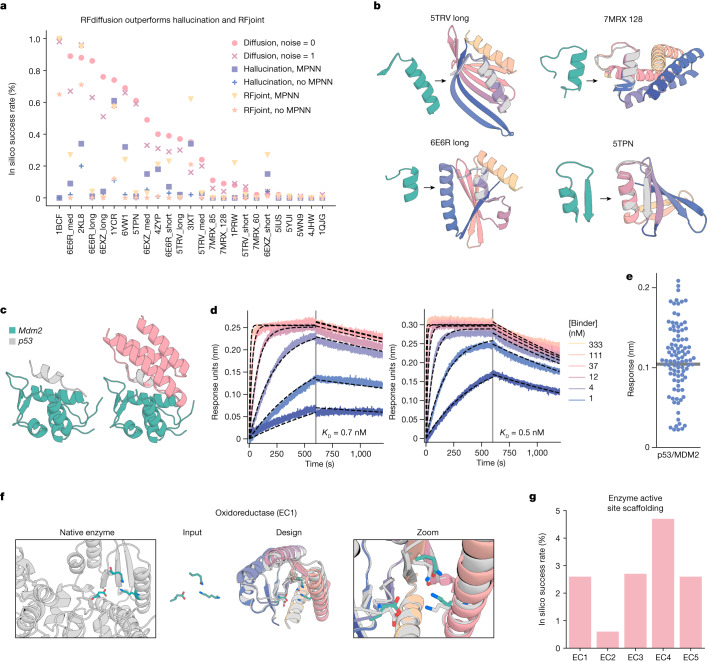
There has been considerable recent progress in designing new proteins using deep-learning methods1-9. Despite this progress, a general deep-learning framework for protein design that enables solution of a wide range of design challenges, including de novo binder design and design of higher-order symmetric architectures, has yet to be described. Diffusion models10,11 have had considerable success in image and language generative modelling but limited success when applied to protein modelling, probably due to the complexity of protein backbone geometry and sequence-structure relationships. Here we show that by fine-tuning the RoseTTAFold structure prediction network on protein structure denoising tasks, we obtain a generative model of protein backbones that achieves outstanding performance on unconditional and topology-constrained protein monomer design, protein binder design, symmetric oligomer design, enzyme active site scaffolding and symmetric motif scaffolding for therapeutic and metal-binding protein design. We demonstrate the power and generality of the method, called RoseTTAFold diffusion (RFdiffusion), by experimentally characterizing the structures and functions of hundreds of designed symmetric assemblies, metal-binding proteins and protein binders. The accuracy of RFdiffusion is confirmed by the cryogenic electron microscopy structure of a designed binder in complex with influenza haemagglutinin that is nearly identical to the design model. In a manner analogous to networks that produce images from user-specified inputs, RFdiffusion enables the design of diverse functional proteins from simple molecular specifications.


Conflict of interest statement

The authors declare no competing interests.

Figures

Fig. 1
Fig. 1. Protein design using RFdiffusion.
a, Diffusion models for proteins are trained to recover corrupted (noised) protein structures and to generate new structures by reversing the corruption process through iterative denoising of initially random noise XT into a realistic structure X0 (top panel). The RF structure prediction network (middle panel, left side) is fine-tuned with minimal architectural changes into RFdiffusion (middle panel, right side); the denoising network of a DDPM is also shown. In RF, the primary input to the model is the sequence. In RFdiffusion, the primary input is diffused residue frames (coordinates and orientations). In both cases, the model predicts final 3D coordinates (denoted X^0 in RFdiffusion). The bottom panel shows that in RFdiffusion, the model receives its previous prediction as a template input (‘self-conditioning’, Supplementary Methods). At each timestep t of a trajectory (typically 200 steps), RFdiffusion takes X^0t+1 from the previous step and Xt and then predicts an updated X0 structure (X^0t). The next coordinate input to the model (Xt1) is generated by a noisy interpolation (interp) towards X^0t. b, RFdiffusion is broadly applicable for protein design. RFdiffusion generates protein structures either without further input (top row) or by conditioning on (top to bottom): symmetry specifications; binding targets; protein functional motifs or symmetric functional motifs. In each case random noise, along with conditioning information, is input to RFdiffusion, which iteratively refines that noise until a final protein structure is designed. c, An example of an unconditional design trajectory for a 300-residue chain, depicting the input to the model (Xt) and the corresponding X^0 prediction. At early timesteps (high t), X^0 bears little resemblance to a protein but is gradually refined into a realistic protein structure.
Fig. 2
Fig. 2. Outstanding performance of RFdiffusion for monomer generation.
a, RFdiffusion can generate new monomeric proteins of different lengths (left 300, right 600) with no conditioning information. Grey, design model; colours, AF2 prediction. r.m.s.d. AF2 versus design (Å), left to right: 0.90, 0.98, 1.15, 1.67. b, Unconditional designs from RFdiffusion are new and not present in the training set as quantified by highest TM-score to the PDB; the divergence from previously known structures increases with length. c, Unconditional samples are closely repredicted by AF2 up to about 400 amino acids. d, RFdiffusion significantly outperforms Hallucination (with RF) at unconditional monomer generation (two-proportion z-test of in silico success: n = 400 designs per condition, z = 9.5, P = 1.6 × 10−21). Although Hallucination successfully generates designs up to 100 amino acids in length, in silico success rates rapidly deteriorate beyond this length. e, Ablating pretraining (by starting from untrained RF), RFdiffusion fine-tuning (that is, using original RF structure prediction weights as the denoiser), self-conditioning or m.s.e. losses (by training with FAPE) each notably decrease the performance of RFdiffusion. r.m.s.d. between design and AF2 is shown, for the unconditional generation of 300 amino acid proteins (Supplementary Methods). f, Two example 300 amino acid proteins that expressed as soluble monomers. Designs (grey) overlaid with AF2 predictions (colours) are shown on the left, alongside circular dichroism (CD) spectra (top) and melt curves (bottom) on the right. The designs are highly thermostable. g, RFdiffusion can condition on fold information. An example TIM barrel is shown (bottom left), conditioned on the secondary structure and block adjacency of a previously designed TIM barrel, PDB 6WVS (top left). Designs have very similar circular dichroism spectra to PDB 6WVS (top right) and are highly thermostable (bottom right). See also Extended Data Fig. 3 for further traces. Boxplots represent median ± interquartile range; tails are minimum and maximum excluding outliers (±1.5× interquartile range).
Fig. 3
Fig. 3. Design and experimental characterization of symmetric oligomers.
a, RFdiffusion-generated assemblies overlaid with the AF2 structure predictions based on the designed sequences; in all five cases they are nearly indistinguishable (for the octahedron (bottom), the prediction was for the C3 substructure). Symmetries are indicated to the left of the design models. b,c, Designed assemblies characterized by nsEM. Model symmetries are as follows: cyclic, C3 (HE0822, 350 amino acids (AA) per chain), C6 (HE0626, 100 AA per chain) and C8 (HE0675, 60 AA per chain) (b); dihedral, D3 (HE0490, 80 AA per chain) and D4 (HE0537, 100 AA per chain) (c). From left to right: (1) symmetric design model, (2) AF2 prediction of design following sequence design with ProteinMPNN, (3) 2D class averages showing both top and side views (scale bar, 60 Å for all class averages) and (4) 3D reconstructions from class averages with the design model fit into the density map. The overall shapes are consistent with the design models, and confirm the intended oligomeric state. As in a, AF2 predictions of each design are nearly indistinguishable from the design model (backbone r.m.s.d.s (Å) for HE0822, HE0626, HE0490, HE0675 and HE0537, are 1.33, 1.03, 0.60, 0.74 and 0.75, respectively). d, nsEM characterization of an icosahedral particle (HE0902, 100 AA per chain). The design model, including the AF2 prediction of the C3 subunit are shown on the left. nsEM data are shown on the right: on top, a representative micrograph is shown alongside 2D class averages along each symmetry axis (C3, C2 and C5, from left to right) with the corresponding 3D reconstruction map views shown directly below overlaid on the design model.
Fig. 4
Fig. 4. Scaffolding of diverse functional sites with RFdiffusion.
a, RFdiffusion outperforms other methods across 25 benchmark motif-scaffolding problems collected from six recent publications (Supplementary Table 9). In silico success is defined as AF2 r.m.s.d. to design model less than 2 Å, AF2 r.m.s.d. to the native functional motif less than 1 Å and AF2 pAE less than five. One hundred designs were generated per problem, with no previous optimization on the benchmark set (some optimization was necessary for Hallucination). Supplementary Table 10 presents full results. In silico success rates on the problems are correlated between the methods, and RFdiffusion can still struggle on challenging problems in which all methods have low success. b, Four examples of designs in which RFdiffusion significantly outperforms existing methods. Teal, native motif; colours, AF2 prediction of a design. Metrics (r.m.s.d. AF2 versus design/versus native motif (Å), AF2 pAE): 5TRV long, 1.17/0.57; 4.73; 6E6R long, 0.89/0.27, 4.56; 7MRX long, 0.84/0.82 4.32; 5TPN, 0.59/0.49 3.77. c, RFdiffusion can scaffold the p53 helix that binds MDM2 (left) and makes extra contacts with the target (right, average 31% increased surface area. Design was p53_design_89). Designs were generated with an RFdiffusion model fine-tuned on complexes. d, BLI measurements indicate high-affinity binding to MDM2 (p53_design_89, 0.7 nM; p53_design_53, 0.5 nM); the native affinity is 600 nM (ref. ). e, Out of 95 designs, 55 showed binding to MDM2 (more than 50% of maximum response). Thirty-two of these were monomeric (Supplementary Fig. 10h). f, After fine-tuning (Supplementary Methods), RFdiffusion can scaffold enzyme active sites. An oxidoreductase example (EC1) is shown (PDB 1A4I); catalytic site (teal); RFdiffusion output (grey, model; colours, AF2 prediction); zoom of active site. AF2 versus design backbone r.m.s.d. 0.88 Å, AF2 versus design motif backbone r.m.s.d. 0.53 Å, AF2 versus design motif full-atom r.m.s.d. 1.05 Å, AF2 pAE 4.47. g, In silico success rates on active sites derived from EC1-5 (AF2 Motif r.m.s.d. versus native: backbone less than 1 Å, backbone and sidechain atoms less than 1.5 Å, r.m.s.d. AF2 versus design less than 2 Å, AF2 pAE less than 5).
Fig. 5
Fig. 5. Symmetric motif scaffolding with RFdiffusion.
a, Design of symmetric oligomers scaffolding the binding interface of ACE2 mimic AHB2 (left, teal) against the SARS-CoV-2 spike trimer (left, grey). Three AHB2 copies are input to RFdiffusion along with C3 noise (middle); output are C3-symmetric oligomers holding the three AHB2 copies in place to engage all spike subunits. AF2 predictions (right) recapitulate the AHB2 structure with 0.6 Å r.m.s.d. over the assymetric unit and 2.9 Å r.m.s.d. over the C3 assembly. b, Design of C4-symmetric oligomers to scaffold a Ni2+ binding motif (left). Starting from square-planar histidine rotamers within helical fragments (Supplementary Methods), RFdiffusion generates a C4 oligomer scaffolding the binding domain (middle). AF2 predictions (colour) agree closely with the design model (grey), with backbone r.m.s.d. less than 1.0 Å (right). c, nsEM 2D class averages (scale bar, 60 Å) and 3D reconstruction density are consistent with the symmetry and structure of the NiB1.17 design model shown superimposed on the density in ribbon representation (top). Isothermal titration calorimetry binding isotherm of design NiB1.17 (blue) indicates a dissociation constant less than 20 nM at a metal:monomer stoichiometry of 1:4. The H52A mutant isotherm (pink) ablates binding, indicating scaffolded histidine residues are critical for metal binding. d, Additional experimentally characterized Ni2+ binders NiB2.15 (left), NiB1.12 (middle) and NiB1.20 (right). Metal-coordinating sidechains in the design models (top, teal) are closely recapitulated in the AF2 predictions (colours). 2D nsEM class averages (middle; scale bar, 60 Å) are consistent with design models. Binding isotherms for wild-type (WT) and H52A mutant (bottom) indicate Ni2+ binding mediated directly by the scaffolded histidines at the designed stoichiometry. Note that for ITC plots, points represent single measurements.
Fig. 6
Fig. 6. De novo design of protein-binding proteins.
a, RFdiffusion generates protein binders given a target and specification of interface hotspot residues. b, De novo binders were designed to five protein targets; Influenza A H1 HA, IL-7Rα, InsR, PD-L1 and TrkA and hits with BLI response greater than or equal to 50% of the positive control were identified for all targets. For IL-7Rα, InsR, PD-L1 and TrkA, RFdiffusion has success rates roughly two orders of magnitude higher than the original design campaigns. We attribute one order of magnitude to RFdiffusion, and the second to filtering with AF2 (estimated success rates for previous campaigns if AF2 filtering had been used: HA, 0%; IL-7Rα, 2.2%; InsR, 5.5%; PD-L1, 3.7%; TrkA, 1.5%). c, For IL-7Rα, InsR, PD-L1 and TrkA, the highest affinity binder is shown above a BLI titration series. Reported KD values are based on global kinetic fitting with fixed global Rmax. d, The highest affinity HA binder, HA_20, binds with a KD of 28 nM. c,d, Yellow or orange, target or hotspot residues; grey, design model; purple, AF2 prediction (r.m.s.d. AF2 versus design). Binders: IL7Ra_55 (2.1 Å), InsulinR_30 (2.6 Å), PDL1_77 (1.5 Å), TrkA_88 (1.4 Å) (left to right in c) and HA_20 (1.7 Å) (d). e, Cryo-EM 2D class averages of HA_20 bound to influenza HA, strain A/USA:Iowa/1943 H1N1 (scale bar, 10 nm). f, 2.9 Å cryo-EM 3D reconstruction of the complex viewed along two orthogonal axes. HA_20 (purple) is bound to H1 along the stem of all three subunits. g, The cryo-EM structure of the HA_20 binder in complex closely matches the design model (r.m.s.d. to RFdiffusion design, 0.63 Å; yellow, influenza HA). h, Structure of the HA_20 binder alone superimposed on the design model viewed along two orthogonal axes. For cryo-EM panels, yellow, Influenza H1 map and/or structure; grey, HA_20 binder design model; purple, HA_20 binder map or structure.
Extended Data Fig. 1
Extended Data Fig. 1. Training ablations reveal determinants of RFdiffusion success.
AC) RFdiffusion can generate high quality large unconditional monomers. Designs are routinely accurately recapitulated by AF2 (see also Fig. 2c), with high confidence (A) for proteins up to approximately 400 amino acids in length. B) Further orthogonal validation of designs by ESMFold. C) Recapitulation of the design structure is often better with ESMFold compared with AF2. For each backbone, the best of 8 ProteinMPNN sequences is plotted, with points therefore paired by backbone rather than sequence. D) Comparing RFdiffusion trained with MSE loss on Cα atoms and N-Cα-C backbone frames (Methods 2.5), rather than with FAPE loss,. The MSE loss is not invariant to the global coordinate frame, unlike FAPE loss, and is required for good performance at unconditional generation (left, two-proportion z-test of in silico success rate, n = 400 designs per condition, z = 4.1, p = 4.1e-5). For motif scaffolding problems, where the ‘motif’ provides a means to align the global coordinate frame between timesteps, FAPE loss performs approximately as well as MSE loss, suggesting the L2 nature of MSE loss (as opposed to the L1 loss in FAPE) is not empirically critical for performance. E) Allowing the model to condition on its X0 prediction at the previous timestep (see Supplementary Methods 2.4) improves designs. Designs with self-conditioning (pink) have improved recapitulation by AF2 (left) and better AF2 confidence in the prediction (right). Two-proportion z-test of in silico success rate, n = 800 designs per condition z = 11.4, p = 6.1e-30. F) RFdiffusion leverages the representations learned during RF pre-training. RFdiffusion fine-tuned from pre-trained RF (pink) comprehensively outperforms a model trained for an equivalent amount of time, from untrained weights (gray). For context, sequences generated by ProteinMPNN on these output backbones are little better than sampling ProteinMPNN sequences from random Gaussian-sampled coordinates (white). Two-proportion z-test of in silico success rate, pre-training vs without pre-training (or vs random noise; both have zero success rate), n = 800 designs per condition, z = 23.0, p = 3.1e-117. Note that the data in pink in DF is the same data, reproduced in each plot for clarity. G) The median (by AF2 r.m.s.d. vs design) 300 amino acid unconditional sample highlighting the importance of self-conditioning and pre-training. Without pre-training (at least when trained with equivalent compute), RFdiffusion outputs bear little resemblance to proteins (gray, left). Without self-conditioning, outputs show characteristic protein secondary structures, but lack core-packing and ideality (gray, middle). With pre-training and self-conditioning, proteins are diverse and well-packed (pink, right). H) Greater coherence during unconditional denoising may partly explain the effect of self-conditioning. Successive X0 predictions are more similar when the model can self-condition (lower r.m.s.d. between X0 predictions, pink curve). Data are aggregated from unconditional design trajectories of 100, 200 and 300 residues. I) During the reverse (generation) process, the noise added at each step can be scaled (reduced). Reducing the noise scale improves the in silico design success rates (left, middle; two-proportion z-test of in silico success rate, n = 800 designs per condition, 0 vs 0.5: z = 1.7, p = 0.09, 0 vs 1: z = 6.5, p = 6.8e-11; 0.5 vs 1: z = 4.8, p = 1.4e-6). This comes at the expense of diversity, with the number of unique clusters at a TM-score cutoff of 0.6 reduced when noise is reduced (right). Note throughout this figure the 6EXZ_long benchmarking problem is abbreviated to 6EXZ for brevity. Boxplots represent median±IQR; tails: min/max excluding outliers (±1.5xIQR).
Extended Data Fig. 2
Extended Data Fig. 2. RFdiffusion learns the distribution of the denoising process, and inference efficiency can be improved.
A) Analysis of simulated forward (noising) and reverse (denoising) trajectories shows that the distribution of Cα coordinates and residue orientations closely match, demonstrating that RFdiffusion has learned the distribution of the denoising process as desired. Left to right: i) average distance between a Cα coordinate at Xt and its position in X0; ii) average distance between a Cα coordinate at Xt and Xt-1; iii) average distance between adjacent Cα coordinates at Xt; iv) average rotation distance between a residue orientation at Xt and X0; v) average rotation distance between a residue orientation at Xt and Xt-1. B-C) While RFdiffusion is trained to generate samples over 200 timesteps, in many cases, trajectories can be shortened to improve computational efficiency. B) Larger steps can be taken between timesteps at inference. Decreasing the number of timesteps speeds up inference, and often does not decrease in silico success rates (left) (for example, on an NVIDIA A4000 GPU, 100 amino acid designs can be generated with 15 steps, in ~11s, with an in silico success rate of over 60%). When normalized for compute budget (center) it is often much more efficient to run more trajectories with fewer timesteps. This can be done without loss of diversity in samples (right). For harder problems (e.g. unconditional 300 amino acids), one must strike an intermediate number of total timesteps (e.g., T = 50) for optimal compute efficiency. Note that for all other analyses in the paper, 200 inference steps were used, in line with how RFdiffusion is trained. C) An alternative to taking larger steps is to stop trajectories early (possible because RFdiffusion predicts X0 at every timestep). In many cases, trajectories can be stopped at timestep 50–75 with little effect on the final in silico success rate of designs (left), and when normalized by compute budget (center), success rates per unit time are typically higher generating more designs with early-stopping. Again, this can be done without a significant loss in diversity (right).
Extended Data Fig. 3
Extended Data Fig. 3. Unconditionally-generated designs are folded and thermostable.
A) Four 200 amino acid and fourteen 300 amino acid proteins were tested for expression and stability. 9/18 designs expressed, with a major peak at the expected elution volume. Blue: 300 amino acid proteins; Purple: 200 amino acid proteins. B) Colored AF2 predictions overlaid on gray design models (left), circular dichroism spectra at 25 °C (blue) and 95 °C (pink) (middle) and circular dichroism melt curves (right) for all 9 designs passing expression thresholds. In all cases, proteins remain well folded even at 95 °C. Note that data on 300aa_3 and 300aa_8 are duplicated from Fig. 2f, reproduced here for clarity.
Extended Data Fig. 4
Extended Data Fig. 4. RFdiffusion can condition on fold information to generate specific, thermostable folds.
A) 6WVS is a previously-described de novo designed TIM barrel (left). A fine-tuned RFdiffusion model can condition on 1D and 2D inputs representing this protein fold, specifically secondary structure (middle, bottom) and block-adjacency information (middle, top) (see Supplementary Methods 4.3.2). RFdiffusion then generates proteins that closely recapitulate this course-grained fold information (right). B) Outputs are diverse with respect to each other. With this coarse-grained fold specification, in silico successful designs are much more diverse (as quantified by pairwise TM-scores) compared to diversity generated through simply sampling many sequences for the original PDB backbone (6WVS). C) NTF2 folds are useful scaffolds for de novo enzyme design, and can also be readily generated with fold-conditioning in RFdiffusion. Designs are diverse and closely recapitulated by AF2. D) In silico success rates are high with fold-conditioned diffusion. TIM barrels are generated with an AF2 in silico success rate of 42.5% (left bar, pink) with in silico success incorporating both AF2 metrics and a TM-score vs 6WVS > 0.5. NTF2 folds are generated with an AF2 in silico success rate of 54.1% (right bar, pink), with in silico success incorporating both AF2 metrics and a TM-score vs PDB: 1GY6 > 0.5. In silico success was further validated with ESMFold (blue bars), where a pLDDT > 80 was used as the confidence metric for success. Gray: RFdiffusion design, colors: AF2 prediction. E) 11 TIM barrel designs were purified alongside the 6WVS positive control. Ten of these express and elute predominantly as monomers (note that the designs are approximately 4kDa larger than 6WVS). F) Eight designs expressed sufficiently for analysis by circular dichroism. All designs are folded, with circular dichroism spectra consistent with the designed structure (middle), and similar to 6WVS. Designs were also all highly thermostable, with CD melt analyses demonstrating designs were folded even at 95 °C (right). Designs are shown in gray, with the AF2 predictions overlaid in colors (left). Note that data on 6WVS and TIM_barrel_6 are duplicated from Fig. 2g, reproduced here for clarity.
Extended Data Fig. 5
Extended Data Fig. 5. Symmetric oligomer design with RFdiffusion.
A) Due to the (near-perfect - see Supplementary Methods 3.1) equivariance properties of RFdiffusion, X0 predictions from symmetric inputs are also symmetric, even at very early timepoints (and becoming increasingly symmetric through time; r.m.s.d. vs symmetrized: t = 200 1.20 Å; t = 150 0.40 Å; t = 50 0.06 Å; t = 0 0.02Å). Gray: symmetrized (top left) subunit; colors: RFdiffusion X0 prediction. B) In silico success rates for symmetric oligomer designs of various cyclic and dihedral symmetries. In silico success is defined here as the proportion of designs for which AF2 yields a prediction from a single sequence that has mean pLDDT > 80 and backbone r.m.s.d. over the oligomer between the design model and AF2 < 2Å. Note that 16 sequences per RFdiffusion design were sampled. C) Box plots of the distribution of backbone r.m.s.d.s between AF2 and the RFdiffusion design model with and without the use of external potentials during the trajectory. The external potentials used are the ‘inter-chain’ contact potential (pushing chains together), as well as the ‘intra-chain’ contact potential (making chains more globular). Using these potentials dramatically improves in silico success (Two-proportion z-test of in silico success rate: n = 100 designs per condition, z = 4.3, p = 1.9e-5). D) Designs are diverse with respect to the training dataset (the PDB). While the monomers (typically 60–100 AA) show reasonable alignment to the PDB (median 0.72), the whole oligomeric assemblies showed little resemblance to the PDB (median 0.50). E) Additional examples of design models (left) against AF2 predictions (right) for C3, C5, C12, and D4 symmetric designs (the symmetries not displayed in Fig. 3) with backbone r.m.s.d.s (Å) against their AF2 predictions of 0.82, 0.63, 0.79, and 0.78 with total amino acids 750, 900, 960, 640. F) Additional nsEM data for symmetric designs. The model is shown on the left and the 2D class averages on the right for each design. G) Two orthogonal side views of HE0537 by cryo-EM. Representative 2D class averages from the cryo-EM data are shown to the right of 2D projection images of the computational design model (lowpass filtered to 8 Å), which appear nearly identical to the experimental data. Scale bars shown (white) are 60 Å. Boxplot represents median ± IQR; tails: min/max excluding outliers (±1.5xIQR).
Extended Data Fig. 6
Extended Data Fig. 6. External potentials for generating pockets around substrate molecules.
AD) Example in silico successful designs for enzyme classes 2–5 (ref. , see also Fig. 4). Native enzyme (PDB: 1CWY, 1DE3, 1P1X, 1SNZ); catalytic site (teal); RFdiffusion output (gray: model, colors: AF2 prediction). Metrics (AF2 vs design backbone r.m.s.d., AF2 vs design motif backbone r.m.s.d., AF2 vs design motif full-atom r.m.s.d., AF2 pAE): EC2: 0.93 Å, 0.50 Å, 1.29 Å, 3.51; EC3: 0.92 Å, 0.60 Å, 1.07 Å, 4.59; EC4: 0.93 Å, 0.80 Å, 1.03 Å, 4.41; EC5: 0.78 Å, 0.44 Å, 1.14 Å, 3.32. EH) Implicit modeling of a substrate while scaffolding a retroaldolase active site triad [TYR1051-LYS1083-TYR1180] from PDB: 5AN7. E) The potential used to implicitly model the substrate, which has both a repulsive and attractive field (see Supplementary Methods 4.4). F) Left: Kernel densities demonstrate that without using the external potential (pink), designs often fall into two failure modes: (1) no pocket, and (2) clashes with the substrate. Right: clashes (substrate < 3 Å of the backbone) & pockets (no clash and > 16 Cα within 3–8 Å of substrate) with and without the potential. Two-proportion z-test: n = 71/51 +/− potential; clashes z = −2.05, p = 0.02, pocket z = −2.27, p = 0.01. Each datapoint represents a design already passing the stringent in silico success metrics (AF2 motif r.m.s.d. < 1 Å, AF2 backbone r.m.s.d. < 2 Å, AF2 pAE < 5). Note that the potential and clash definition pertain only to backbone Cα atoms, and do not currently include sidechain atoms. G) Designs close to the labeled local maxima of the kernel density estimate. Without the potential, the catalytic triad is predominantly (1) exposed on the surface with no residues available to provide substrate stabilization or (2) buried in the protein core, preventing substrate access. With the potential, the catalytic triad is predominantly (3), partially buried in a concave pocket with shape complementary to the substrate. Backbone atoms within 3 Å of the substrate are shown in red. H) A variety of diverse designs with pockets made using the potential, with no clashes between the substrate and the AF2-predicted backbone. The functional form and parameters used for the pocket potential are detailed in Supplementary Methods 4.4. In each case the substrate is superimposed on the AF2 prediction of the catalytic triad.
Extended Data Fig. 7
Extended Data Fig. 7. Additional Ni2+ binding C4 oligomers.
A) AF2 predictions of a subset of the experimentally verified Ni2+ binding oligomers, with corresponding isothermal titration calorimetry (ITC) binding isotherms for the wild-type (blue) and H52A mutant (pink) below. Note that these, with Fig. 5, encompass all of the experimentally validated outputs deriving from unique RFdiffusion backbones. Wild-type dissociation constants are displayed in each plot. We observe a mixture of endothermic (NiB2.10, NiB2.23, NiB2.15) and exothermic isotherms. For all cases displayed we observe no binding to the ion for H52A mutants, indicating the scaffolded histidine at position 52 is critical for ion binding. KD values in the isotherms indicate binding of the ion with the designed stoichiometry (1:4 Ni2+:protein). Note that each backbone depicted is from a unique RFdiffusion sampling trajectory, and that models and data for designs NiB2.15, NiB1.12, NiB1.20 and NiB1.17 from Fig. 5 are duplicated here for ease of viewing. B) Size exclusion chromatograms for elutions from the 44 purifications suggest the vast majority of designs are soluble and have the correct oligomeric state. C) Size exclusion chromatograms for 20 H52A mutants show that the mutants remain soluble and retain the intended oligomeric state. Note that only 18 of these 20 had wild-type sequences that definitively bound nickel. Note also that for ITC plots, points represent single measurements.
Extended Data Fig. 8
Extended Data Fig. 8. Targeted unconditional and fold-conditioned protein binder design.
A-B) The ability to specify where on a target a designed binder should bind is crucial. Specific “hotspot” residues can be input to a fine-tuned RFdiffusion model, and with these inputs, binders almost universally target the correct site. A) IL-7Rα (PDB: 3DI3) has two patches that are optimal for binding, denoted Site 1 and Site 2 here. For each site, 100 designs were generated (without fold-specification). B) Without guidance, designs typically target Site 1 (left bar, gray), with contact defined as Cα-Cα distance between binder and hotspot reside < 10 Å. Specifying Site 1 hotspot residues increases further the efficiency with which Site 1 is targeted (left bar, pink). In contrast, specifying the Site 2 hotspot residues can completely redirect RFdiffusion, allowing it to efficiently target this site (right bar, pink). C-D) As well as conditioning on hotspot residue information, a fine-tuned RFdiffusion model can also condition on input fold information (secondary structure and block-adjacency information - see Supplementary Methods 4.5). This effectively allows the specification of a (for instance, particularly compatible) fold that the binder should adopt. C) Two examples showing binders can be specified to adopt either a ferredoxin fold (left) or a particular helical bundle fold (right). D) Quantification of the efficiency of fold-conditioning. Secondary structure inputs were accurately respected (top, pink). Note that in this design target and target site, RFdiffusion without fold-specification made generally helical designs (right, gray bar). Block-adjacency inputs were also respected for both input folds (bottom, pink). E) Reducing the noise added at each step of inference improves the quality of binders designed with RFdiffusion, both with and without fold-conditioning. As an example, the distribution of AF2 interaction pAEs (known to indicate binding when pAE < 10) is shown for binders designed to PD-L1. In both cases, the proportion of designs with interaction pAE < 10 is high (blue curve), and improved when the noise is scaled by a factor 0.5 (pink curve) or 0 (yellow curve). F) Full in silico success rates for the protein binders designed to five targets. In each case, the best fold-conditioned results are shown (i.e. from the most target-compatible input fold), and the success rates at each noise scale are separated. In line with current best practice, we tested using Rosetta FastRelax before designing the sequence with ProteinMPNN, but found that this did not systematically improve designs. In silico success is defined in line with current best practice: AF2 pLDDT of the monomer > 80, AF2 interaction pAE < 10, AF2 r.m.s.d. monomer vs design < 1 Å. G) Experimentally-validated de novo protein binders were identified for all five of the targets. Designs that bound at 10 μM during single point BLI screening with a response equal to or greater than 50% of the positive control were considered binders. Concentration is denoted by hue for designs that were screened at concentrations less than 10 μM and thus may be false negatives.
Extended Data Fig. 9
Extended Data Fig. 9. Cryo-electron microscopy structure determination of designed Influenza HA binder.
A) Representative raw micrograph showing ideal particle distribution and contrast. B) 2D Class averages of Influenza H1+HA_20 binder with clearly defined secondary structure elements and a full-sampling of particle view angles (scale bar = 10 nm). C) Cryo-EM local resolution map calculated using an FSC value of 0.143 viewed along two different angles. Local resolution estimates range from ~2.3 Å at the core of H1 to ~3.4 Å along the periphery of the N-terminal helix of the HA_20 binder. D) Cryo-EM structure of the full H1+HA_20 binder complex (purple: HA_20; yellow: H1; teal: glycans). E) Global resolution estimation plot. F) Orientational distribution plot demonstrating complete angular sampling. G) 3D ab initio (left) and 3D heterogenous refinement (right - unsharpened) outputs, performed in the absence of applied symmetry, and showing clear density of the HA_20 binder bound to all three stem epitopes of the Iowa43 HA glycoprotein trimer, in all maps. H) The designed binder has topological similarity to 5VLI, a protein in the PDB, but binds with very different interface contacts.

References

    1. Dauparas J, et al. Robust deep learning-based protein sequence design using ProteinMPNN. Science. 2022;378:49–56. doi: 10.1126/science.add2187. - DOI - PMC - PubMed
    1. Ferruz N, Schmidt S, Höcker B. ProtGPT2 is a deep unsupervised language model for protein design. Nat. Commun. 2022;13:4348. doi: 10.1038/s41467-022-32007-7. - DOI - PMC - PubMed
    1. Singer JM, et al. Large-scale design and refinement of stable proteins using sequence-only models. PLoS ONE. 2022;17:e0265020. doi: 10.1371/journal.pone.0265020. - DOI - PMC - PubMed
    1. Wang J, et al. Scaffolding protein functional sites using deep learning. Science. 2022;377:387–394. doi: 10.1126/science.abn2100. - DOI - PMC - PubMed
    1. Trippe, B. L. et al. Diffusion probabilistic modeling of protein backbones in 3D for the motif-scaffolding problem. in The EleventhInternational Conference on Learning Representations (2023).

Publication types

MeSH terms

Substances