. 2023 Sep:182:44-53.
doi: 10.1016/j.yjmcc.2023.07.005. Epub 2023 Jul 9.

Ca2+ spark latency and control of intrinsic Ca2+ release dyssynchrony in rat cardiac ventricular muscle cells

Affiliations

Ca2+ spark latency and control of intrinsic Ca2+ release dyssynchrony in rat cardiac ventricular muscle cells

Cherrie H T Kong et al. J Mol Cell Cardiol. 2023 Sep.

Abstract

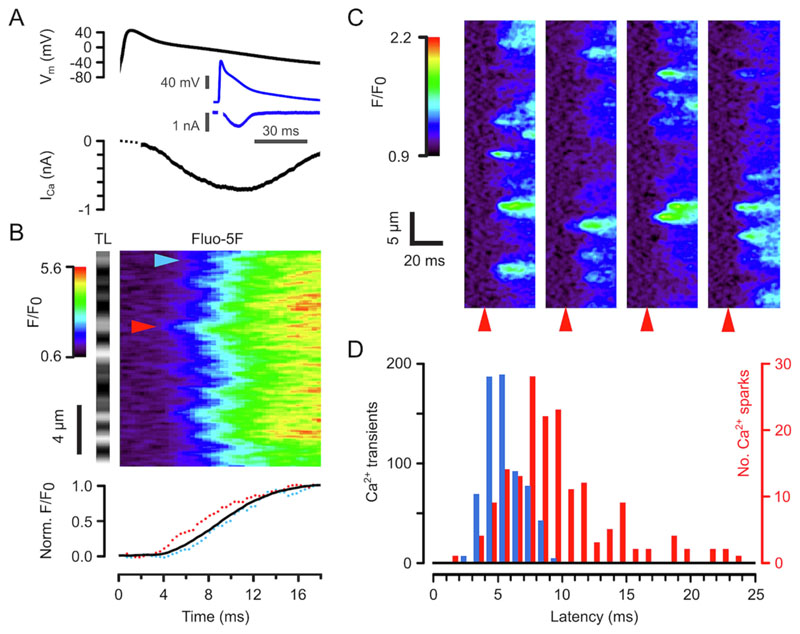
Cardiac excitation-contraction coupling (ECC) depends on Ca2+ release from intracellular stores via ryanodine receptors (RyRs) triggered by L-type Ca2+ channels (LCCs). Uncertain numbers of RyRs and LCCs form 'couplons' whose activation produces Ca2+ sparks, which summate to form a cell-wide Ca2+ transient that switches on contraction. Voltage (Vm) changes during the action potential (AP) and stochasticity in channel gating should create variability in Ca2+ spark timing, but Ca2+ transient wavefronts have remarkable uniformity. To examine how this is achieved, we measured the Vm-dependence of evoked Ca2+ spark probability (Pspark) and latency over a wide voltage range in rat ventricular cells. With depolarising steps, Ca2+ spark latency showed a U-shaped Vm-dependence, while repolarising steps from 50 mV produced Ca2+ spark latencies that increased monotonically with Vm. A computer model based on reported channel gating and geometry reproduced our experimental data and revealed a likely RyR:LCC stoichiometry of ∼ 5:1 for the Ca2+ spark initiating complex (IC). Using the experimental AP waveform, the model revealed a high coupling fidelity (Pcpl ∼ 0.5) between each LCC opening and IC activation. The presence of ∼ 4 ICs per couplon reduced Ca2+ spark latency and increased Pspark to match experimental data. Variability in AP release timing is less than that seen with voltage steps because the AP overshoot and later repolarization decrease Pspark due to effects on LCC flux and LCC deactivation respectively. This work provides a framework for explaining the Vm- and time-dependence of Pspark, and indicates how ion channel dispersion in disease can contribute to dyssynchrony in Ca2+ release.

Keywords: Action potential; Ca(2+) sparks; Cardiac myocytes; Excitation-contraction coupling; Heart; Intracellular Ca(2+).


Conflict of interest statement

Declaration of Competing Interest The authors declare no competing interest.

Figures

Fig. 1
Fig. 1. Ca2+ release latency during an AP.
(A) Top panel shows the AP voltage-clamp waveform and the bottom panel the evoked Ca2+ current (nifedipine-sensitive). The insets show the same data at a slower time scale. Amplifier saturation effects during the upstroke of the AP were not completely removed by subtraction of the current recorded in nifedipine and led to an artifact at early times as indicated in grey. (B) Confocal line scan image of the normalized Fluo-5F fluorescence (F/F0) changes evoked by the AP shown in A. The transmitted light intensity (TL) of the line scan region is shown at the left and indicates z-line positions. The time base is the same for panels A & B. Note the high time resolution and relative uniformity in Ca2+ release at z-lines. The bottom panel shows the mean time course of Fluo-5F fluorescence (black line) together with local time course at the positions marked by the arrow heads. (C) Ca2+ sparks evoked by sequential AP clamp pulses in the presence of nifedipine. Note the much lower probability of Ca2+ release along the scan line and the beat-to-beat variation in position and timing. The red arrows indicate when Vm exceeds −40 mV during the AP upstroke. (D) Ca2+ spark (red bars, 170 events, n/N = 6/3) and Ca2+ transient latencies (blue bars, 721 z-lines, n/N = 7/3). (For interpretation of the references to colour in this figure legend, the reader is referred to the web version of this article.)
Fig. 2
Fig. 2. Ca2+ spark latencies in response to DP and RP.
(A) Exemplar confocal line scan images showing Ca2+ sparks in the presence of nifedipine at the indicated DP Vm. (B) Ca2+ spark rate during the first 20 ms (838 Ca2+ sparks, n/N = 14/6) (filled circles). The maximum rate of rise for Ca2+ transients for the same DP Vm is shown by blue triangles (218 Ca2+ transients, n/N = 14/8). There was no difference between these Vm dependencies when normalized (p > 0.999, Chi-squared test). (C) Corresponding Vm-dependence of mean (solid circles), median and interquartile range (grey bars) Ca2+ spark latency (1215 Ca2+ sparks, n/N = 14/8). The solid blue line shows an empirical bi-exponential fit to the mean data:LatencyDP=6.7(ev18.5+ev20.8) (r2 = 0.99). (D) Ca2+ sparks in response to RP (same cell as A). The inset shows the distribution of Ca2+ spark latency during DP to −30 mV. (E) Vm-dependence of Ca2+ spark latency during RP in the presence of nifedipine (1201 Ca2+ sparks, n/N = 15/7). The solid blue line shows an empirical exponential fit: LatencyRP=9.2ev39.6+3.3 (r2 = 0.96). The inset shows the distribution of Ca2+ spark latency during RP to −30 mV. (F) The coefficient of variation for DP-, RP- and AP-evoked Ca2+ spark latencies. For DP and RP, the Vm were − 30 to 10 mV (p-values from Mann-Whitney tests). (For interpretation of the references to colour in this figure legend, the reader is referred to the web version of this article.)
Fig. 3
Fig. 3. Simulation of ECC using reported LCC, RyR and dyad properties.
(A) Time course of average LCC Ca2+ flux by DP to the Vm indicated (5000 simulations each). (B) Vm-dependence of peak LCC Ca2+ flux from A. Note that the averaged single LCC currents in A,B are very similar to reported whole cell ICa data (e.g. [24,34]). (C) and (D) show experimental (black symbols, from Josephson et al. [27]) and model (red lines) for PO,LCC and koff,LCC respectively (E) A distance map for RyRs with RyR positions as shown by Asghari et al. [41]. (F) Calculated [Ca2+]dyad 4 nm from the surface sarcolemma at the indicated lateral distances from an open LCC (iCa = 0.2 pA for 1 ms). The lateral distances shown were chosen so that these data can be directly compared Soeller & Cannell [30], as well as to the RyR distance map shown in panel E. (For interpretation of the references to colour in this figure legend, the reader is referred to the web version of this article.)
Fig. 4
Fig. 4. Ca2+ release latency during voltage-clamp steps.
(A) Diagram showing modelled processes that contribute to the calculated Ca2+ release latency (from top to bottom): (i) DP to 0 mV with finite clamp speed (τ ~ 0.3 ms), (ii) LCC transitions from closed (‘C’) to open (‘O’) states, (iii) the corresponding Ca2+ influx (iCa), (iv) [Ca2+]dyad at an RyR location (indicated by colour, see inset). RyR locations were derived from electron microscopy data [41]. (v) Net RyR on rate and (vi) cumulative RyR open probability (∑po, RyR), where the first opening that triggers Ca2+ release is indicated (red arrow). (B) Simulated mean (solid lines) and 95% confidence intervals for Ca2+ release latencies for various RyR:LCC ratios and RP = ‒15, 0 and 15 mV (4000 simulations for each data point). The measured latencies during RP are shown at left (from Fig. 2E). (C) Simulated Vm-dependence of Ca2+ release latency for a 4:1 (purple) or 8:1 (green) RyR:LCC stoichiometry. (D) Corresponding Ca2+ spark rate. Inset shows RyR arrangements for the simulations. (For interpretation of the references to colour in this figure legend, the reader is referred to the web version of this article.)
Fig. 5
Fig. 5. Pspark and Pcpl during RP- and AP-evoked Ca2+ release.
(A) The fraction of Ca2+ sparks (Fspark) that were evoked by no LCC openings at each Vm (40 00 simulations each). The right-hand side shows the corresponding Fspark using the AP shown in Fig. 1A. The mean nO was 2.01 ± 0.01 (10,000 simulations). (B) The Vm-dependence of coupling fidelity (Pcpl) during RP. Pcpl for an AP is shown by a cross on the right. C) The exemplar AP waveform used in the computer model. D) Simulated Pspark using a 4:1 RyR:LCC stoichiometry for 1 (red bars) or 4 (blue bars) ICs. The mean latencies were 9.55 ± 0.06 ms (Pspark = 0.796, 10,000 simulations) and 5.61 ± 0.02 ms (Pspark = 0.997, 10,000 simulations) respectively. E) Average iCa during the AP and proportion involved in triggering Ca2+ transients (blue region). F) The PDFs for Ca2+ spark initiation during an AP (red) or RP to 0 mV (black). The results in E and F are the average of 50,000 simulations and the origin of the reduction Ca2+ release dyssynchrony associated with the AP compared to RP is highlighted by the green shaded regions. (For interpretation of the references to colour in this figure legend, the reader is referred to the web version of this article.)

Similar articles

References

    1. Fabiato A, Fabiato F. Contractions induced by a calcium-triggered release of calcium from the sarcoplasmic reticulum of single skinned cardiac cells. J Physiol. 1975;249:469–495. doi: 10.1113/jphysiol.1975.sp011026. - DOI - PMC - PubMed
    1. Cannell MB, Cheng H, Lederer WJ. Spatial non-uniformities in [Ca2+]i during excitation-contraction coupling in cardiac myocytes. Biophys J. 1994;67:15. doi: 10.1016/S0006-3495(94)80677-0. - DOI - PMC - PubMed
    1. Wier WG, Egan TM, López-López JR, Balke CW. Local control of excitation-contraction coupling in rat heart cells. J Physiol. 1994;474:463–471. doi: 10.1113/jphysiol.1994.sp020037. - DOI - PMC - PubMed
    1. Sutko JL, Kenyon JL. Ryanodine modification of cardiac muscle responses to potassium-free solutions. Evidence for inhibition of sarcoplasmic reticulum calcium release. J Gen Physiol. 1983;82:385–404. doi: 10.1085/jgp.82.3.385. - DOI - PMC - PubMed
    1. Lai FA, Anderson K, Rousseau E, Liu Q-Y, Meissner G. Evidence for a Ca2+ channel within the ryanodine receptor complex from cardiac sarcoplasmic reticulum. Biochem Biophys Res Commun. 1988;151:441–449. - PubMed

Publication types

MeSH terms

LinkOut - more resources