

Predicting emergency department visits and hospitalizations for patients with heart failure in home healthcare using a time series risk model
- PMID: 37433577
- PMCID: PMC10531127
- DOI: 10.1093/jamia/ocad129
Predicting emergency department visits and hospitalizations for patients with heart failure in home healthcare using a time series risk model
Abstract
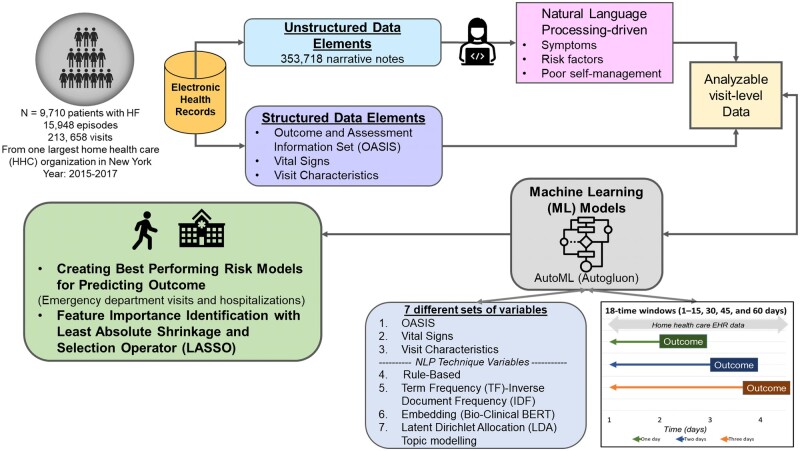
Objectives: Little is known about proactive risk assessment concerning emergency department (ED) visits and hospitalizations in patients with heart failure (HF) who receive home healthcare (HHC) services. This study developed a time series risk model for predicting ED visits and hospitalizations in patients with HF using longitudinal electronic health record data. We also explored which data sources yield the best-performing models over various time windows.
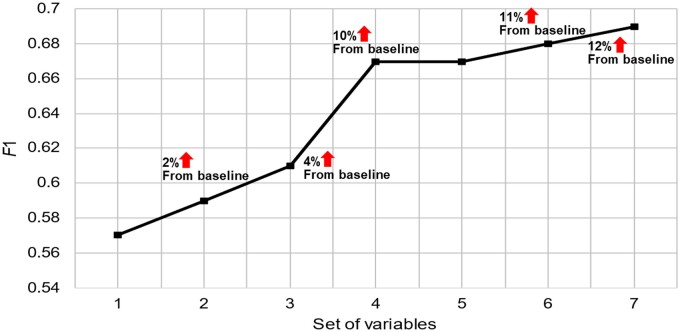
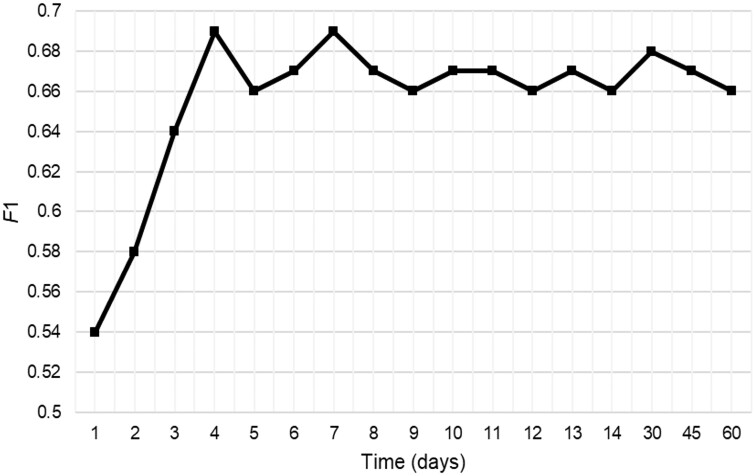
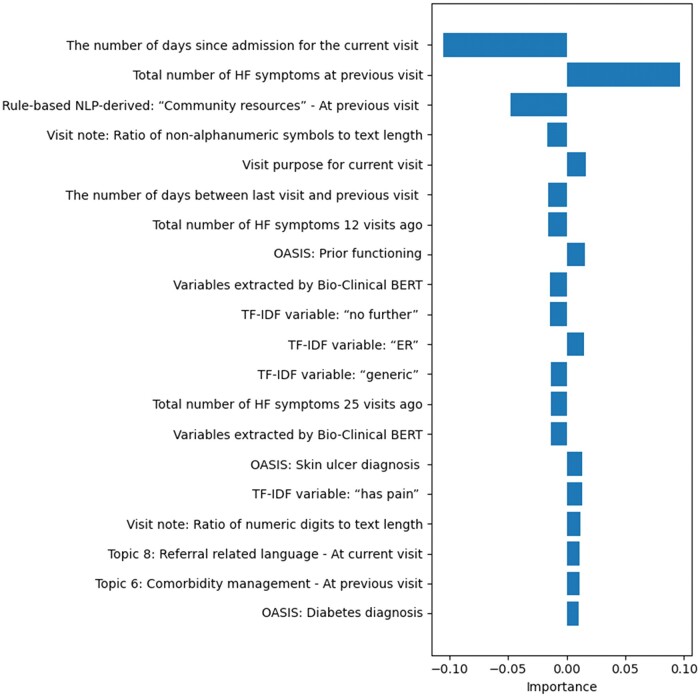
Materials and methods: We used data collected from 9362 patients from a large HHC agency. We iteratively developed risk models using both structured (eg, standard assessment tools, vital signs, visit characteristics) and unstructured data (eg, clinical notes). Seven specific sets of variables included: (1) the Outcome and Assessment Information Set, (2) vital signs, (3) visit characteristics, (4) rule-based natural language processing-derived variables, (5) term frequency-inverse document frequency variables, (6) Bio-Clinical Bidirectional Encoder Representations from Transformers variables, and (7) topic modeling. Risk models were developed for 18 time windows (1-15, 30, 45, and 60 days) before an ED visit or hospitalization. Risk prediction performances were compared using recall, precision, accuracy, F1, and area under the receiver operating curve (AUC).
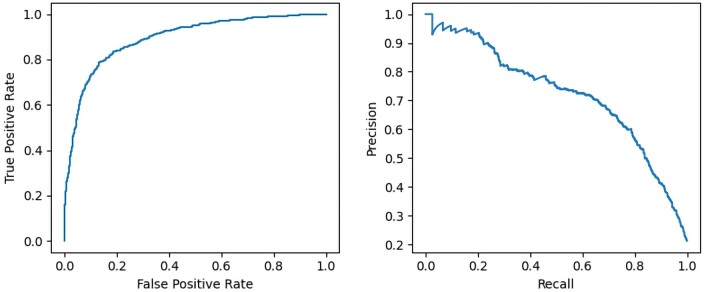
Results: The best-performing model was built using a combination of all 7 sets of variables and the time window of 4 days before an ED visit or hospitalization (AUC = 0.89 and F1 = 0.69).
Discussion and conclusion: This prediction model suggests that HHC clinicians can identify patients with HF at risk for visiting the ED or hospitalization within 4 days before the event, allowing for earlier targeted interventions.
Keywords: electronic health records; heart failure; home care services; machine learning; natural language processing; nursing informatics.
© The Author(s) 2023. Published by Oxford University Press on behalf of the American Medical Informatics Association. All rights reserved. For permissions, please email: journals.permissions@oup.com.
Conflict of interest statement
None declared.
Figures
References
-
- Bekelman DB, Havranek EP, Becker DM, et al. Symptoms, depression, and quality of life in patients with heart failure. J Card Fail 2007; 13 (8): 643–8. - PubMed
Publication types
MeSH terms
Grants and funding
LinkOut - more resources
Full Text Sources
Medical
Research Materials
Miscellaneous
