. 2023 Sep;68(9):1281-1294.
doi: 10.4187/respcare.11157. Epub 2023 Jul 11.

Esophageal Pressure Measurement: A Primer

Affiliations

Esophageal Pressure Measurement: A Primer

Eduardo Mireles-Cabodevila et al. Respir Care. 2023 Sep.

Abstract

Over the last decade, the literature exploring clinical applications for esophageal manometry in critically ill patients has increased. New mechanical ventilators and bedside monitors allow measurement of esophageal pressures easily at the bedside. The bedside clinician can now evaluate the magnitude and timing of esophageal pressure swings to evaluate respiratory muscle activity and transpulmonary pressures. The respiratory therapist has all the tools to perform these measurements to optimize mechanical ventilation delivery. However, as with any measurement, technique, fidelity, and accuracy are paramount. This primer highlights key knowledge necessary to perform measurements and highlights areas of both uncertainty and ongoing development.

Keywords: PEEP; esophageal pressure measurement; lung-protective ventilation; mechanical ventilation; respiratory system driving pressure; transpulmonary driving pressure.


Conflict of interest statement

Dr Mireles-Cabodevila discloses a relationship with IngMar Medical. Mr Chatburn discloses relationships with IngMar Medical, Inovytec, Ventis, AutoMedx, Vyaire, Aires, and Stimdia. The remaining authors have disclosed no conflicts of interest.

Figures

Fig. 1.
Fig. 1.
Relationship of the esophagus with the pleural space and airway. Representative computed tomography of the chest of a patient with an orogastric tube. A and B: upper and mid thorax; note the relationship of the trachea, the esophagus, and the pleural space. C: lower thorax; notice the relationship of the heart with the esophagus. An esophageal catheter placed too high will transmit airway pressures and too low the heart will transmit large cardiac oscillations.
Fig. 2.
Fig. 2.
Diagram of the respiratory system with one-compartment lung and chest wall. The chest wall is subdivided into rib cage and diaphragmatic and abdominal wall components. The arrows labeled Δ muscle pressure (ΔPmus) indicate the positive directions of the corresponding Pmus differences. The diagram shows the pressure difference formulas color coded to allow better understanding of the terms transalveolar and transpulmonary pressure difference. From reference 10. ΔPmus = muscle pressure difference; di = diaphragm; Paw = pressure at the airway opening; PA = alveolar pressure; Ppl = pressure in the intrapleural space; RC = rib cage; BS = body surface; ab = abdomen; Ptp = transalveolar pressure; Ptp = transpulmonary pressure.
Fig. 3.
Fig. 3.
Computed tomography of the chest highlighting the pleural pressure (Ppl) gradient and dependent and non-dependent areas of the lung. Line A demonstrates the Ppl at the non-dependent areas of the lung. Line B demonstrates the mid-lung Ppl; note the yellow circle is the esophagus and is the location where Ppl is being measured. Line C is the pressure at the dependent areas of the lung. The asterisk demonstrates collapse/atelectasis of the injured lung. The Ppl gradient is the difference in pressure from line A to C. The blue line outlines the pleura. The red line outlines the heart.
Fig. 4.
Fig. 4.
Demonstration of the esophageal pressure waveform during the insertion of an esophageal balloon. Paw = airway pressure; Pes = esophageal pressure; Pg = gastric pressure; PS = pressure support. From reference 4 with permission.
Fig. 5.
Fig. 5.
Occlusion test. Panel A demonstrates the pressure at the airway opening (Paw) (red line) and esophageal pressure (Pes) (blue line) during an end-expiratory (EE) pause maneuver (occlusion) in a patient with inspiratory effort. Notice the overlap of pressures during inspiratory effort. The blue arrow is the ΔPes and the red arrow the ΔPaw used to calculate the ratio. Panel B demonstrates the Paw and Pes in a patient without any effort and on mechanical ventilation. Between the mechanical breaths (*), an EE pause maneuver is performed along with gentle compressions of the chest. The blue arrow is the ΔPes and the red arrow the ΔPaw used to calculate the ratio. Adapted with permission from reference 4. Pes = esophageal pressure; Paw = pressure at the airway opening.
Fig. 6.
Fig. 6.
Site of measurements to evaluate the transpulmonary pressure (Ptp). Top panel has the pressure at the airway opening (Paw), the middle panel the esophageal pressure (Pes) as a surrogate for pleural pressure. And the lower panel has the Ptp. Asterisk highlights the cardiac oscillations. A: the end-expiratory (EE) Paw; B: the EE Pes; C: the EE Ptp; D: the end-inspiratory (EI) Paw; E: the EI Pes; F: the EI Ptp. Modified from reference 30. Reprinted with permission from reference 30. Paw = pressure at the airway opening; Pes = esophageal pressure; Ptp = transpulmonary pressure.
Fig. 7.
Fig. 7.
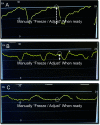
Esophageal pressure (Pes) measurement using a bedside monitor. The effect of inspiratory and expiratory muscles on Pes measurements. The measurements are done on the pulmonary artery screen to allow freezing the screen. Scale is in mm Hg; to convert to cm H2O, multiply by 1.36. Bidirectional interrupted white arrow highlights the esophageal swing (ΔPes). Panel A: vigorous inspiratory and expiratory effort. ΔPes was 16 cm H2O; the end-expiratory (EE) Pes was 32.6 cm H2O. Notice the upslope on the expiratory phase. Panel B: same patient after administration of sedatives in preparation for neuromuscular blockade. The ΔPes is 3.4 cm H2O and EE Pes 25 cm H2O. The asterisk highlights a rise in pressure due to late cycle of the mechanical breath. Panel C demonstrates the patient Pes during neuromuscular blockade. The ΔPes is absent. The rise in Pes reflects the transmission of the mechanical breath to the pleural space. The EE Pes is now 23 cm H2O. The circle highlights the EE pressure. PA = pulmonary artery.
Fig. 8.
Fig. 8.
Graphic depiction of the esophageal pressure (Pes) and the pressure at the airway opening, timing of events, and measurement of the esophageal swing. 1: Start of breath by Pes; 2: start of the mechanical ventilation breath; 3: end of breath by Pes; 4: end of mechanical ventilation breath. A is the end-expiratory Pes. B is the nadir of the Pes. Reprinted with permission from Cleveland Clinic Foundation. Pes = esophageal pressure; Paw = pressure at the airway opening.

Similar articles

Cited by

References

    1. Garegnani LI, Rosón Rodriguez P, Franco JVA, Escobar Liquitay C. Esophageal pressure monitoring during mechanical ventilation in critically ill adult patients: a systematic review and meta-analysis. Med Intensiva 2021;45(7):387–394. - PubMed
    1. Robin ED. The cult of the Swan-Ganz catheter. Overuse and abuse of pulmonary flow catheters. Ann Intern Med 1985;103(3):445–449. - PubMed
    1. Gattinoni L, Carlesso E, Santini A. Physiology versus evidence-based guidance for critical care practice. Crit Care 2015;19(S3):5. - PMC - PubMed
    1. Akoumianaki E, Maggiore SM, Valenza F, Bellani G, Jubran A, Loring SH, et al. ; PLUG Working Group (Acute Respiratory Failure Section of the European Society of Intensive Care Medicine). The application of esophageal pressure measurement in patients with respiratory failure. Am J Respir Crit Care Med 2014;189(5):520–531. - PubMed
    1. Pham T, Telias I, Beitler JR. Esophageal manometry. Respir Care 2020;65(6):772–792. - PMC - PubMed

LinkOut - more resources