. 2023 Jul 11;14(1):4120.
doi: 10.1038/s41467-023-39805-7.

Synaptotagmin-1-dependent phasic axonal dopamine release is dispensable for basic motor behaviors in mice

Affiliations

Synaptotagmin-1-dependent phasic axonal dopamine release is dispensable for basic motor behaviors in mice

Benoît Delignat-Lavaud et al. Nat Commun. .

Abstract

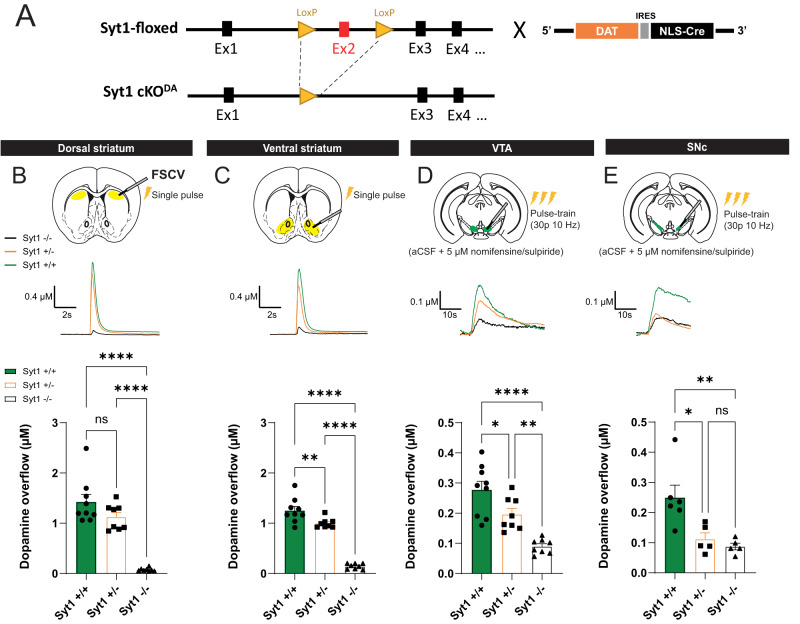
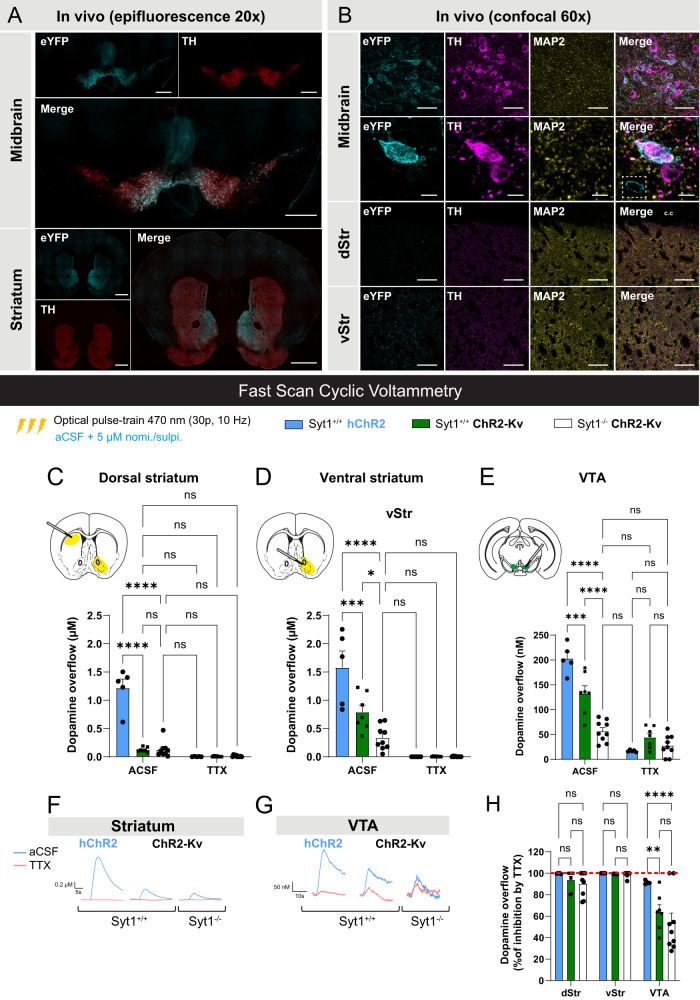
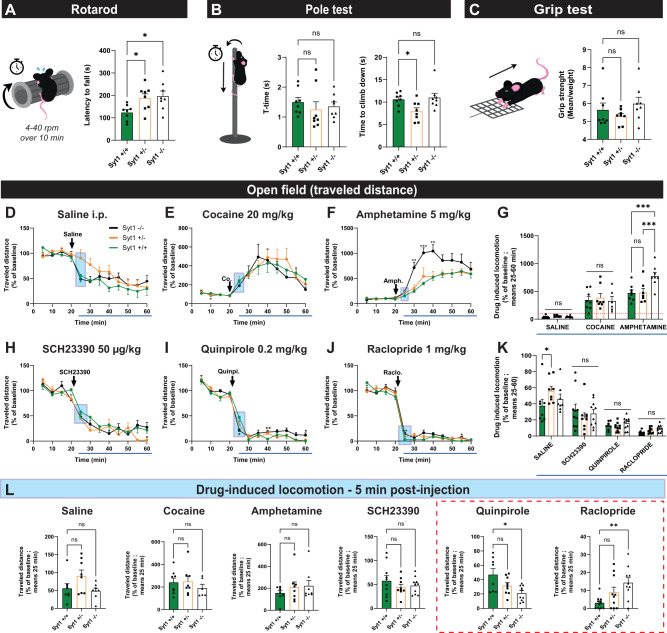
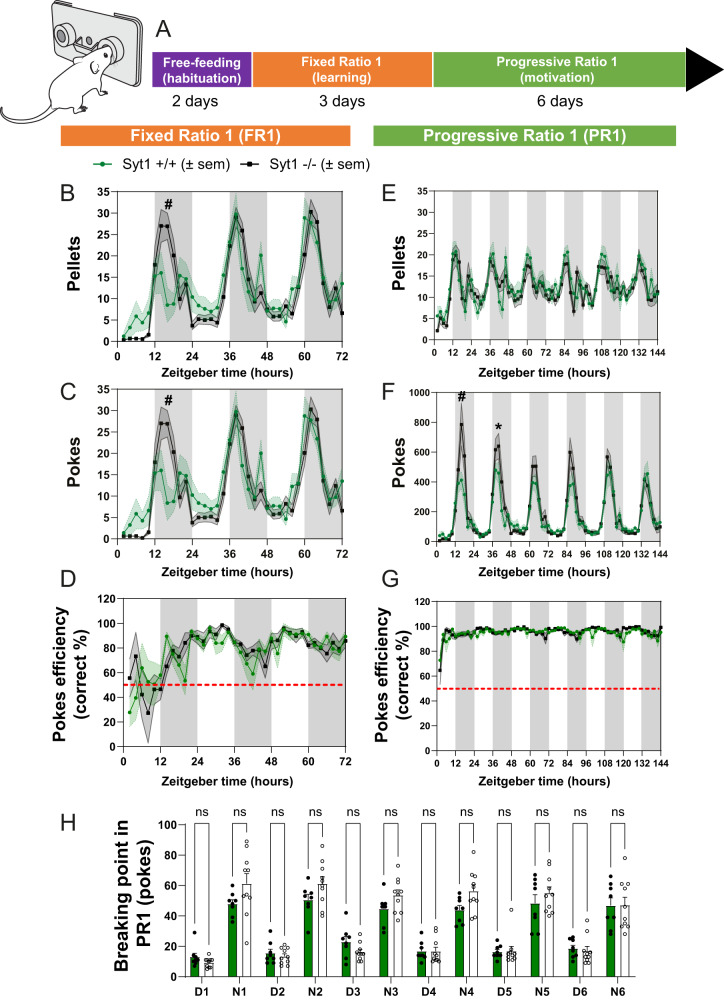
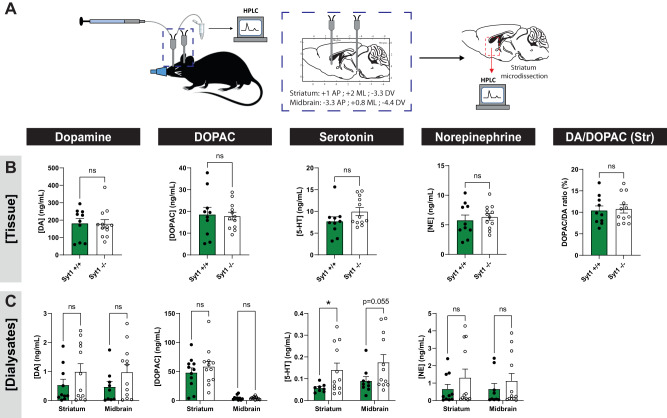
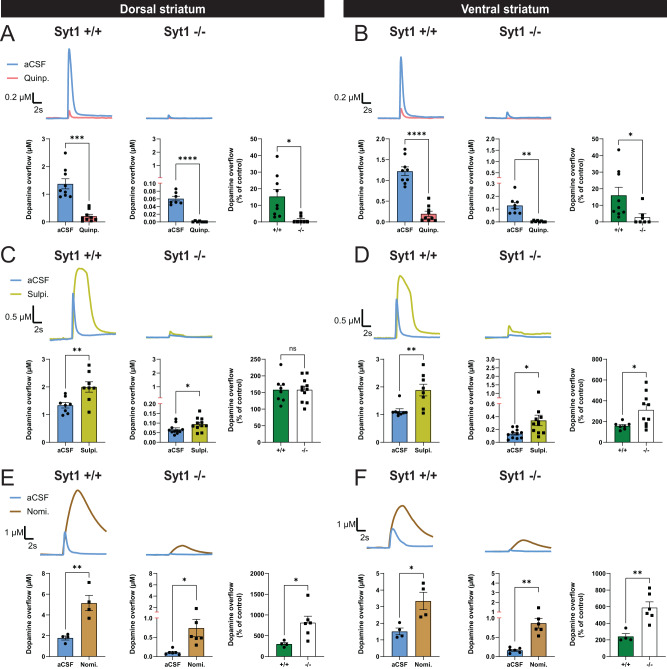
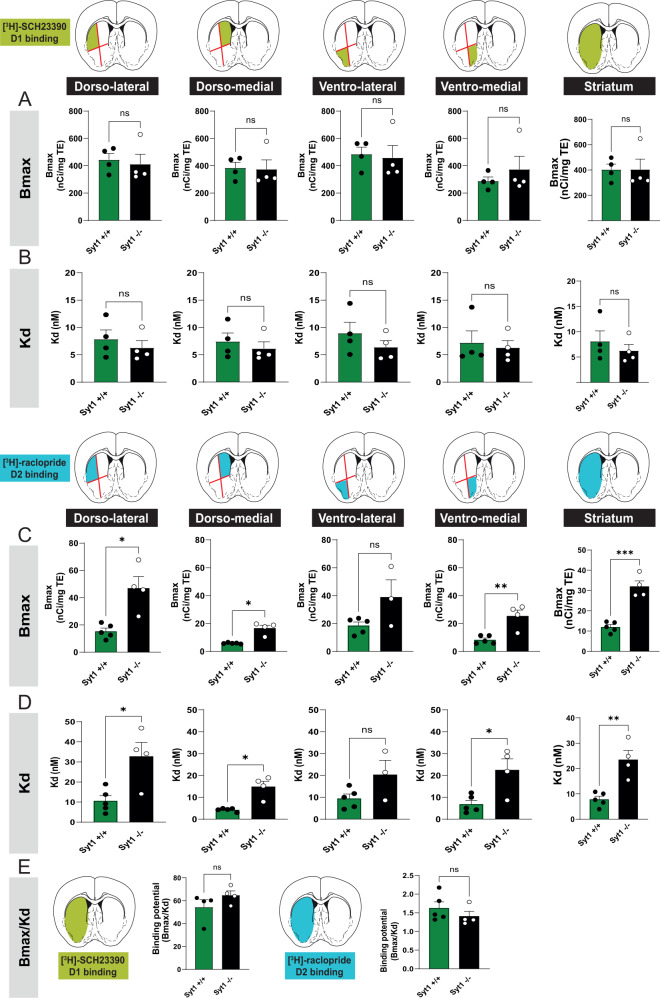
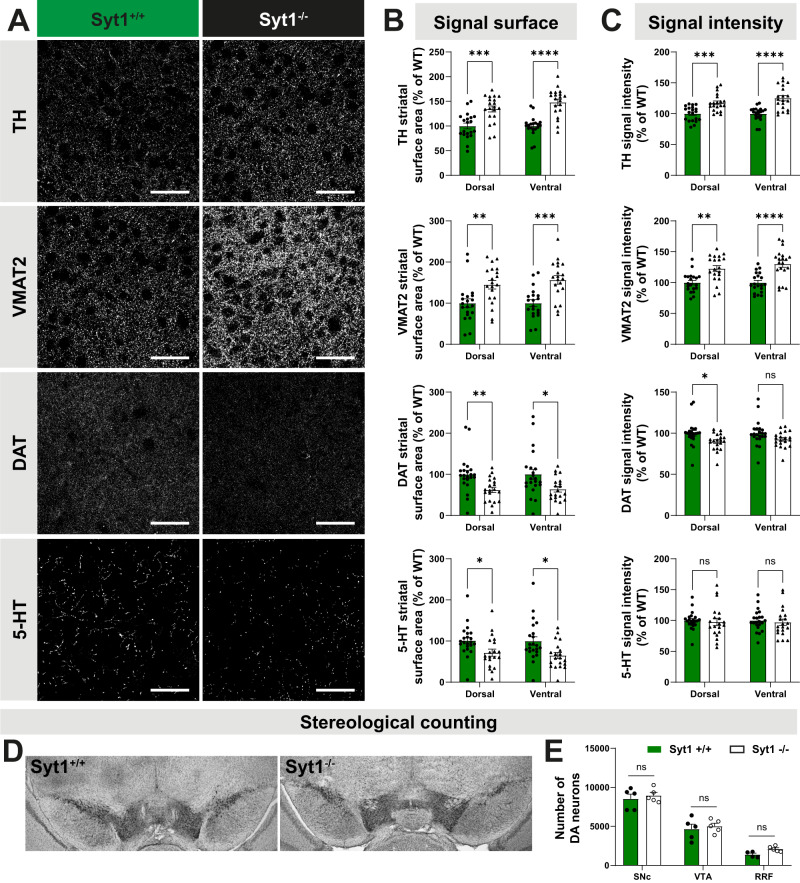
In Parkinson's disease (PD), motor dysfunctions only become apparent after extensive loss of DA innervation. This resilience has been hypothesized to be due to the ability of many motor behaviors to be sustained through a diffuse basal tone of DA; but experimental evidence for this is limited. Here we show that conditional deletion of the calcium sensor synaptotagmin-1 (Syt1) in DA neurons (Syt1 cKODA mice) abrogates most activity-dependent axonal DA release in the striatum and mesencephalon, leaving somatodendritic (STD) DA release intact. Strikingly, Syt1 cKODA mice showed intact performance in multiple unconditioned DA-dependent motor tasks and even in a task evaluating conditioned motivation for food. Considering that basal extracellular DA levels in the striatum were unchanged, our findings suggest that activity-dependent DA release is dispensable for such tasks and that they can be sustained by a basal tone of extracellular DA. Taken together, our findings reveal the striking resilience of DA-dependent motor functions in the context of a near-abolition of phasic DA release, shedding new light on why extensive loss of DA innervation is required to reveal motor dysfunctions in PD.


Conflict of interest statement

The authors declare no competing interests.

Figures

Fig. 1
Fig. 1. Syt1 is the main calcium sensor for fast axonal dopamine release.
A Generation of conditional knockout of Syt1 in DA neurons by crossing Syt1-floxed mice (Syt1lox/lox) with DATIREScre mice. B Fast-scan cyclic voltammetry recording of Syt1 cKODA mice in the dorsal striatum. Representative traces (top) and quantification of peak amplitude (bottom) obtained with single-pulse electrical stimulation (1 ms, 400 µA) in Syt1+/+ (n = 18 slices/9 mice), Syt+/− (n = 16/8) and Syt1−/− mice (n = 16/8). C Same, but in the ventral striatum (NAc core and shell, n = 18 slices/9 mice in Syt1+/+, n = 16/8 in Syt+/− and n = 16/8 in Syt1−/−). D Representative traces (top) and quantification of peak amplitude (bottom) obtained in the VTA (n = 16 slices/9 mice in Syt1+/+, n = 14/8 in Syt+/− and n = 16/8 in Syt1−/−) with aCSF containing nomifensine (DAT blocker) and sulpiride (D2 antagonist) (both at 5 µM), and pulse-train stimulation (30 pulses of 1 ms at 10 Hz, 400 µA). E Same for the SNc (n = 11 slices/6 mice in Syt1+/+, n = 10/5 in Syt+/− and n = 9/5 in Syt1−/−). Error bars represent ± SEM and the statistical analysis was carried out by one-way ANOVAs followed by Tukey tests (ns, non-significant; *P < 0.05; **P < 0.01; ***P < 0.001; ****P < 0.0001). Source data are provided as a Source Data file.
Fig. 2
Fig. 2. Somatodendritic optogenetics reveals unaltered STD DA release in the absence of Syt1.
A Immunohistochemistry in brain slices of adult Syt1 cKODA mice infected with AAV2/5-hsyn-DIO-ChR2-eYFP-Kv (n = 4 mice, one representative set of images is shown), showing expression of ChR2-Kv (eYFP) in the whole ventral mesencephalon (scale bar = 500 µm) and striatum (scale bar = 1 mm) using epifluorescence microscopy at ×20. B Expression of ChR2-Kv in the same mice evaluated by confocal microscopy at ×60 shows infected DA neurons (TH) in the midbrain (top panel, scale bar = 50 µm). Optical zoom and z-stack on an infected DA neuron showing the membrane distribution of the eYFP signal (bottom panel, scale bar = 10 µm, insert in the merge image shows the eYFP signal at a single focal plane). Evaluation of the eYFP signal in the striatum shows no axonal processes in the dorsal sector but a small contingent of positive fibers in the ventral sector of the striatum (scale bar = 50 µm). CE Fast-scan cyclic voltammetry recordings with average [DA]o peaks obtained in the dorsal striatum (C), ventral striatum (D) and VTA (E) slices of infected Syt1+/+ and Syt1−/− mice with AAV2/5-hsyn-DIO-ChR2-eYFP-Kv (ChR2-Kv, n = 14 slices/7 mice in Syt1+/+, n = 17 slices/9 mice in Syt1−/−) or AAV5-EF1a-DIO-hChR2(H134R)-eYFP (control hChR2, n = 10 slices/5 mice). Representative traces for the striatum (dorsal + ventral) and VTA are shown in (F) and (G). DA release was optically triggered in each region using pulse-train stimulation (30 pulses of 470 nm blue light at 10 Hz) in ACSF containing 5 µM of nomifensine and sulpiride. H TTX (1 µM) effect on average [DA]o peaks in the striatum and the VTA (% of inhibition) (n = 14 slices/7 mice in Syt1+/+, n = 17 slices/9 mice in Syt1−/−). Error bars represent ±  SEM and the statistical analysis was carried out by two-way ANOVA followed by Šidák (E) and Tuckey (C, D, H) tests (ns, non-significant; *P < 0.05; **P < 0.01; ***P < 0.001; ****P < 0.0001). Source data are provided as a Source Data file.
Fig. 3
Fig. 3. Syt1 cKODA mice do not exhibit any substantial motor defects.
A Latency to fall from the device during the rotarod test for Syt1+/+, Syt1+/−, and Syt1−/− mice (n = 8, mean of three attempts). B Time for Syt1+/+, Syt1+/−, and Syt1−/− mice (n = 8) to turn (t-turn) and climb down the vertical pole (mean of three attempts/2 days). C Forelimb grip strength (mean of three trials/weight) developed by Syt1+/+, Syt1+/− and Syt1−/− mice (n = 8), using a force sensor connected to a grid. Statistical analysis for (AC) were carried out by one-way ANOVAs followed by Dunnett tests. DL Locomotion of Syt1 cKODA mice measured as traveled distance (% of a 20 min baseline) under saline treatment (n = 8 mice) (D), cocaine at 20 mg/kg (n = 8 Syt1+/+/Syt1+/− and 6 Syt1−/−) (E), amphetamine at 5 mg/kg (n = 8 mice) (F), the D1 agonist SCH23390 at 50 µg/kg (n = 10 Syt1+/+/Syt1−/− and 9 Syt1+/−) (H), the D2 agonist quinpirole at 0.2 mg/kg (n = 10 Syt1−/−/Sy+/− and 8 Syt1+/+) (I) and the D2 antagonist raclopride at 1 mg/kg (n = 10 mice) (J). Statistical analyses for (DJ) were carried out by two-way ANOVAs followed by Dunnett tests. G, K Average drug-induced locomotion (% of baseline) during a 40 min recording period (mean between 25 and 60 min) are represented for cocaine/amphetamine treatment (G) and for SCH23390/quinpirole/raclopride treatments (K). Blue rectangles indicate the average traveled distance for each mouse at the 5 min time point after receiving an i.p. injection of each tested drugs (L). Statistical analysis was carried out by one-way ANOVAs followed by Dunnett tests (AC, L), mixed-effects ANOVA model with the Geisser–Greenhouse correction (DF, HJ) and two-way ANOVAs followed by Tuckey tests (G, K). Error bars represent ± SEM (ns, non-significant; *P < 0.05; **P < 0.01; ***P < 0.001; ****P < 0.0001). Source data are provided as a Source Data file.
Fig. 4
Fig. 4. Syt1 is dispensable for motivation to work for food.
A Schematic representation of operant food-rewarded nose-poking protocol in Syt1 cKODA mice. B, C Time course of the number of pellets earned (B) and pokes made (C) by Syt1+/+ (green lines, n = 8 mice) and Syt1−/− (black lines, n = 10 mice) mice using FED3 feeding devices over 3 days in a fixed ratio (FR) paradigm (1 pellet for 1 poke). D Efficiency of the pokes (% of correct port entries) in the FR1 condition. E, F Time course of the number of pellets earned by Syt1+/+ and Syt1−/− mice (E) and pokes (F) over 6 days in a progressive ratio (PR) 1 paradigm (the nose-poking requirement began on FR1 and increased by 1 poke each time a pellet was earned. The requirement was reset to FR1 if no poking was performed on either the active or inactive port for 30 min). G Efficiency of the pokes (% of correct port entries) in the PR1 condition. H Maximal breaking points (poke thresholds) achieved by Syt1+/+ (green, n = 8) and Syt1−/− (black, n = 10) during each day (D) and night (N) session of the progressive ratio protocol. For each experiment, mice were placed in a 12 h/12 h light/dark cycle and the Zeitgeber time corresponds to the onset of the devices. Statistical analyses were carried out by mixed-effects ANOVA model with the Geisser–Greenhouse correction (AF) and two-way ANOVAs followed by Šidák’s test (G). Error shading bands in (AF) (green for Syt1+/+, light gray for Syt1−/−) and error bars in (G) represent ± SEM (ns, non-significant; *P < 0.05; #P < 0.0001). The schematic diagram of the FED3 nose-poking device is modified from https://github.com/KravitzLabDevices/FED3/blob/main/photos/mouse_feeder.svg. Source data are provided as a Source Data file.
Fig. 5
Fig. 5. Basal extracellular DA levels and total tissue DA are not altered in Syt1 cKODA mice.
A Schematic representation of the intracerebral microdialysis protocol performed on anesthetized Syt1 cKODA and control mice. B Quantification of total DA, DOPAC, serotonin and norepinephrine striatal content (ng/mg of total proteins) and DA/DOPAC ratio (n = 10 Syt1+/+ and 12 Syt1−/−). Statistical analysis was carried out by two-tailed unpaired t test. C Extracellular quantification (ng/mL) by microdialysis of the same molecules in the dorsal striatum (n (Syt1+/+/ Syt1−/− mice) = 10/12 for DA, 11/12 for DOPAC, 8/12 for 5-HT and 10/12 for NE) and in the mesencephalon (n (Syt1+/+/ Syt1−/− mice) = 9/12 for DA, 10/12 for DOPAC, 9/12 for 5-HT and 9/12 for NE) of Syt1 cKODA mice, with an average of three dialysates for each animal. Statistical analysis was carried out by two-way ANOVAs followed by Šidák’s tests. Error bars represent ± SEM (ns, non-significant; *P < 0.05; **P < 0.01; ***P < 0.001; ****P < 0.0001). Source data are provided as a Source Data file.
Fig. 6
Fig. 6. Increased D2 autoreceptor function in Syt1 cKODA mice.
A FSCV representative traces (top) and quantification of peak DA overflow amplitude (bottom) obtained in Syt1+/+ (n = 9) and Syt1−/− (n = 7) mice with single-pulse electrical stimulation and aCSF containing 1 µM of the D2 agonist quinpirole. B Same, but in the ventral striatum (n = 9 Syt1+/+ and 8 Syt1−/−). C FSCV representative traces (top) and quantification of peak DA overflow amplitude (bottom) obtained in Syt1+/+ (n = 8) and Syt1−/− (n = 11) mice with pulse-train stimulation and aCSF containing 5 µM of the D2 antagonist sulpiride. D Same, but in the ventral striatum (n = 8 Syt1+/+ and 11 Syt1−/−). E FSCV representative traces (top) and quantification of peak amplitude (bottom) obtained in Syt1+/+ (n = 4) and Syt1−/− (n = 6) mice with pulse-train stimulation and aCSF containing 5 µM of the DAT blocker nomifensine. F Same, but in the ventral striatum (n = 4 Syt1+/+ and 6 Syt1−/−). For each tested drug, the effect on DA release (% of control) for both genotypes is indicated in the right panel. Statistical analysis was carried out by two-way ANOVAs followed by Šidák’s corrections. Error bars represent ± SEM (ns, non-significant; *P < 0.05; **P < 0.01; ***P < 0.001; ****P < 0.0001). Source data are provided as a Source Data file.
Fig. 7
Fig. 7. Higher D2 receptor density and lower D2 affinity in Syt1 cKODA mice.
A, B Density of the dopamine D1 receptors (Bmax) (A) and affinity (Kd) for the radioligand [3H]-SCH23390 (B) in Syt1+/+ (n = 4) and Syt1−/− (n = 4) mice. C, D Density of the dopamine D2 receptors (Bmax) (C) and affinity (Kd) for the radioligand [3H]-raclopride (D) in Syt1+/+ (n = 5) and Syt1−/− mice (n = 4). Each binding was analyzed with a series of four serial coronal sections (bregma +1.34 mm to +0.38 mm) and by dividing each section into four quadrants (dorso-lateral, ventrolateral, dorso-medial, and ventro-medial). E Binding potential of D1 and D2 receptors defined as the Bmax/Kd ratio (n = 4 Syt1+/+/4 Syt1−/− for D1 and 5 Syt1+/+/4 Syt1−/− for D2). The data followed a log-normal distribution and two-tailed unpaired t tests were done after the data were converted to a log scale. Error bars represent ± SEM (ns, non-significant; *P < 0.05; **P < 0.01; ***P < 0.001; ****P < 0.0001). Source data are provided as a Source Data file.
Fig. 8
Fig. 8. Adaptations of DA innervation in the striatum of Syt1 cKODA mice.
A Immunochemistry of striatal slices from 10 to 12-week-old Syt1+/+ and Syt1−/− mice (60x confocal) using (from top to bottom): tyrosine hydroxylase (TH), vesicular monoamine transporter 2 (VMAT2), dopamine transporter (DAT) and serotonin (5-HT) immunostainings. Scale bar = 50 µm. B Quantification of each signal surface (% of WT) in the dorsal and ventral striatum (n = 20 hemispheres/10 mice for both genotypes). C Same with signal intensity (n = 20 hemispheres/10 mice for both genotypes). D TH-immunoreactive cells in the midbrain of Syt1+/+ and Syt1−/− mice, identified by the brown DAB staining. E Stereological counts of DA neurons in the SNc (n = 5 Syt1+/+/5 Syt1−/−), VTA (n = 5/5), and RRF (n = 4/5). Unbiased stereological counting was performed by a blinded observer to estimate the number of DA neurons. Statistical analysis was carried out by two-way ANOVAs followed by Šidák’s corrections. Error bars represent ± SEM (ns, non-significant; *P < 0.05; **P < 0.01; ***P < 0.001; ****P < 0.0001). Source data are provided as a Source Data file.
Fig. 9
Fig. 9. Acute deletion of Syt1 in adult mice impairs DA release but prevents adaptations.
A Stereotaxic injections of AAV9-TH-Cre and AAV9-TH-FusionRed (control) viruses in 6–7-week-old Syt1lox/lox mice effectively infects the whole ventral mesencephalon (epifluorescence imaging of TH (cyan) and FusionRed (RFP) (Cre, magenta) immunostainings were performed in four mice per condition and one representative image of the infection is represented). B FSCV recordings (DA overflow in µM) in the dorsal and ventral striatum (single electrical pulse 1 ms, 400 µA, normal aCSF) and VTA (pulse-train 30p, 1 ms, 400 µA, 10 Hz in presence of 5 µM of nomifensine/sulpiride) from Syt1lox/lox mice injected with AAV9-TH-Cre (n = 8) and AAV9-TH-Control viruses (n = 7). C Immunohistochemistry of striatal slices from 9 to 10-week-old Syt1lox/lox injected with AAV9-TH-Cre (black) and AAV9-TH-control (green) illustrating TH and DAT immunostaining (×60 confocal). Scale bar = 50 µm. D Quantification of each signal surface (% of WT) in the dorsal and ventral striatum of injected mice (n = 12 hemispheres/6 mice for each condition). E Same with signal intensity (n = 12 hemispheres/6 mice for each condition). Statistical analysis was carried out by two-way ANOVAs followed by Šidák’s corrections. Error bars represent ± SEM (ns, non-significant; *P < 0.05; **P < 0.01; ***P < 0.001; ****P < 0.0001). Source data are provided as a Source Data file.

References

    1. Schultz W. Multiple dopamine functions at different time courses. Annu. Rev. Neurosci. 2007;30:259–288. doi: 10.1146/annurev.neuro.28.061604.135722. - DOI - PubMed
    1. Surmeier DJ, Graves SM, Shen W. Dopaminergic modulation of striatal networks in health and Parkinson’s disease. Curr. Opin. Neurobiol. 2014;29:109–117. doi: 10.1016/j.conb.2014.07.008. - DOI - PMC - PubMed
    1. Hauber W. Impairments of movement initiation and execution induced by a blockade of dopamine D1 or D2 receptors are reversed by a blockade of N-methyl-D-aspartate receptors. Neuroscience. 1996;73:121–130. doi: 10.1016/0306-4522(96)00036-X. - DOI - PubMed
    1. Mercuri NB, Bernardi G. The ‘magic’ of l-dopa: why is it the gold standard Parkinson’s disease therapy? Trends Pharmacol. Sci. 2005;26:341–344. doi: 10.1016/j.tips.2005.05.002. - DOI - PubMed
    1. Golden JP, et al. Dopamine-dependent compensation maintains motor behavior in mice with developmental ablation of dopaminergic neurons. J. Neurosci. 2013;33:17095–17107. doi: 10.1523/JNEUROSCI.0890-13.2013. - DOI - PMC - PubMed

Publication types