. 2023 Jul 11;14(1):4115.
doi: 10.1038/s41467-023-39447-9.

Spatial Transcriptomics-correlated Electron Microscopy maps transcriptional and ultrastructural responses to brain injury

Affiliations

Spatial Transcriptomics-correlated Electron Microscopy maps transcriptional and ultrastructural responses to brain injury

Peter Androvic et al. Nat Commun. .

Abstract

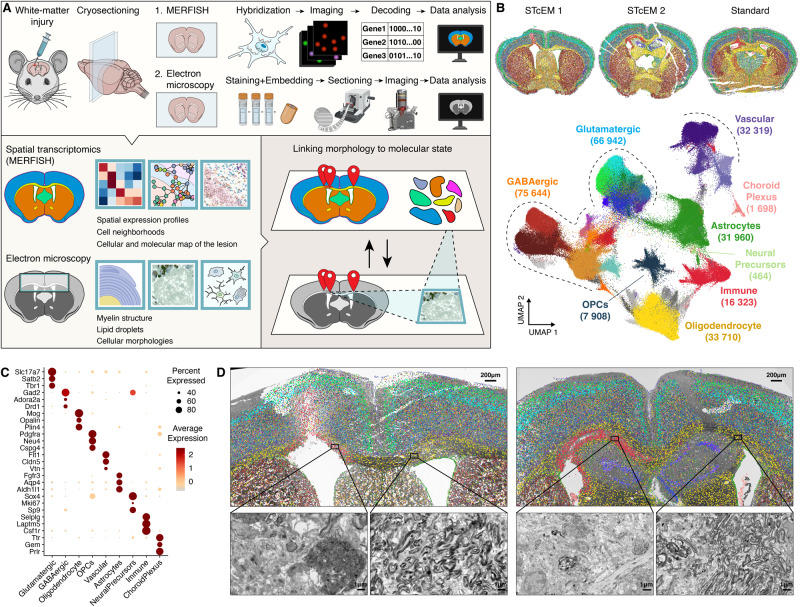
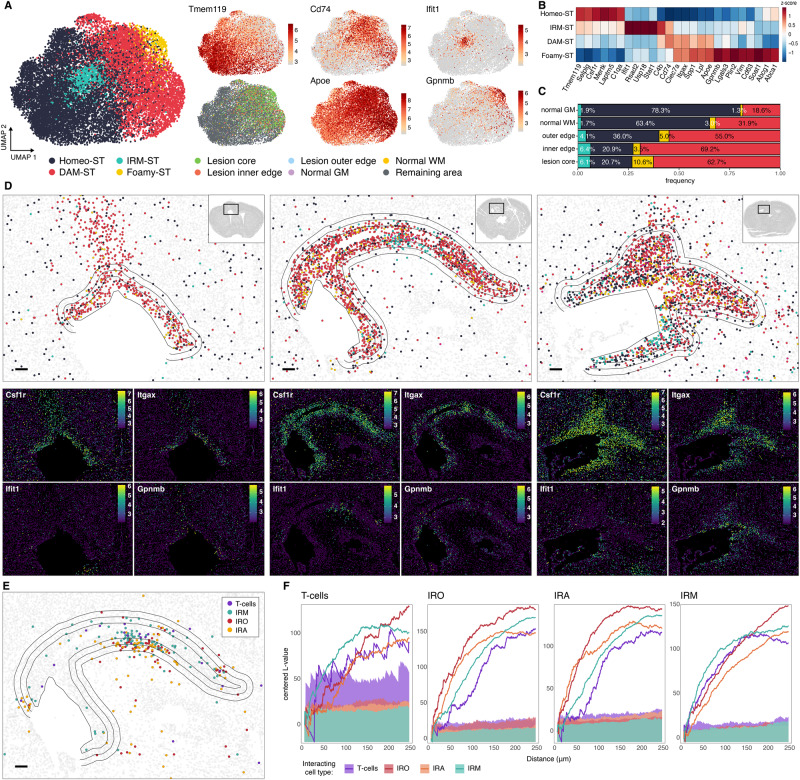
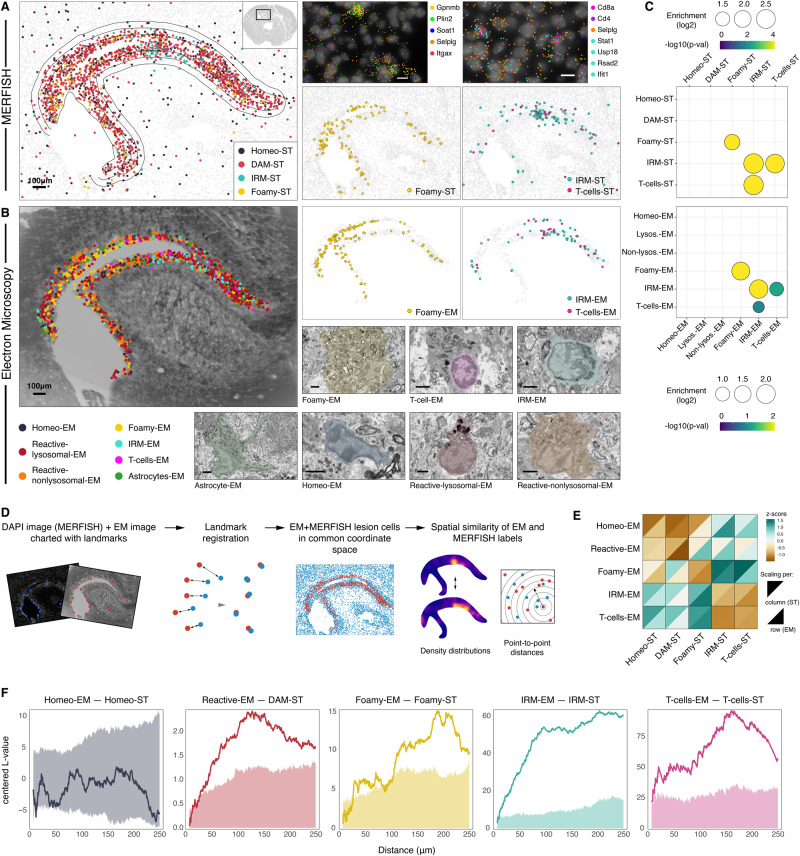
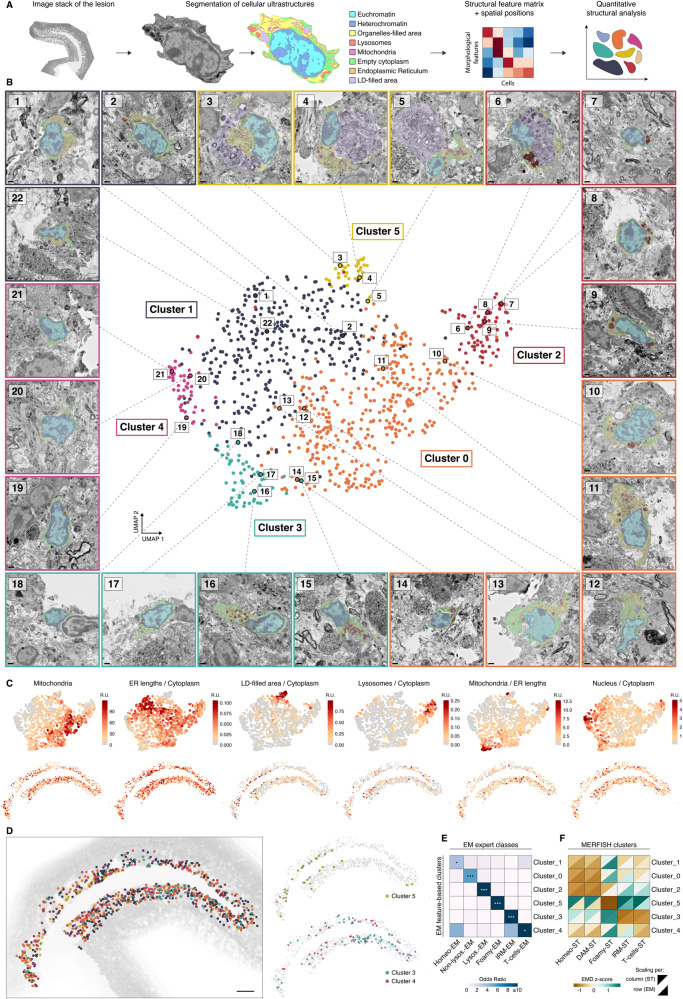
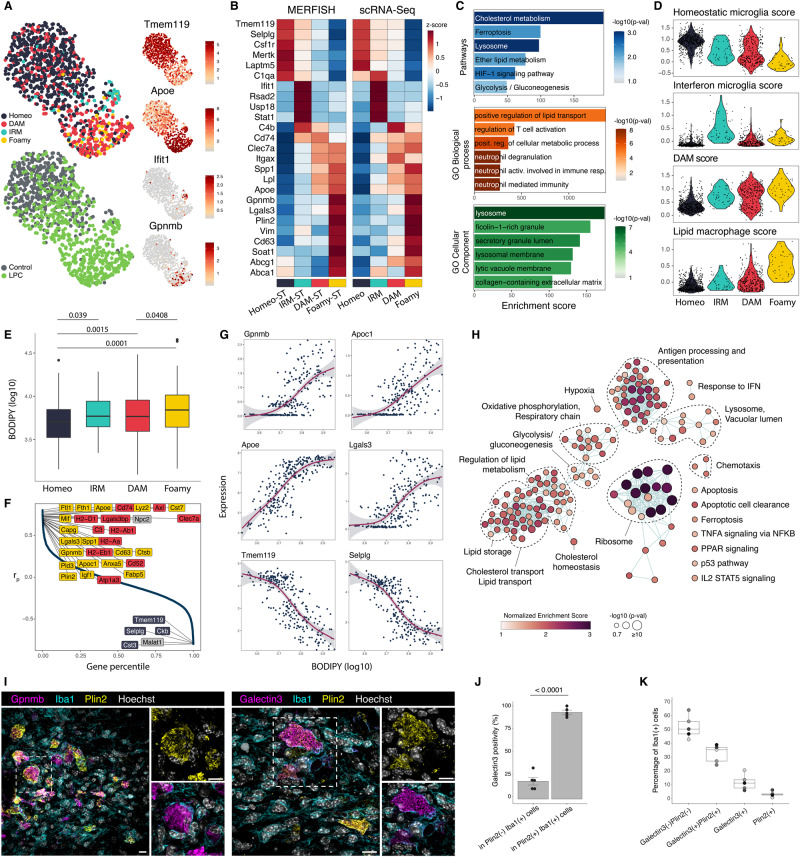
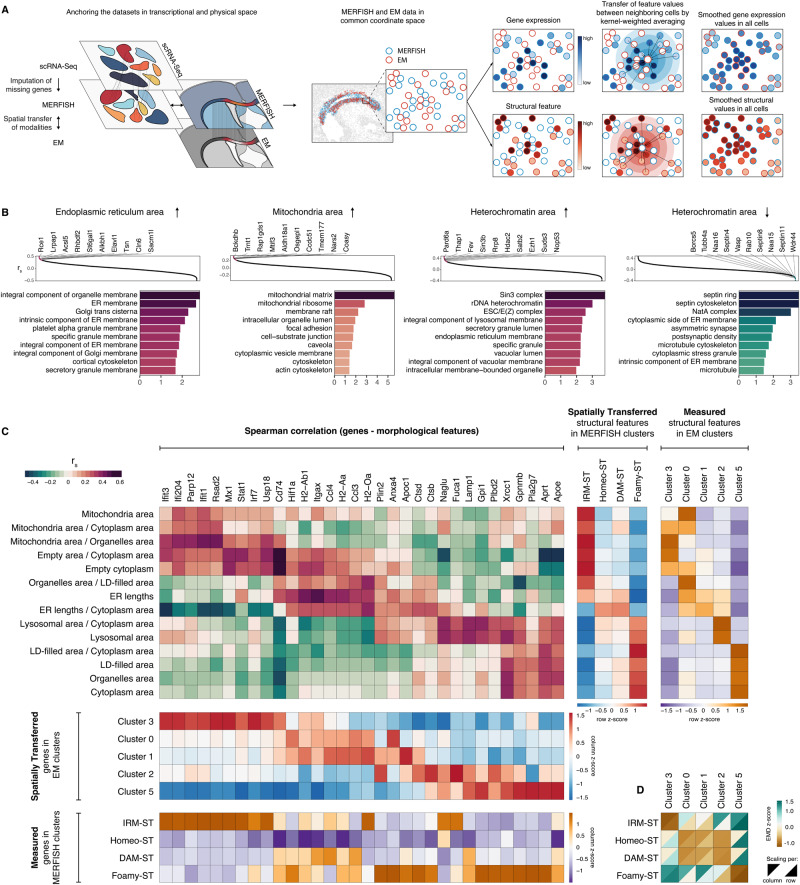
Understanding the complexity of cellular function within a tissue necessitates the combination of multiple phenotypic readouts. Here, we developed a method that links spatially-resolved gene expression of single cells with their ultrastructural morphology by integrating multiplexed error-robust fluorescence in situ hybridization (MERFISH) and large area volume electron microscopy (EM) on adjacent tissue sections. Using this method, we characterized in situ ultrastructural and transcriptional responses of glial cells and infiltrating T-cells after demyelinating brain injury in male mice. We identified a population of lipid-loaded "foamy" microglia located in the center of remyelinating lesion, as well as rare interferon-responsive microglia, oligodendrocytes, and astrocytes that co-localized with T-cells. We validated our findings using immunocytochemistry and lipid staining-coupled single-cell RNA sequencing. Finally, by integrating these datasets, we detected correlations between full-transcriptome gene expression and ultrastructural features of microglia. Our results offer an integrative view of the spatial, ultrastructural, and transcriptional reorganization of single cells after demyelinating brain injury.


Conflict of interest statement

The authors declare no competing interests.

Figures

Fig. 1
Fig. 1. STcEM spatially links single-cell transcriptomes with tissue ultrastructure.
A Overview of the STcEM method. Adjacent sections of the same sample are processed in parallel by harmonized MERFISH and EM protocols, and spatially aligned to link transcriptional profiles with ultrastructure of the regions of interest. B Transcriptional identities of single cells with their spatial location in tissue (top) and embedded by UMAP (bottom). “STcEM” refers to modified MERFISH preparation from fixed-frozen sections, “Standard” refers to snap-frozen section. C Bubble plot showing expression of cell type markers in identified single cell populations. D MERFISH data registered onto the 2D overview EM micrograph. Zoomed-in areas show myelin structure in LPC-injected (left hemisphere) and uninjured (right hemisphere) white matter (corpus callosum). Images from two animals are shown. A was created with elements from BioRender.com.
Fig. 2
Fig. 2. MERFISH analysis of microglia and interferon-responsive cell states.
A UMAP plots of microglia colored by identified clusters (left), tissue region, and expression of marker genes (right). DAM disease-associated microglia, IRM IFN-responsive microglia. B Heatmap of average expression per microglia cluster. C Frequency of microglia clusters per tissue region. D MERFISH spatial plots of microglia clusters in the lesion area of three biological replicate sections (top) and spatial expression of selected marker genes (bottom). Polygons depict segmented lesion areas. Scale bar 100 µm. E MERFISH spatial plot of T-cells and IFN-responsive glial states in the lesion area. F Centered Ripley’s L- functions showing spatial clustering of T-cells and IFN-responsive glial states in the lesion area. Shaded area shows significance envelopes at the 0.05 level (permutation test). IRM interferon-responsive microglia, IRO interferon-responsive oligodendrocytes, IRA interferon-responsive astrocytes.
Fig. 3
Fig. 3. STcEM analysis of microglia and T-cells.
A MERFISH spatial plots of microglia clusters in the lesion area. Zoomed-in plots (top right) show spatial location of individual transcripts of selected marker genes superimposed over DAPI signal. B Expert morphological annotation of microglia and T-cells based on EM, and their spatial locations in the lesion superimposed onto a summed EM image stack. Representative EM images per each category are shown, selected from a total of 1059 cells analyzed from one animal. Zoomed-in scale bar 2 µm. C Neighborhood analysis of MERFISH data (top) and EM data (bottom) showing enrichment of target cell types (x-axis) among 5 nearest neighbors of query cell type (y-axis). P-values and fold-enrichment are derived from empirical distributions obtained from 10,000 random permutations of cell labels. D Schematics of the alignment strategy of MERFISH and EM data, and assessment of spatial concordance between identified cell classes. E Heatmap of multiscale Earth Mover’s distances (EMD) between expert-derived EM classes and ST-derived clusters. Z-scored values per EM class (row scaling) as well as per ST cluster (column scaling) are shown. F Centered Ripley’s L- functions showing spatial clustering in common coordinate space between expert-derived EM classes and ST-derived clusters. Shaded area shows significance envelopes at the 0.05 level (permutation test).
Fig. 4
Fig. 4. Segmented feature-based structural analysis.
A Overview of the analysis pipeline. Subcellular structures of microglia and T-cells were segmented in the EM images of the lesion area, quantified, and analyzed by unsupervised clustering. B UMAP embedding of single-cell morphologies, colored by identified clusters. Representative EM images from each cluster are shown, selected from a total of 933 cells analyzed from one animal. Scale bar 1 µm. C UMAP plots (top) and spatial plots (bottom) colored by structural feature values. D Spatial plots of structural clusters superimposed onto the EM image stack of the lesion. E Heatmap of overlaps between expert-derived EM classes and feature-based structural clusters. One-sided Fisher exact test. Asterisks show nominal significance (*p-val < 0.1, ***p-val < 1e−5). F Heatmap of multiscale Earth Mover’s distances (EMD) between feature-based structural clusters and ST-derived clusters. Z-scored values per structural cluster (row scaling) as well as per ST cluster (column scaling) are shown.
Fig. 5
Fig. 5. Extended characterization and validation of microglial populations.
A UMAP embedding of microglial scRNA-Seq data colored by cluster (top left), experimental group (bottom left) and expression of selected markers (right). B Heatmap of average expression per microglial cluster measured by MERFISH (left) or by scRNA-Seq (right). C Pathway and Gene Ontology enrichment analysis of foamy microglia signature genes. One-sided Fisher exact test, nominal p-values. D Violin plots showing single-cell activity scores of homeostatic microglia, interferon-stimulated microglia, disease-associated microglia, and lipid-associated macrophages expression signatures collected from literature. E Boxplot of BODIPY fluorescence values of single microglia cells index-sorted from LPC-injected mice. Nominal p-values of post-hoc pairwise comparisons (two-tailed) following ANOVA, n = 560 cells obtained from 5 animals. Boxplots display the median (central line), interquartile range (IQR; box), and 1.5 * IQR (whiskers). Points beyond the whiskers represent outliers. F Rank plot of Pearson correlation coefficients between gene expression and BODIPY values in metacells. G Scatter plots of metacell gene expression vs BODIPY values for selected genes. Trendline represents generalized additive model fit, error band displays 95% confidence interval. H Network of pathways and Gene Ontology terms enriched in genes positively correlating with BODIPY. Gene Set Enrichment Analysis test, nominal p-values are shown. I Stainings of GPNMB, Galectin3 (Foamy microglia signature genes), IBA1 (microglia) and PLIN2 (lipid droplets) in LPC-injected white matter. Scale bar 10 µm. J Quantification of Galectin3 positivity in PLIN2-positive and PLIN2-negative microglia. Paired T-test (two-tailed, p-val = 4.021e−6), n = 5 animals. Data are presented as mean values +/- SEM. K Quantifications of Galectin3 and PLIN2 single and double positive Iba1+ microglia. N = 5 animals. Boxplots display the median (central line), interquartile range (IQR; box), and 1.5 * IQR (whiskers). Source data are provided as a Source Data file.
Fig. 6
Fig. 6. Correlation of gene expression and structural features in microglia.
A Schematics of the computational strategy for spatial transfer of modalities followed by gene-structure correlation analysis. Unmeasured genes in MERFISH are imputed from SmartSeq2 data. MERFISH and EM data from adjacent sections are registered to common coordinate space. Gene expression values as well as structural feature values are then transferred between neighboring cells using distance-weighted averaging. B Rank plots of Spearman correlation between genes and selected structural features (top). Barplots on the bottom show enriched Gene Ontology Cellular Component terms among the top 200 positively (shades of red) or negatively (shades of green) correlating genes with respective structural feature. One-sided hypergeometric test, nominal p-value. C Heatmaps showing correlation between selected genes and structural features in microglia (red-green palette), average values of spatially transferred modality in ST and EM clusters (red-blue palette), and average values of directly measured modality in ST and EM clusters (orange-purple palette). D Heatmap of multiscale Earth Mover’s distances (EMD) between feature-based structural clusters and ST-derived clusters. Z-scored values per structural cluster (row scaling) as well as per ST cluster (column scaling) are shown. A was created with elements from BioRender.com.

References

    1. Rao A, Barkley D, Franca GS, Yanai I. Exploring tissue architecture using spatial transcriptomics. Nature. 2021;596:211–220. doi: 10.1038/s41586-021-03634-9. - DOI - PMC - PubMed
    1. Zhang M, et al. Spatially resolved cell atlas of the mouse primary motor cortex by MERFISH. Nature. 2021;598:137–143. doi: 10.1038/s41586-021-03705-x. - DOI - PMC - PubMed
    1. Allen WE, Blosser TR, Sullivan ZA, Dulac C, Zhuang X. Molecular and spatial signatures of mouse brain aging at single-cell resolution. Cell. 2023;186:194–208 e118. doi: 10.1016/j.cell.2022.12.010. - DOI - PMC - PubMed
    1. Chen WT, et al. Spatial transcriptomics and in situ sequencing to study Alzheimer’s disease. Cell. 2020;182:976–991 e919. doi: 10.1016/j.cell.2020.06.038. - DOI - PubMed
    1. Rafelski SM, Marshall WF. Building the cell: design principles of cellular architecture. Nat. Rev. Mol. Cell Biol. 2008;9:593–602. doi: 10.1038/nrm2460. - DOI - PubMed

Publication types