. 2023 Jul 11;13(1):11195.
doi: 10.1038/s41598-023-38187-6.

Effects of dialkoxybenzenes against Varroa destructor and identification of 1-allyloxy-4-propoxybenzene as a promising acaricide candidate

Affiliations

Effects of dialkoxybenzenes against Varroa destructor and identification of 1-allyloxy-4-propoxybenzene as a promising acaricide candidate

Soniya Dawdani et al. Sci Rep. .

Abstract

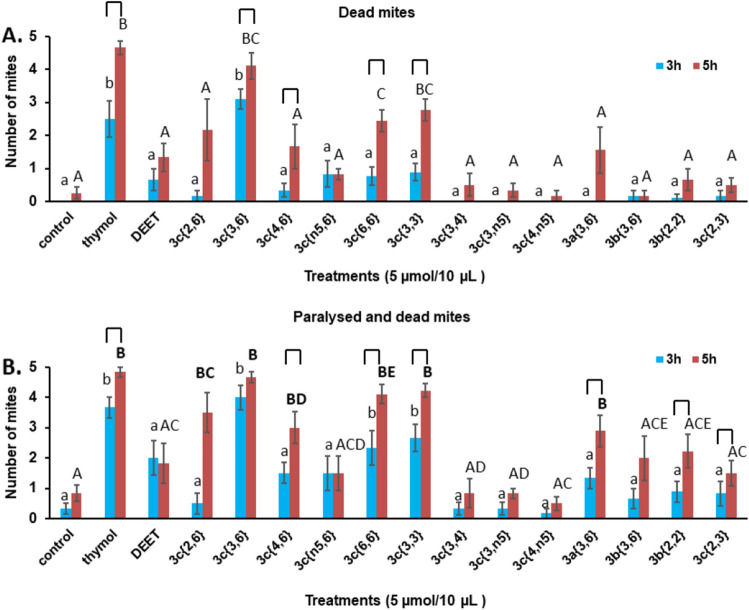
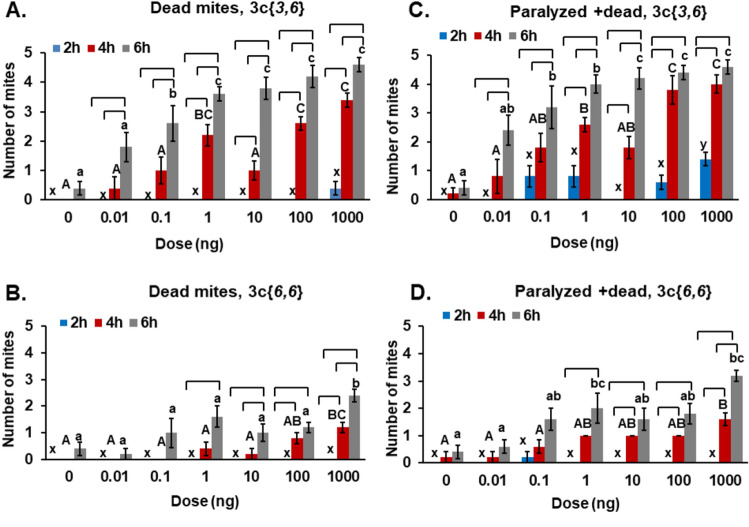
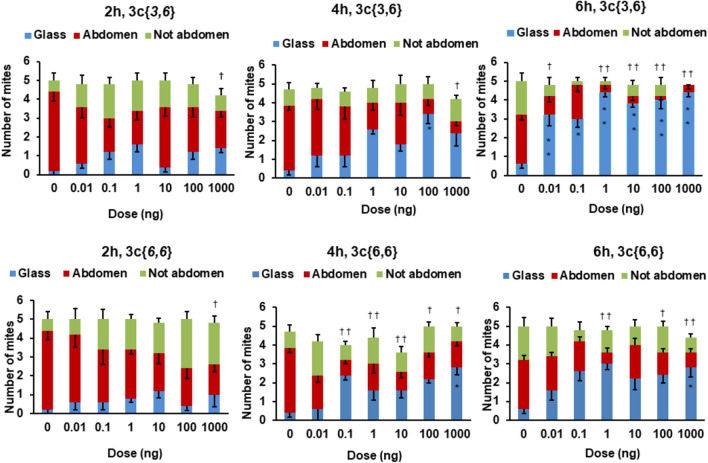
The honey bee is responsible for pollination of a large proportion of crop plants, but the health of honey bee populations has been challenged by the parasitic mite Varroa destructor. Mite infestation is the main cause of colony losses during the winter months, which causes significant economic challenges in apiculture. Treatments have been developed to control the spread of varroa. However, many of these treatments are no longer effective due to acaricide resistance. In a search of varroa-active compounds, we tested the effect of dialkoxybenzenes on the mite. A structure-activity relationship revealed that 1-allyloxy-4-propoxybenzene is most active of a series of dialkoxybenzenes tested. We found that three compounds (1-allyloxy-4-propoxybenzene, 1,4-diallyloxybenzene and 1,4-dipropoxybenzene) cause paralysis and death of adult varroa mites, whereas the previously discovered compound, 1,3-diethoxybenzene, which alters host choice of adult mites in certain conditions, did not cause paralysis. Since paralysis can be caused by inhibition of acetylcholinesterase (AChE), a ubiquitous enzyme in the nervous system of animals, we tested dialkoxybenzenes on human, honey bee and varroa AChE. These tests revealed that 1-allyloxy-4-propoxybenzene had no effects on AChE, which leads us to conclude that 1-allyloxy-4-propoxybenzene does not exert its paralytic effect on mites through AChE. In addition to paralysis, the most active compounds affected the ability of the mites to find and remain at the abdomen of host bees provided during assays. A test of 1-allyloxy-4-propoxybenzene in the field, during the autumn of 2019 in two locations, showed that this compound has promise in the treatment of varroa infestations.


Conflict of interest statement

EP has signed the technology over to SFU. Patent application by (applicants) SFU and ARO; inventors are EP and V. Soroker, application filed (PCT/CA2019/050908). Only experiments performed in 2018 were included in the patent. The remaining authors do not have any competing interests.

Figures

Figure 1
Figure 1
(A) Acetylcholinesterase-catalyzed reaction. (B) Compounds tested in the structure–activity survey.
Figure 2
Figure 2
Structure–activity relationship between the 15 compounds tested. The control received only solvent (see text). (A) Number of dead mites (out of a total of five mites/replicate), counted 3 h (blue) and 5 h (red) after start of the experiment. (B) Total number of paralyzed and dead mites counted 3 h (blue) and 5 h (red) after start of the experiment. Bars represent mean ± S.E. of 6–12 replicates. Letters: comparison between treatments in each time group—ANOVA Tukey, columns marked with different letters differ significantly P < 0.05: lower case = 3 h, upper case = 5 h. Brackets above the letters indicate a significant difference between the 3 h and 5 h measurements for that compound (P < 0.05).
Figure 3
Figure 3
Distribution of mites in the structure–activity experiment. Mites found on the glass are shown in blue, mites found on the abdomen of either bee in the dish are shown in red and mites found on either bee but not on the abdomen are shown in green. Bars represent the mean ± S. E. of 6–12 replicates. Significant differences (P < 0.05) between the number of mites on the glass for a compound compared to the control are indicated with a star (*). Significant differences (P < 0.05) between the numbers of mites on the abdomen for a compound compared to the control are indicated with a dagger (†).
Figure 4
Figure 4
Time-course of mite death, paralysis and distribution, in the presence of compound 3c{3,6} at a constant dose of 1 mg/replicate (Treatment) or no compound (Control). Each replicate had 5 mites and two fresh freeze-killed nurse bees as food in a glass Petri dish. See “Methods” for compound delivery and incubation details. Data points are average ± S. E. (10 replicates). (A) Number of dead mites vs. time. (B) Number of paralyzed mites vs. time. (C) Number of mites found on the glass. (D) Number of mites found on the abdomen of either of the bees. *P < 0.05 and **P < 0.01 (paired t-test between treatment and control at one time point).
Figure 5
Figure 5
Dose responses of 3c{3,6} and 3c{6,6}. (A) Experiments done in AB. Points represent the total number of mites paralyzed and dead after 5 h of exposure, against the dose (average ± range, N = 2). (B) Experiments done in BC. Points represent the number of mites paralyzed and dead, minus the number of mites paralyzed and dead in the paired control without compound (see “Methods”), after 3 h of exposure. Points represent the average of 2–5 replicates per dose ± S.E. (for n ≥ 3) or range (for n = 2). The dark gray curve traces the calculated dose response, based on the EC50 and the activity range obtained. The light gray, stippled curve shows the low activity model, whereas the black, dashed curve shows the high activity model within the 95% confidence limits. The EC50 values obtained are indicated above the arrows.
Figure 6
Figure 6
Direct contact assays of 3c{3,6} and 3c{6,6}. A. Number of dead mites (out of a total of five mites/replicate) treated with different doses of 3c{3,6}, counted at 2 h (blue), 4 h (red) and 6 h (grey) after start of the experiment. B. Number of dead mites (out of a total of five mites/replicate) treated with different doses of 3c{6,6}, counted at 2 h (blue), 4 h (red) and 6 h (grey) after start of the experiment. C. Total number of paralyzed and dead mites treated with different doses of 3c{3,6}, counted at 2 h (blue), 4 h (red) and 6 h (grey) after start of the experiment. D. Total number of paralyzed and dead mites when treated with different doses of 3c{3,6}, counted at 2 h (blue), 4 h (red) and 6 h (grey) after start of the experiment. A dose of 0 ng is the control treatment that received only ethanol. Bars represent mean ± S. E. of 5 replicates. Letters: comparison between each treatment dose and control at one time point- one-way ANOVA, followed by Tukey’s test, columns marked with different letters differ significantly p < 0.05: lower case xyz letters = 2 h, upper case ABC letters = 4 h and lower case abc letters = 6 h. Brackets above the letters indicate significant differences between the 2 h, 4 h and 6 h measurements for that dose—one-way ANOVA, followed by Tukey test (P < 0.05).
Figure 7
Figure 7
Distribution of mites in the direct contact assays. Mites found on the glass are shown in blue, mites found on the abdomen of either bee in the dish are shown in red and mites found on either bee but not on the abdomen are shown in green. Bars represent the mean ± S. E. of 5 replicates. Data analysed by comparing between each treatment dose for mite distribution (glass, abdomen or not abdomen) and control at one time point by one-way ANOVA, followed by Tukey’s test. Significant differences between the number of mites on the glass for a treatment dose to the control are indicated with a star (*P < 0.01; **P < 0.001). Significant differences between the numbers of mites on the abdomen for a treatment dose to the control are indicated with a dagger (P < 0.01; ††P < 0.001).
Figure 8
Figure 8
Time courses of the field trials of compound 3c{3,6}, both performed in Canada. (A) Data from the trial in the lower Fraser Valley in British Columbia. (B) Data from the trial in Beaverlodge in Alberta. Points represent the average ± S. E. of 10 replicates. Blue: control devices, Orange: treatment devices containing 5 g of 3c{3,6}. The experimental treatment lasted until the 28th day of the experiment, when the experimental devices were removed from the colonies and Apivar® strips were installed for an additional 6 weeks. A generalized least squares model was fit to the untransformed results for mite fall. Pairwise comparisons between treatment and control were performed for each experimental day when sticky boards were counted from hives (t-tests, Bonferroni adjusted; *P < 0.05; **P < 0.01; ***P < 0.001; NS not significant).

Similar articles

Cited by

References

    1. Klein A-M, et al. Importance of pollinators in changing landscapes for world crops. Proc. R. Soc. Lond. Ser. B. Biol. Sci. 2007;274:303–313. - PMC - PubMed
    1. Caldernoe NW. Insect pollinated crops, insect pollinators and US Agriculture: Trend analysis of aggregate data for the period 1992–2009. PLoS ONE. 2012;7:37235. doi: 10.1371/journal.pone.0037235. - DOI - PMC - PubMed
    1. Ratnieks FLW, Carreck NL. Clarity on honey bee collapse? Science. 2010;327:152–153. doi: 10.1126/science.1185563. - DOI - PubMed
    1. Steinhauer N, et al. Drivers of colony losses. Curr. Opin. Insect Sci. 2018;26:142–148. doi: 10.1016/j.cois.2018.02.004. - DOI - PubMed
    1. Genersch E. Honey bee pathology: Current threats to honey bees and beekeeping. Appl. Microbiol. Biotechnol. 2010;87:87–97. doi: 10.1007/s00253-010-2573-8. - DOI - PubMed

Publication types