. 2023 Jul 11;14(1):4122.
doi: 10.1038/s41467-023-39933-0.

Spatial cellular architecture predicts prognosis in glioblastoma

Affiliations

Spatial cellular architecture predicts prognosis in glioblastoma

Yuanning Zheng et al. Nat Commun. .

Abstract

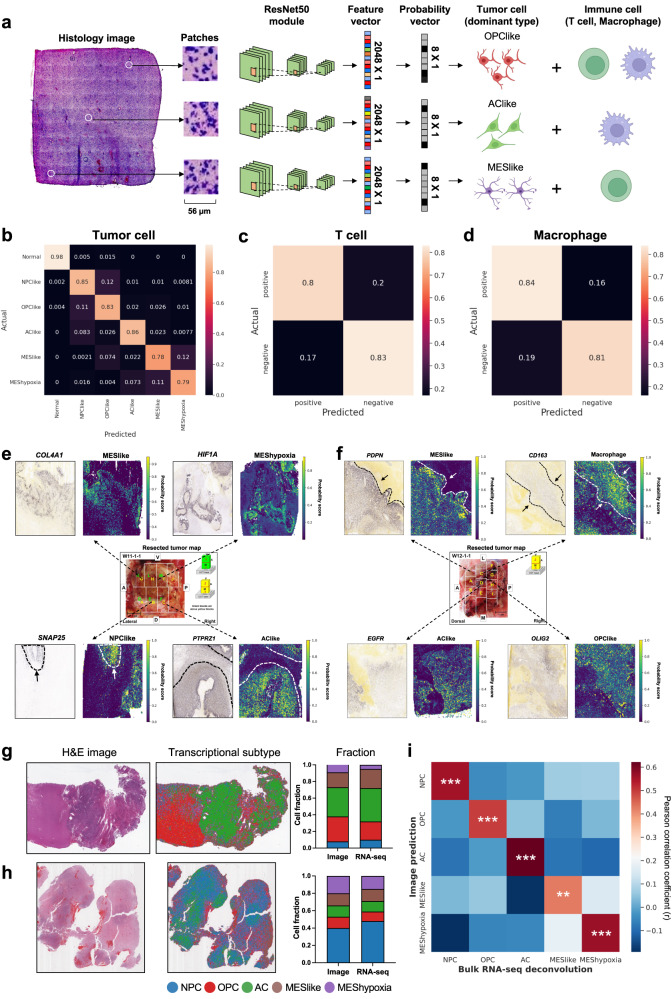
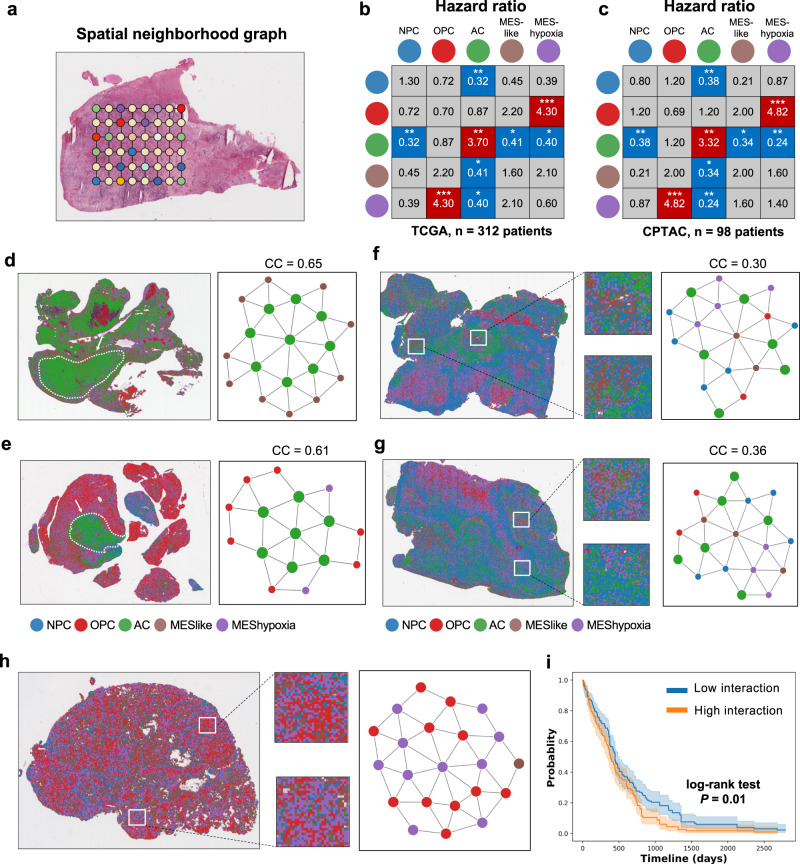
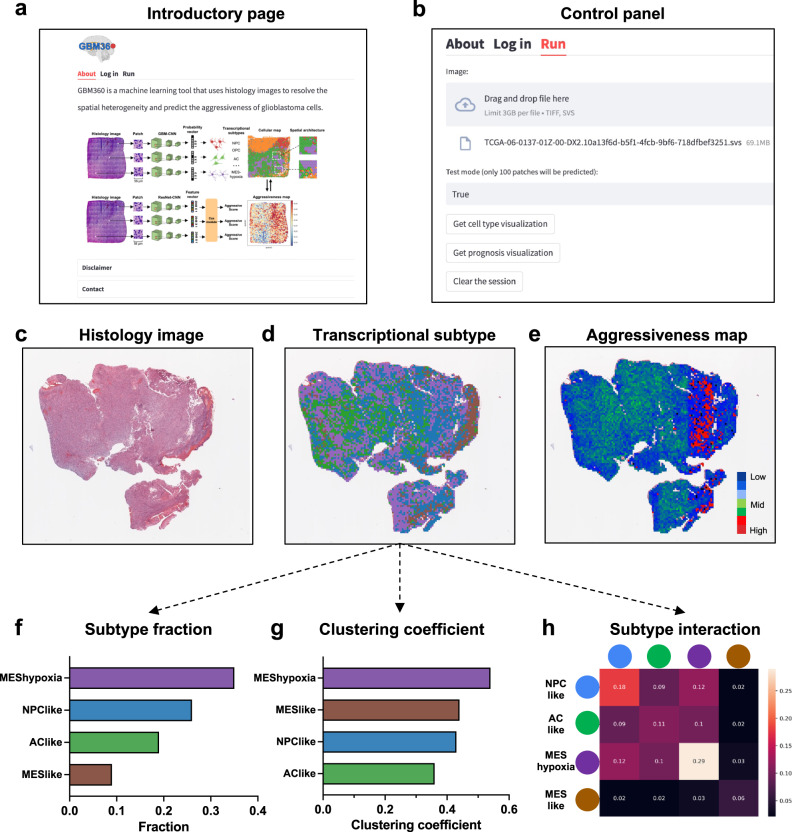
Intra-tumoral heterogeneity and cell-state plasticity are key drivers for the therapeutic resistance of glioblastoma. Here, we investigate the association between spatial cellular organization and glioblastoma prognosis. Leveraging single-cell RNA-seq and spatial transcriptomics data, we develop a deep learning model to predict transcriptional subtypes of glioblastoma cells from histology images. Employing this model, we phenotypically analyze 40 million tissue spots from 410 patients and identify consistent associations between tumor architecture and prognosis across two independent cohorts. Patients with poor prognosis exhibit higher proportions of tumor cells expressing a hypoxia-induced transcriptional program. Furthermore, a clustering pattern of astrocyte-like tumor cells is associated with worse prognosis, while dispersion and connection of the astrocytes with other transcriptional subtypes correlate with decreased risk. To validate these results, we develop a separate deep learning model that utilizes histology images to predict prognosis. Applying this model to spatial transcriptomics data reveal survival-associated regional gene expression programs. Overall, our study presents a scalable approach to unravel the transcriptional heterogeneity of glioblastoma and establishes a critical connection between spatial cellular architecture and clinical outcomes.


Conflict of interest statement

The authors declare no competing interests.

Figures

Fig. 1
Fig. 1. Identifications of spatial gene expression programs in GBM.
a Heatmaps showing the tumor cell content across different spots and corresponding CNAs across different chromosomes in a representative sample. b Heatmap showing gene expression levels of the top 60 signatures from each cNMF module. Malignant spots (n = 69, 647) from all samples (n = 23) were grouped by the expression score of each module. c, d Heatmaps showing the average correlation coefficients (n = 23 samples) from spatially weighted correlation analysis between the cNMF modules (x-axis) and published modules from (c) Ravi et al. and (d) Neftel et al. Two-sided Wald tests were used to determine statistical significance, and P values were adjusted for multiple testing using the Benjamini-Hochberg procedure. *P < 0.05, **P < 0.01, ***P < 0.001. e Stacked bar plot showing the fractions of different transcriptional subtypes in each sample. Transcriptional subtype was determined using the top-scoring cNMF module in each spot. f spatial visualization showing the distribution of transcriptional subtypes in two example tumors. Spots were colored by transcriptional subtypes as indicated in panel e. g Pipeline for computational deconvolution of spots using single-cell RNA-seq data as reference: I. UMAP visualization of the reference single-cell RNA-seq data. Each dot represents a cell colored by the subtype; II. cell count estimation of each spot based on nuclei segmentation; III. Align cell types from the reference dataset to spots. h Histogram showing the fraction of dominant tumor cell type over all tumor cells in each spot (total n = 69, 647 spots; n = 23 samples). i The number of immune cell types in each spot (total n = 69, 647 spots; n = 23 samples). j The average fraction (x-axis) of each individual cell type from the single-cell RNA-seq data in spots classified by cNMF modules (y-axis). Source data are provided as a Source Data file.
Fig. 2
Fig. 2. Development and validation of GBM-CNN for spatially resolved transcriptional subtype prediction.
a Architecture of GBM-CNN. Histology images were cropped to extract patches corresponding to each spot. Each patch was then transformed into a feature vector (2048 × 1) using a ResNet-50 module. Subsequently, each feature vector was mapped to a probability vector (8 × 1) through a fully connected layer. The cell-type cartoons were created with BioRender.com. b Confusion matrix showing the classification performance of GBM-CNN in predicting the dominant tumor cell type. Predictions from all folds (n = 23) were averaged into a single matrix. c, d Confusion matrices showing the classification performance of GBM-CNN in predicting the presence of (c) T cell and (d) macrophage. e, f Alignment of ground truth gene expression signals obtained from in situ RNA hybridization and the predicted probability scores of individual cell types in matched histological sections. Examples from two different tumors were presented. g, h H&E images and the predicted distribution of transcriptional subtypes in two tumors from the TCGA cohort. Bar graphs depict transcriptional subtype proportions derived from the image prediction versus bulk RNA-seq deconvolution. i Heatmap of Pearson correlation coefficient showing the agreement between transcriptional subtype proportions derived from our image predictions versus those estimated from bulk RNA-seq deconvolution (n = 166 patients). P values were determined using the two-sided Pearson correlation test and were adjusted by the Benjamini-Hochberg procedure. **P < 0.01, ***P < 0.001. Source data are provided as a Source Data file.
Fig. 3
Fig. 3. Associations between spatial cellular architecture and prognosis.
a Schematic representation of a spatial neighborhood graph. Each patch represents a node and connections between patches are edges. b, c Hazard ratio (HR) for frequency of transcriptional subtype interactions and prognosis using data from the (b) TCGA (n = 312 patients) and (c) CPTAC (n = 98 patients) cohorts. Statistical significance was determined using multivariate Cox regression analysis, and significant associations were highlighted by red for HR > 0 and blue for HR < 0. *P < 0.05, **P < 0.01, ***P < 0.001. d, e Representative tumor samples with high clustering coefficient (CC) of the AC-like subtype. Spots were colored by transcriptional subtypes. Abstractive networks demonstrate tumor regions characterized by clusters of AC-like spots, as indicated by white arrows. f, g Representative tumor samples with low clustering coefficient (CC) of the AC-like subtype. Spots were colored by transcriptional subtype. Abstractive networks highlighted the interactions between the AC-like subtype and other subtypes, such as NPC-like, MES-like and MES-hypoxia. h Representative tumor sample with a high frequency of interaction between the OPC-like and MES-hypoxia subtype. i Kaplan-Meier survival curves of TCGA patients with high (n = 156) and low (n = 156) interactions between the OPC-like and MES-hypoxia subtypes. Error bands represent confidence intervals for the estimated survival probabilities, and the survival curves are compared with the log-rank test (P = 0.01). Source data are provided as a Source Data file.
Fig. 4
Fig. 4. In situ identifications of gene expression markers associated with prognosis.
a A deep-learning model was trained on whole slide images from the TCGA cohort to predict patient prognosis. H&E-stained histology images were cropped into 56μm × 56μm patches. Each patch was converted to a feature vector (2048 × 1) using a ResNet-50 module. The feature vectors were then mapped to an aggressive score through a Cox regression module. The aggressive scores of each patient were averaged for validation. b Using the trained image model from panel (a) to predict aggressive scores for spots in spatial transcriptomics. c, d Visualization of transcriptional subtypes and the predicted aggressive scores in two tumors from the spatial transcriptomics cohort. Aggressive scores were normalized within each sample using min-max normalization. e Bar plot of median aggressive scores for malignant spots. Aggressive scores from all tumors (n = 23) were pooled together and normalized using min-max normalization. f Violin plot of mRNA expression levels for genes upregulated in tumor regions assigned with high aggressive scores (blue) versus those with low scores (yellow). The top 10,000 spots from each group were shown. Boxes within the violins represent the interquartile range (Q1-Q3) of the combined groups, and circles inside the box represent median values. g, h Top enriched biological processes in tumor regions with (g) high and (h) low aggressiveness. Sizes of the circles represent the number of genes in each biological process, and colors represent P values of enrichment. P values were determined using the hypergeometric test and adjusted by the Benjamini-Hochberg procedure. Source data are provided as a Source Data file.
Fig. 5
Fig. 5. Screenshots of the GBM360 software.
a Introductory page describing the functions of GBM360. The cell-type cartoons were created with BioRender.com. b Control panel for uploading histology images and configuring software settings. c Thumbnail of a histology image uploaded from the user. d Predictions and spatial visualization of the cell-type distribution. The image was colored by transcriptional subtypes. e Predictions and visualization of regional aggressive scores. The image was colored by the aggressive score predicted at each patch. Red indicates high aggressiveness and blue indicates low aggressiveness. fh Statistical analysis of the transcriptional subtype distribution: (f) bar graph showing the transcriptional subtype fractions, (g) clustering coefficient for each subtype, and (h) two-dimensional matrix showing the frequency of interactions between any two transcriptional subtypes.

References

    1. Ostrom QT, et al. CBTRUS statistical report: Primary brain and other central nervous system tumors diagnosed in the United States in 2012-2016. Neuro. Oncol. 2019;21:v1–v100. doi: 10.1093/neuonc/noz150. - DOI - PMC - PubMed
    1. Stupp R, et al. Radiotherapy plus concomitant and adjuvant temozolomide for glioblastoma. N. Engl. J. Med. 2005;352:987–996. doi: 10.1056/NEJMoa043330. - DOI - PubMed
    1. Larsson I, et al. Modeling glioblastoma heterogeneity as a dynamic network of cell states. Mol. Syst. Biol. 2021;17:e10105. doi: 10.15252/msb.202010105. - DOI - PMC - PubMed
    1. Yabo YA, Niclou SP, Golebiewska A. Cancer cell heterogeneity and plasticity: A paradigm shift in glioblastoma. Neuro. Oncol. 2022;24:669–682. doi: 10.1093/neuonc/noab269. - DOI - PMC - PubMed
    1. Neftel C, et al. An Integrative Model of Cellular States, Plasticity, and Genetics for Glioblastoma. Cell. 2019;178:835–849.e21. doi: 10.1016/j.cell.2019.06.024. - DOI - PMC - PubMed

Publication types