. 2023 Jul 11;6(1):712.
doi: 10.1038/s42003-023-05067-8.

Architectural basis for cylindrical self-assembly governing Plk4-mediated centriole duplication in human cells

Affiliations

Architectural basis for cylindrical self-assembly governing Plk4-mediated centriole duplication in human cells

Jong Il Ahn et al. Commun Biol. .

Erratum in

Abstract

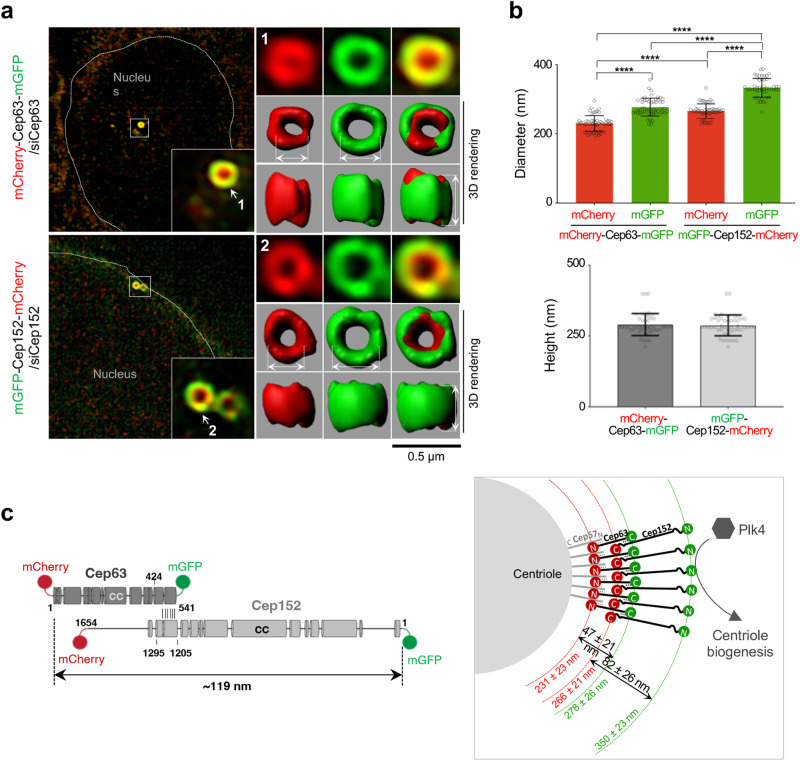
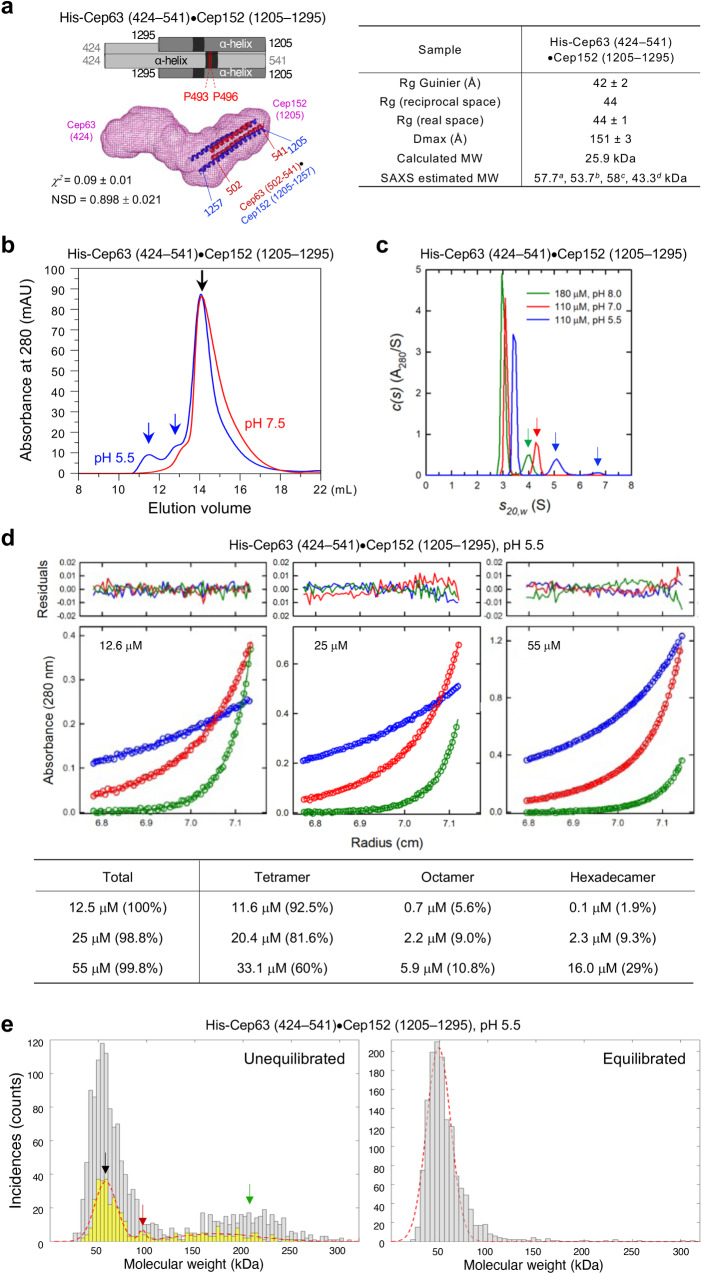
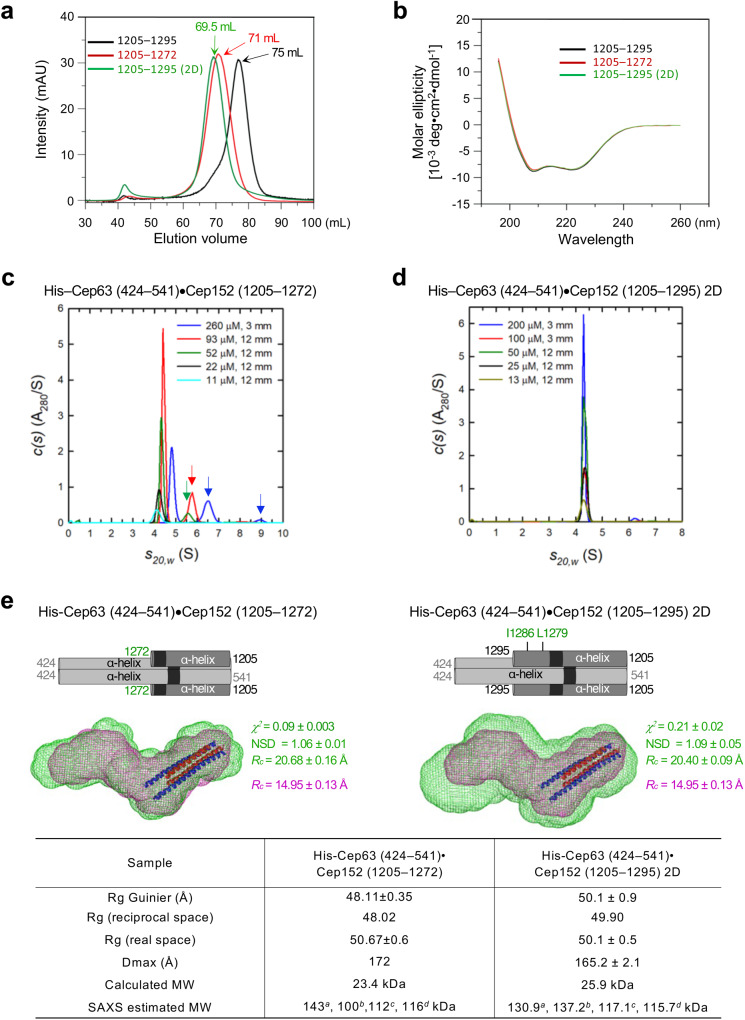
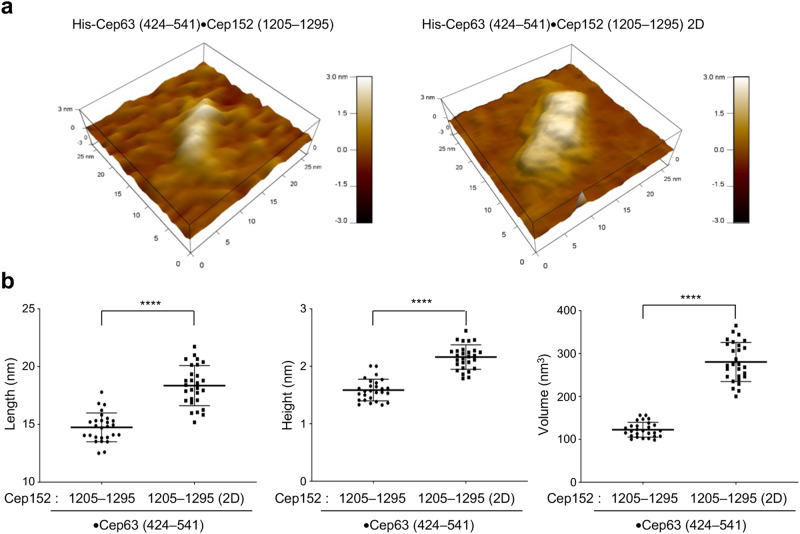
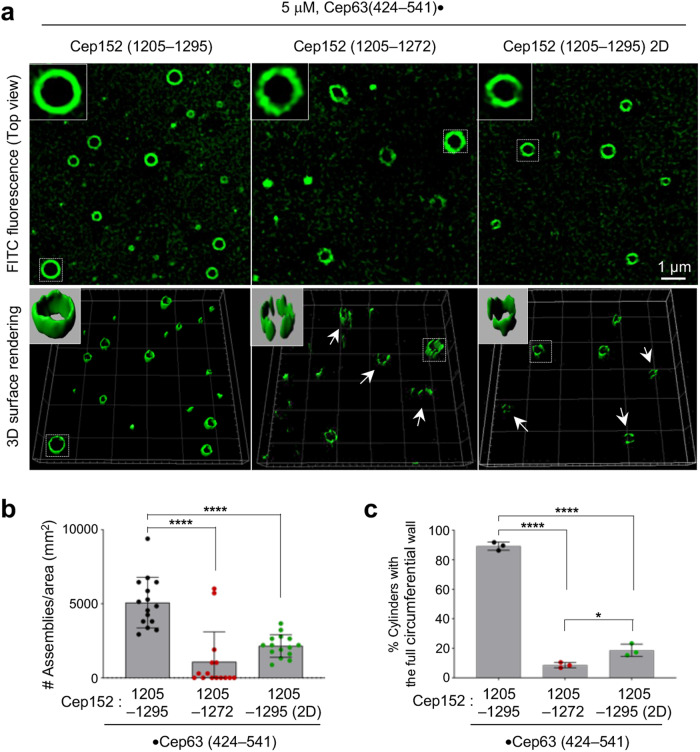
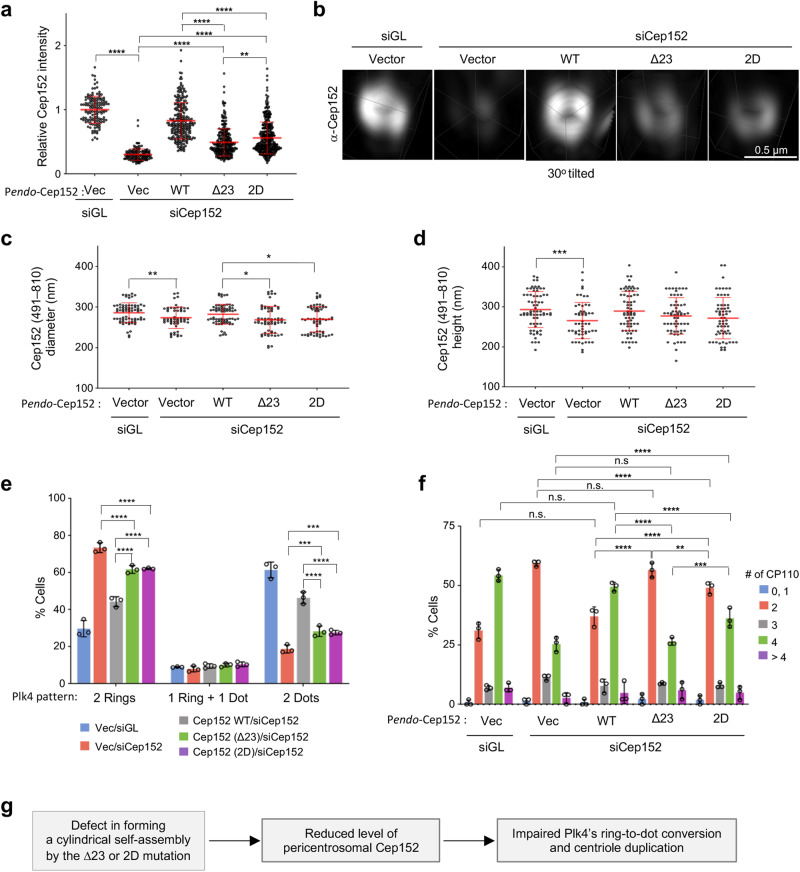
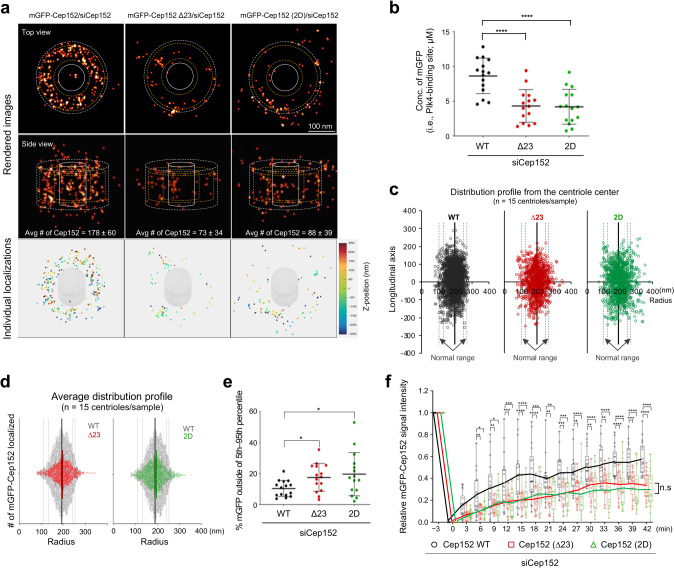
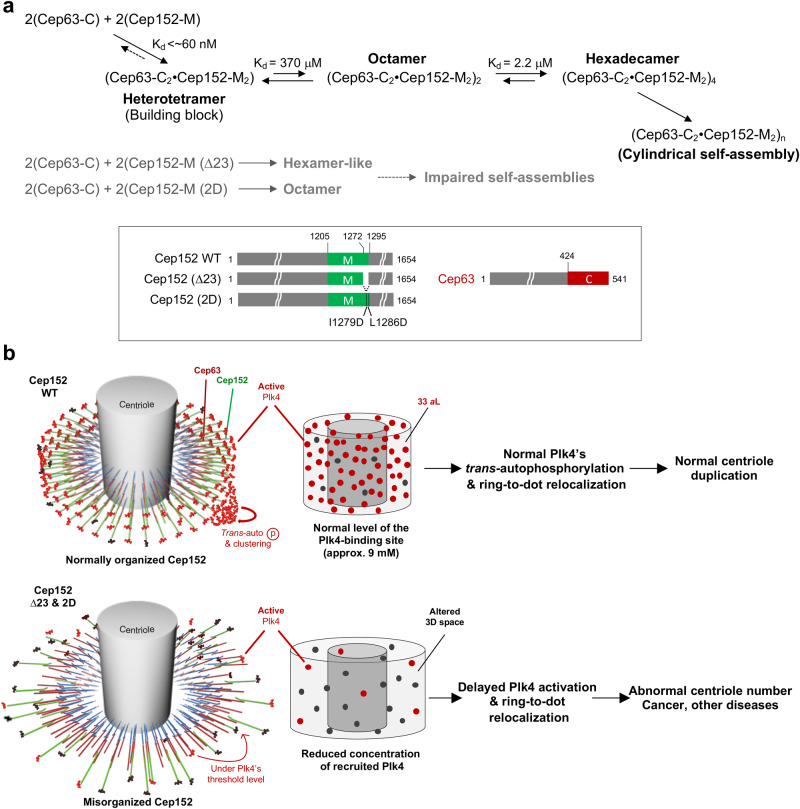
Proper organization of intracellular assemblies is fundamental for efficient promotion of biochemical processes and optimal assembly functionality. Although advances in imaging technologies have shed light on how the centrosome is organized, how its constituent proteins are coherently architected to elicit downstream events remains poorly understood. Using multidisciplinary approaches, we showed that two long coiled-coil proteins, Cep63 and Cep152, form a heterotetrameric building block that undergoes a stepwise formation into higher molecular weight complexes, ultimately generating a cylindrical architecture around a centriole. Mutants defective in Cep63•Cep152 heterotetramer formation displayed crippled pericentriolar Cep152 organization, polo-like kinase 4 (Plk4) relocalization to the procentriole assembly site, and Plk4-mediated centriole duplication. Given that the organization of pericentriolar materials (PCM) is evolutionarily conserved, this work could serve as a model for investigating the structure and function of PCM in other species, while offering a new direction in probing the organizational defects of PCM-related human diseases.


Conflict of interest statement

The authors declare no competing interests.

Figures

Fig. 1
Fig. 1. The organization of Cep63 and Cep152 at the interphase PCM.
a, b 3D-SIM analyses for U2OS cells stably expressing the indicated Cep63 or Cep152 constructs after depleting respective endogenous Cep63 or Cep152 by RNAi. a Representative images displaying the PCM-localized mCherry-Cep63-mGFP or mGFP-Cep152-mCherry signals are shown with two surface-rendered models (top and side views). Original fluorescence images are provided in Supplementary Fig. 1a, b. Boxes, areas of enlargement; double arrows, the diameters and heights measured for quantification. b Quantification of the mCherry and mGFP fluorescent signals in (a) to determine the peak-to-peak diameters (top) and heights (bottom) for the cylindrically localized mCherry-Cep63-mGFP (total n = 53 and n = 48, respectively) and mGFP-Cep152-mCherry (total n = 49 and n = 48, respectively) obtained from three independent experiments. Error bars, mean of n ± s.d. *P < 0.05, ****P < 0.0001 (unpaired two-tailed t test). Detailed methods employed for quantification are described in Supplementary Fig. 1c, d. c (left) A schematic showing the structures of Cep63 and Cep152 with various lengths of CCs (round bars) predicted by the COILS server. c (right) The organization of Cep63 and Cep152 around a centriole, illustrated based on prior observations,,,,,. Numbers (red and green) indicate the diameters from (b).
Fig. 2
Fig. 2. A SAXS-derived ab initio envelope for the heterotetrameric Cep63 (424–541)•Cep152 (1205–1295) complex and the cooperative formation of its hexadecameric form.
a A schematic and the SAXS envelope for the heterotetrameric Cep63 (424–541)•Cep152 (1205–1295) complex are shown with the embedded crystal structure of Cep63 (502–541)•Cep152 (1205–1250) (PDB: 6CSU; red and blue helices). Averaged χ2 (the difference between actual and expected data) and normalized spatial discrepancy (NSD) values calculated from 32 independent DAMMIN reconstructions and Rc (cross-sectional radius) calculated from low q Guinier fit are shown. Various physical parameters of the complex calculated from its respective SAXS curve are provided (table, right). a,b,c,d, MWs determined from the SAXS data using four different methods (see Methods for details). Raw data are provided in Supplementary Fig. 2a, b. A 3D-rendered envelope is provided as Supplementary Movie 1. b SEC of Cep63 (424–541)•Cep152 (1205–1295) performed at the indicated pH. Black arrow, the heterotetrameric complex; blue arrows, higher-MW complexes. c Sedimentation velocity c(s) profiles for the Cep63 (424–541)•Cep152 (1205–1295) complex under the indicated conditions. Colored arrows, faster-sedimenting, higher-MW species detected under the respective concentrations. Samples were analyzed in 3 mm pathlength cells. d Sedimentation equilibrium absorbance data collected for the same complex in (c) at 7,000 (blue), 11,000 (red), and 20,000 (green) rpm at the loading concentrations indicated. Data collected at pH 5.5 were analyzed globally in terms of a tetramer–octamer–hexadecamer reversible self-association model. For clarity, only every third experimental data point is shown. Best fits are represented by a solid line through the experimental points, and the combined residuals are shown above the plots. The table (bottom) shows concentrations for the tetramer, octamer, and hexadecamer (in tetramer units) calculated based on the best-fit reversible self-association model. e Histograms showing the particle distribution of the same complex in (c) as a function of molecular weight. The y-axis (Incidence) denotes the number of particles. The yellow histogram with the red dotted line was generated by reanalyzing the data after discarding a third of the particles, as described previously.
Fig. 3
Fig. 3. Mutations in a conserved basic CC motif of Cep152 prevent the formation of the heterotetrameric Cep63•Cep152 building block.
a, b SEC elution and circular dichroism profiles of the Cep63 (424–541)•Cep152 (1205–1295), Cep63 (424–541)•Cep152 (1205–1272) truncation, and Cep63 (424–541)•Cep152 (1205–1295) 2D complexes. c, d Sedimentation velocity c(s) profiles for Cep63 (424–541)•Cep152 (1205–1272) (c) and Cep63 (424–541)•Cep152 (1205–1295) 2D (d) mutants at various loading concentrations. Samples were analyzed in 3 or 12 mm pathlength cells as indicated. Arrows in (c), higher-MW complexes and/or aggregates observed at high concentrations. e Schematics and the ab-initio-reconstructed envelopes of the Cep63 (424–541)•Cep152 (1205–1272) truncation (left, green) and the Cep63 (424–541)•Cep152 (1205–1295) 2D mutants (right, green). The envelope of the Cep63 (424–541)•Cep152 (1205–1295) complex (magenta) and the crystal structure (PDB: 6CSU; red and blue helices) of the Cep63 (502–541)•Cep152 (1205–1250) heterotetramer docked in position are overlaid for morphological comparisons. Averaged χ2 and NSD values calculated from 32 independent DAMMIN reconstructions, along with the Rc calculated from the SAXS data, are shown. Calculated physical parameters from the respective SAXS data of the complexes are given (table). a,b,c,d, MWs calculated from the SAXS data using four different methods (see Methods for details). Note that due to the aggregative nature of the Cep63 (424–541)•Cep152 (1205–1272) truncation mutant, the SAXS-estimated MWs are somewhat overestimated. 3D-rendered envelopes are provided as Supplementary Movie 1.
Fig. 4
Fig. 4. Topography of the Cep63•Cep152 complex detected by AFM.
a Surface topographic rendering of the His-Cep63 (424–541)•Cep152 (1205–1295) (left) and His-Cep63 (424–541)•Cep152 (1205–1295) 2D (right) complexes on APS-mica surface. b Quantification of the dimension of the two complexes in (a) from two independent experiments [for His-Cep63 (424–541)•Cep152 (1205–1295): average length = 14.74 ± 1.25 nm and average height = 1.58 ± 0.18 nm (average volume = 123.32 ± 17.47 nm3); for His-Cep63 (424–541)•Cep152 (1205–1295) 2D: average length = 18.35 ± 1.73 nm and average height = 2.16 ± 0.21 nm (average volume = 280.01 ± 45.38 nm3]. Bars, mean of n ± s.d. ****P < 0.0001 (unpaired two-tailed t test). Note that the lateral dimensions of the particles are tip-broadened, while their height is a precise value. Examples of unprocessed “raw” images are provided in Supplementary Fig. 4.
Fig. 5
Fig. 5. 3D-SIM (top) and surface rendering (bottom) showing the in vitro self-assemblies generated by the indicated Cep63•Cep152 complex.
a Cylindrical self-assemblies were generated by placing 10 µL of Cep63 (424–541)•Cep152 (1205–1295) (left), Cep63 (424–541)•Cep152 (1205–1272) lacking the 23 basic CC residues (∆23) (middle), and Cep63 (424–541)•Cep152 (1205–1295) (2D) (right) (5 µM) on a poly-l-lysine-coated coverslip. The assemblies on the coverslip were reacted with FITC, washed, and subjected to 3D-SIM as described in the Methods. Boxes, areas of enlargement; arrows, incomplete cylindrical assemblies. b The total number of cylindrical self-assemblies present in the surface area of 1 mm2 was estimated from 15 randomly chosen fields (6813 µm2/field) obtained from three independent experiments (n = 5 fields/sample/experiment). ****P < 0.0001 (unpaired two-tailed t test). Bars, mean of n ± s.d. c The percentage of cylindrical assemblies with a complete circumferential wall quantified from (b). *P < 0.05, ****P < 0.0001 (unpaired two-tailed t test). Bars, mean of three expriments ± s.d.
Fig. 6
Fig. 6. The conserved basic CC motif of Cep152 is required for proper centriole duplication.
af U2OS cells stably expressing endogenous promoter (Pendo)-controlled siCep152-insensitive constructs (shown in Supplementary Fig. 6a) were analyzed after depleting endogenous Cep152. a Confocal microscopy analyses for anti-Cep152-immunostained cells obtained from three independent experiments [per experiment, n ≥ 42 for Vec/siGL (total n = 140); n ≥ 50 for Vec/siCep152 (total n = 150); n ≥ 81 for Cep152/siCep152 (total n = 256); n ≥ 86 for Cep152 (∆23)/siCep152 (total n = 273), n ≥ 108 for Cep152 (2D)/siCep152 (total n = 328)]. bf 3D-SIM analyses for immunostained pericentriolar Cep152, Plk4, and CP110 signals. b Representative images showing the localization patterns of Cep152 WT and its respective mutant forms. Cep152’s diameters (c) and heights (d) were determined from the same images obtained from two independent experiments [per experiment, n ≥ 33 for Vec/siGL (total n = 70); n ≥ 27 for Vec/siCep152 (total n = 55); n ≥ 30 for Cep152/siCep152 (total n = 68); n ≥ 31 for Cep152 (Δ23)/siCep152 (total n = 63), n ≥ 30 for Cep152 (2D)/siCep152 (total n = 63)]. Plk4’s ring versus dot state (e) was quantified from three independent experiments [per experiment, n ≥ 76 for Vec/siGL (total n = 258); n ≥ 66 for Vec/siCep152 (total n = 215); n ≥ 65 for Cep152/siCep152 (total n = 234); n ≥ 67 for Cep152 (Δ23)/siCep152 (total n = 244), n ≥ 71 for Cep152 (2D)/siCep152 (total n = 235)]. CP110 dot numbers (f) were quantified from three independent experiments [per experiment, n ≥ 44 for Vec/siGL (total n = 144); n ≥ 50 for Vec/siCep152 (total n = 150); n ≥ 40 for Cep152/siCep152 (total n = 129); n ≥ 43 for Cep152 (Δ23)/siCep152 (total n = 136), n ≥ 54 for Cep152 (2D)/siCep152 (total n = 163)]. Bars for (a, c, d), mean of n ± s.d. Bars for (e, f), mean of three experiments ± s.d. *P < 0.05, **P < 0.01, ***P < 0.001, ****P < 0.0001, n.s., not significant (unpaired two-tailed t test). g A summary proposing that a defect in the formation of the Cep63•Cep152 self-assembly (as demonstrated in Fig. 6) results in a reduced level of pericentriolar Cep152 that leads to improper Plk4’s ring-to-dot conversion and Plk4-mediated centriole duplication.
Fig. 7
Fig. 7. Mutations in the conserved CC motif of Cep152 result in misorganizing pericentriolar Cep152.
ae 3D MINFLUX data for U2OS cells expressing the indicated RNAi-insensitive mGFP-Cep152 constructs (WT, ∆23, and 2D) and depleted of endogenous Cep152 by RNAi. Raw fluorescence signals acquired with an anti-GFP nanobody fused to a single Alexa Fluor 647 (i.e., one fluorophore per nanobody) were filtered and processed as shown in Supplementary Fig. 7b, c (see also Methods). Representative images in (a) are shown with dotted boundaries [the maximum (excluding outliers; white dotted line) and the 5th95th percentiles of the entire minimummaximum values (yellow dotted lines) of Cep152 WT (see Supplementary Fig. 7d, e)] for easy comparison. Numbers, the radial width and height of the mGFP-Cep152 WT. Concentrations of mGFP-Cep152 in (b) were calculated from Supplementary Fig. 7e. Rendered 3D images (top, generated by binning localizations into 0.5 × 0.5 × 0.5 nm voxels, also see Methods), and all localizations plotted in 3D (bottom; respective movies in Supplementary Movie 3) are provided. To reveal mislocalized mGFP-Cep152 signals (ce), the entire minmax range data points shown in Supplementary Fig. 7e were plotted for WT, ∆23, and 2D (c, d), and the population outside of the 5th95th percentiles of the WT radius was determined (e). Note in (d) that, unlike Cep152 WT (gray dots), both ∆23 an 2D mutants are spread out over a larger area, yielding a greater mislocalized population. All quantifications in (ae), n = 15 centriole images for each group obtained from three independent experiments. Bars in (b, e), mean of n ± s.d. *P < 0.05, ****P < 0.0001 (unpaired two-tailed t test). Vertical lines in (c, d), median with 5th95th (thin red lines) and 1st99th percentiles (thin blue lines). f FRAP analysis for the mGFP-Cep152-mCherry fluorescence localized around a centriole. Images were acquired for 42 minutes at 3-minute intervals. Representative confocal images acquired before and after photobleaching are shown in Supplementary Fig. 7g. Relative signal intensities were quantified from three independent experiments [n = 18 for Cep152/siCep152 (n = 6/experiment); n = 17 for Cep152 (Δ23)/siCep152 (n ≥ 5/experiment); n = 18 for Cep152 (2D)/siCep152 (n = 6/experiment)]. Bars, mean of n ± s.d. *P < 0.05, **P < 0.01, ***P < 0.001, ****P < 0.0001 (unpaired two-tailed t test). n.s., not significant.
Fig. 8
Fig. 8. Schematics illustrating the stepwise self-assembly processes and the effect of misorganizing the Cep63•Cep152 platform on the Plk4-mediated centriole duplication, the abnormalities of which could lead to the development of various human diseases, including cancer.
a In a concentration-dependent manner, the Cep63 (424–541)•Cep152 (1205–1295) heterotetramer generates octameric and hexadecameric complexes, leading to the formation of a cylindrical self-assembly. iSCAMS was used to determine the Kd value for forming the heterotetrameric building block, while the Kd values for tetramer–octamer and octamer–hexadecamer equilibria were determined from sedimentation equilibrium analyses (Fig. 2d). Formation of the heterotetrameric building block is presumably almost irreversible (dotted arrow), hardly dissociating its components under various conditions. Cylindrical self-assemblies are very stable. The two Cep152 mutants either lacking the (1205–1295) region (∆23) or containing the I1279D, L1286D mutations (2D) fail to form the heterotetrameric building block and a higher-order self-assembly. b Cep152 WT, which localizes within a defined region of the PCM space, properly recruits and promotes Plk4-dependent centriole duplication and cell proliferation. In contrast, its respective ∆23 and 2D mutants misorganize their pericentriolar platform, displaying a broader distribution and lower density of the Plk4-binding Cep152 N-terminus (see text for details). Consequently, these mutants fail to properly promote Plk4’s ring-to-dot conversion and centriole duplication. This defect could ultimately lead to various human disorders.

Similar articles

Cited by

References

    1. Conduit PT, Wainman A, Raff JW. Centrosome function and assembly in animal cells. Nat. Rev. Mol. Cell Biol. 2015;16:611–624. - PubMed
    1. Vertii A, Hehnly H, Doxsey S. The centrosome, a multitalented renaissance organelle. Cold Spring Harb. Perspect. Biol. 2016;8:a025049. - PMC - PubMed
    1. Bauer M, Cubizolles F, Schmidt A, Nigg EA. Quantitative analysis of human centrosome architecture by targeted proteomics and fluorescence imaging. EMBO J. 2016;35:2152–2166. - PMC - PubMed
    1. Lawo S, Hasegan M, Gupta GD, Pelletier L. Subdiffraction imaging of centrosomes reveals higher-order organizational features of pericentriolar material. Nat. Cell Biol. 2012;14:1148–1158. - PubMed
    1. Mennella VK, et al. Subdiffraction-resolution fluorescence microscopy reveals a domain of the centrosome critical for pericentriolar material organization. Nat. Cell Biol. 2012;14:1159–1168. - PMC - PubMed

Publication types

Substances