. 2023 Jul 11;6(1):708.
doi: 10.1038/s42003-023-05059-8.

ResR/McdR-regulated protein translation machinery contributes to drug resilience in Mycobacterium tuberculosis

Affiliations

ResR/McdR-regulated protein translation machinery contributes to drug resilience in Mycobacterium tuberculosis

Pramila Pal et al. Commun Biol. .

Abstract

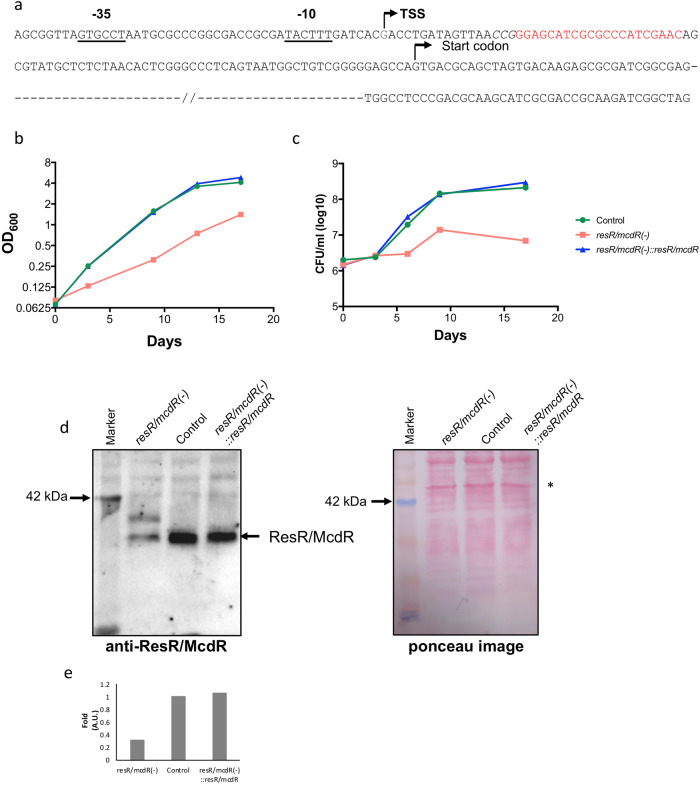
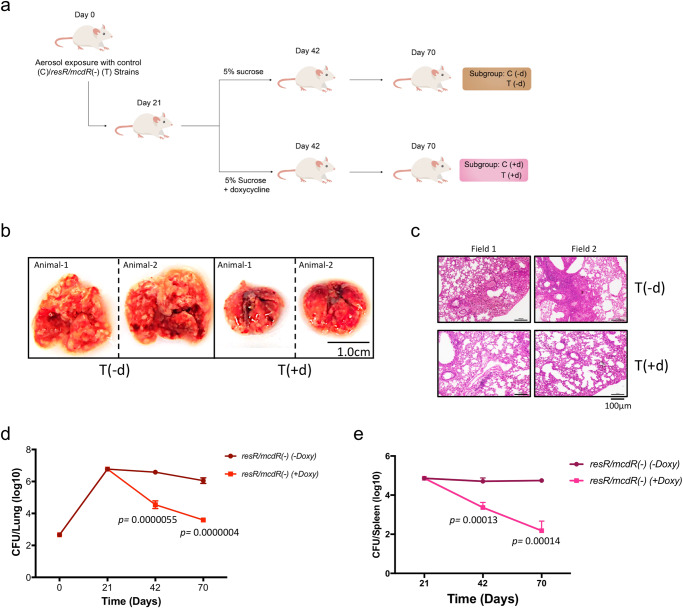
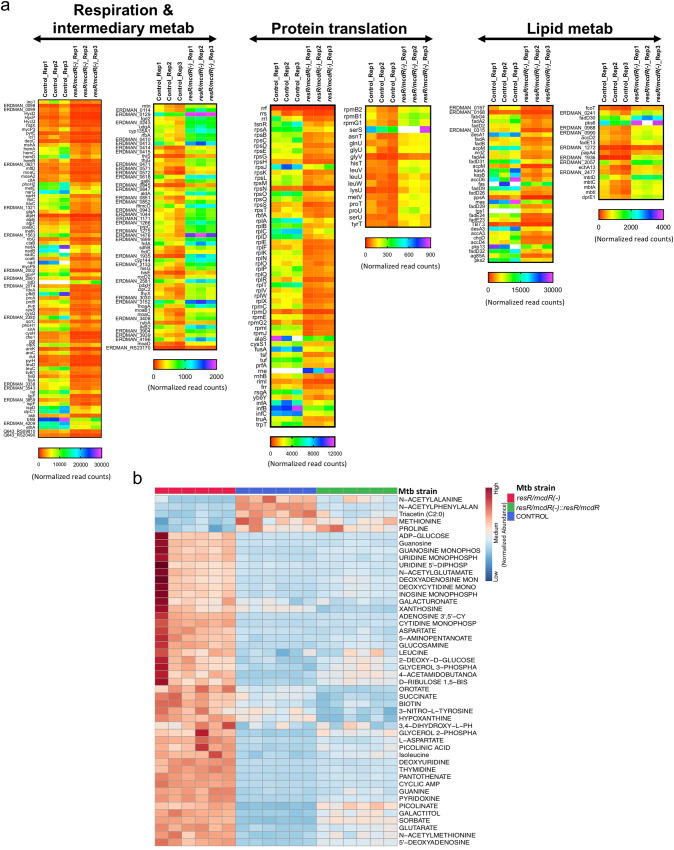
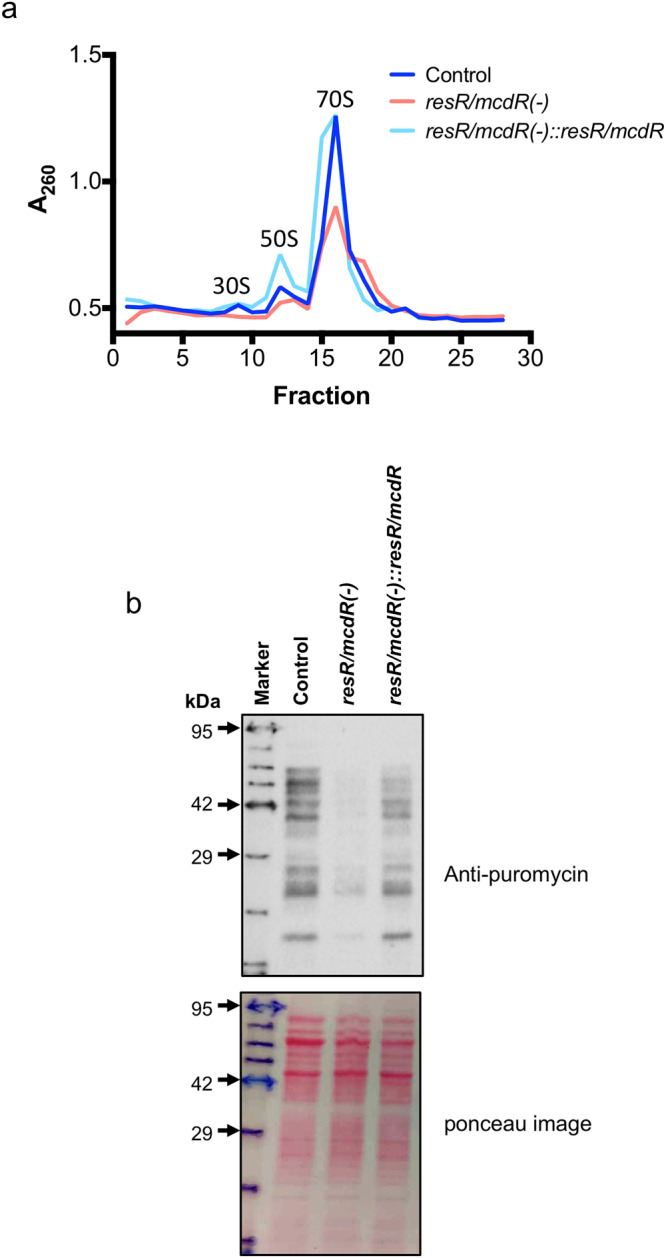
Survival response of the human tuberculosis pathogen, Mycobacterium tuberculosis (Mtb) to a diverse environmental cues is governed through its versatile transcription regulatory mechanisms with the help of a large pool of transcription regulators (TRs). Rv1830 is one such conserved TR, which remains uncharacterized in Mtb. It was named as McdR based on an effect on cell division upon its overexpression in Mycobacterium smegmatis. Recently, it has been implicated in antibiotic resilience in Mtb and reannotated as ResR. While Rv1830 affects cell division by modulating the expression of M. smegmatis whiB2, the underlying cause of its essentiality and regulation of drug resilience in Mtb is yet to be deciphered. Here we show that ResR/McdR, encoded by ERDMAN_2020 in virulent Mtb Erdman, is pivotal for bacterial proliferation and crucial metabolic activities. Importantly, ResR/McdR directly regulates ribosomal gene expression and protein synthesis, requiring distinct disordered N-terminal sequence. Compared to control, bacteria depleted with resR/mcdR exhibit delayed recovery post-antibiotic treatment. A similar effect upon knockdown of rplN operon genes further implicates ResR/McdR-regulated protein translation machinery in attributing drug resilience in Mtb. Overall, findings from this study suggest that chemical inhibitors of ResR/McdR may be proven effective as adjunctive therapy for shortening the duration of TB treatment.


Conflict of interest statement

The authors declare no competing interests.

Figures

Fig. 1
Fig. 1. resR/mcdR is essential for in vitro growth of Mtb.
a Analysis of the resR/mcdR promoter sequence. Transcription start site (TSS) and SigA-recognition sequences at the −10 and −35 positions in the 5’-UTR of resR/mcdR, as identified by 5’-RACE, are underlined. Sequence in italics represents the complementary sequence of protospacer adjacent motif (PAM) in the non-template strand, and the gRNA-hybridization sequence is marked red. b, c Effect of resR/mcdR depletion on in vitro growth of Mtb. In vitro growth of control, mutant (resR/mcdR(−)) and the complemented (resR/mcdR(−)::resR/mcdR) strains of Mtb was analyzed after treatment with 50 ng/ml ATc by estimating OD600 (b) and by CFU plating (c) at successive time points. d Analysis of ResR/McdR expression by immunoblotting. Shown is the anti-ResR/McdR immunoblot of whole cell lysates from the resR/mcdR(−), control, and resR/mcdR(−)::resR/mcdR strains of Mtb. Equal loading of samples is confirmed by Ponceau staining of the membrane before probing with the anti-ResR/McdR antibodies. e Analysis of ResR/McdR signal intensity. Signal intensities were analyzed by densitometric scanning of the anti-ResR/McdR blot in d using ImageJ software after normalization with the intensity of a 50 kDa band in the respective lanes in the ponceau-stained blot (marked by an asterisk in d). Data represent mean values from multiple (n = 3) measurements in b and multiple (n = 2) biological repeat experiments in c.
Fig. 2
Fig. 2. resR/mcdR is critical for the intracellular proliferation of Mtb.
a Schematic of mouse infection. Mice were infected by aerosol route with the control (depicted as ‘C’) and the resR/mcdR(−) (depicted as ‘T’) strains of Mtb Erdman. After 21 days of infection, mice were divided into two groups: one group of mice receiving only 5% sucrose (-d) and others receiving doxycycline in 5% sucrose (+d). Intracellular bacterial load was determined by CFU plating of lungs and spleen homogenates at the indicated time points. b Gross pathology of lungs. Shown are the images of lungs obtained from T(-d) and T(+d) groups of mice after 49 days of treatment (i.e., day 70 post-infection). Scale bar is shown for size reference. c Histopathology of lungs from Mtb-infected mice. Histopathology was performed by H&E staining of a section of lungs from the T(-d) and the T(+d) group of mice after 49 days of treatment (i.e., day 70 post-infection). Representative low-magnification micrographs of sections of lungs from both groups are shown for comparison. Scale bar is shown for size reference. d, e Effect of doxycycline treatment on intracellular survival of resR/mcdR(−) strain of Mtb. Intracellular survival of the resR/mcdR(−) mutant strain was determined by estimating the bacterial load in lungs (d) and spleen (e) at the respective time points by CFU enumeration. Data represent mean ± s.d. (shown by error bars) values from multiple (n = 4) animals in de. p values in d, e were obtained at the indicated time points after comparison with day 21, as described in Methods.
Fig. 3
Fig. 3. Effect of resR/mcdR depletion on the whole genome transcriptional profile of Mtb.
a Schematic of the strategy used for whole genome transcriptional profiling of Mtb. Briefly, bacterial cultures of the empty vector control and resR/mcdR(−) (KD) strains were treated with 50 ng/ml ATc for four days, followed by extraction of RNA. After verification of resR/mcdR silencing in the KD by qRT-PCR, samples were processed for RNA sequencing as described in the text. b Volcano plot of differentially expressed genes in resR/mcdR(−). Shown is the distribution of differentially expressed genes via log2 (fold-change) and >1.3 −log p values. Broken vertical lines represent the cutoff of ≥1 log2 fold-change. Genes undergoing downregulation are represented by red dots, and those showing upregulation in resR/mcdR(−) are marked with blue dots. The status of resR/mcdR expression is highlighted by an arrow. Data represent fold change in read counts between resR/mcdR(−) and control strains from three biological replicates. c Functional categorization of differentially expressed genes. Shown is the butterfly chart for the distribution pattern of genes that are perturbed in resR/mcdR(−) according to their function. Different functional categories are defined according to classification by the Mycobrowser database (https://mycobrowser.epfl.ch/genes/). d, e Status of differentially accumulated transcripts. Heat maps represent transcripts showing accumulation (d) or suppression (e) upon resR/mcdR silencing. f Validation of RNAseq data. RNAseq data were verified by qRT-PCR analysis of select genes, using specific primer pairs (Supplementary Data 4). Fold change in expression of the respective transcripts was obtained after normalization with the level of a control gene htpG, which remains constant in both strains. Data represent mean values from multiple (n = 2) biological repeats.
Fig. 4
Fig. 4. Effect of resR/mcdR depletion on metabolic profile of Mtb.
a Heatmap representation of the expression levels of different metabolic genes. Genes associated with respiration, protein translation and lipid metabolism exhibiting differential expression by ≥2-fold (p < 0.05) in three biological repeat experiments are shown. b Heatmap analysis of metabolites. Level of different metabolites was estimated in the empty vector control (blue), resR/mcdR(−) (red) and resR/mcdR(−)::resR/mcdR (green) strains of Mtb mc2 7902 by LC-MS/MS. The heatmap represents normalized abundance of metabolites that are modulated by ≥1.3-fold (p < 0.05) in resR/mcdR(−) compared to control and resR/mcdR(−)::resR/mcdR complemented strains across six biological repeats.
Fig. 5
Fig. 5. ResR/McdR regulates protein synthesis in Mtb.
a Ribosome profile of Mtb strains. Different subunits of ribosome were fractionated by ultracentrifugation of equal amount of lysates from empty vector control, resR/mcdR(−) and resR/mcdR(−)::resR/mcdR strains of Mtb mc2 7902, after 7 days of incubation with 50 ng/ml ATc. Values of absorbance at 260 nm (A260) from a total of 30 fractions were plotted in a graph showing the status of 70 S ribosome as well as small (30 S) and large (50 S) subunits in all the three samples. b Effect of resR/mcdR silencing on initiation of protein synthesis in Mtb. Empty vector control, resR/mcdR(−) and resR/mcdR(−)::resR/mcdR strains of Mtb Erdman were incubated with 50 µg/ml puromycin for 1 hour after 7 days of ATc treatment. Lysates prepared from the respective strains were subjected to anti-puromycin immunoblotting, which reveals significant inhibition of newly translated proteins upon resR/mcdR silencing, which is restored by complementation with the wild-type copy of resR/mcdR. Immunoblotting was performed with an equal amount (30 µg) of protein lysates, as ascertained by the ponceau S staining of the membrane. The arrows on the left in b indicate the positions of molecular weight markers. Molecular weight markers were accentuated by hand as the signal faded after several washes of the blot. kDa, kilo Dalton.
Fig. 6
Fig. 6. Recognition of PrplN by ResR/McdR.
a Analysis of promoter activity by GFP reporter assay. Effect of resR/mcdR silencing on activity of PrplN was estimated by using GFP reporter assay. Estimation of GFP fluorescence reveals ~3-fold reduction under regulation of PrplN (rplN-GFP) but not under a control promoter, PpyrG (pyrG-GFP) upon resR/mcdR silencing (circle) compared to control (square). b Analysis of PrplN sequence used in EMSA. The TSS site is marked by bent arrow and the underlined sequences represent −35 and −10 promoter elements. Base positions in the respective PrplN derivatives are shown by double-headed arrows. The putative ResR/McdR-recognition sequence in the PrplN_FL is shown in black box. The conserved residues are highlighted in bold-face type. c Analysis of ResR/McdR binding with PrplN by EMSA. Binding was performed by using different concentrations of ResR/McdR with PrplN_FL, which reveals ResR/McdR dose-dependent complex formation with the full-length promoter. Notably, absence of complex with PrplN_TR confirms the sequence-specific binding of ResR/McdR with the proposed recognition sequence in PrplN_FL promoter. d Analysis of ResR/McdR binding kinetics with PrplN_FL. The graph shows the percentage of total DNA probe forming complex at the respective concentrations of ResR/McdR, as shown in c. e Multiple sequence alignment of ResR/McdR derivatives. Alignment of ResR/McdR homologs from the slow-growing Mtb complex bacteria (mtu, M. tuberculosis; mbo, M. bovis; maf, M. africanum; mpa, M. avium subspecies paratuberculosis) and the fast-growing mycobacteria (msm, M. smegmatis; mft, M. fortuitum; mva, M. vanbaalenii) reveals a high level of variability near the N-terminus, which is shown in a red box. f Dose-dependent binding of ResR/McdR17-225 with PrplN. Binding was analyzed by EMSA, typically as described above in c. g Assessment of ResR/McdR17-225 binding kinetics with PrplN_FL. The graph shows the percentage of total DNA probes forming a complex at the respective concentrations of ResR/McdR17-225, as shown in f. The dissociation constant (Kd) was determined by using GraphPad Prism v7.0e software. Data represent mean ± s.d. (shown by error bars) of multiple (n = 3) biological repeats in a. Non-linear fit of data from multiple (n = 2) biological repeats are shown in d, g. p values in a were obtained for the respective samples after comparison with control, as described in Methods.
Fig. 7
Fig. 7. Effect of suppression of resR/mcdR and rplN on post-antibiotic recovery of Mtb.
a Time-kill kinetics of the resR/mcdR(−). Time-kill kinetics was examined in response to treatment with isoniazid (INH), rifampicin (RIF), streptomycin (STR), and levofloxacin (LEV). The MDK99 by each drug, after exposure to 10× MIC is depicted by the dashed line. b Post-antibiotic recovery dynamics of resR/mcdR(−). Representative images, captured between 13 and 21 days of incubation, depict the post-antibiotic recovery dynamics of Mtb depleted with resR/mcdR. c Time-kill kinetics of the rplN(–). Time-kill kinetics was examined in response to treatment with 10× MIC of different drugs, as mentioned in a. The MDK99 by each drug is depicted by the dashed line. d Post-antibiotic recovery dynamics of rplN(–). Representative images, captured between 13 and 21 days of incubation, depict the post-antibiotic recovery dynamics of Mtb depleted with rplN. Scale bars in b, d are shown for size reference.

Similar articles

References

    1. WHO. Global Tuberculosis Report 2021. (2021).
    1. Galagan JE, et al. The Mycobacterium tuberculosis regulatory network and hypoxia. Nature. 2013;499:178–183. doi: 10.1038/nature12337. - DOI - PMC - PubMed
    1. Kevorkian YL, MacGilvary NJ, Giacalone D, Johnson C, Tan S. Rv0500A is a transcription factor that links Mycobacterium tuberculosis environmental response with division and impacts host colonization. Mol. Microbiol. 2022;117:1048–1062. doi: 10.1111/mmi.14886. - DOI - PMC - PubMed
    1. Ranganathan S, et al. Characterization of a cAMP responsive transcription factor, Cmr (Rv1675c), in TB complex mycobacteria reveals overlap with the DosR (DevR) dormancy regulon. Nucleic Acids Res. 2016;44:134–151. doi: 10.1093/nar/gkv889. - DOI - PMC - PubMed
    1. Ku HC, Cheng CF. Master regulator activating transcription factor 3 (ATF3) in metabolic homeostasis and cancer. Front. Endocrinol. (Lausanne) 2020;11:556. doi: 10.3389/fendo.2020.00556. - DOI - PMC - PubMed

Publication types

Substances