. 2023 Jul 11;13(1):11231.
doi: 10.1038/s41598-023-38214-6.

Reduced slow-wave activity and autonomic dysfunction during sleep precede cognitive deficits in Alzheimer's disease transgenic mice

Affiliations

Reduced slow-wave activity and autonomic dysfunction during sleep precede cognitive deficits in Alzheimer's disease transgenic mice

Chieh-Wen Chen et al. Sci Rep. .

Abstract

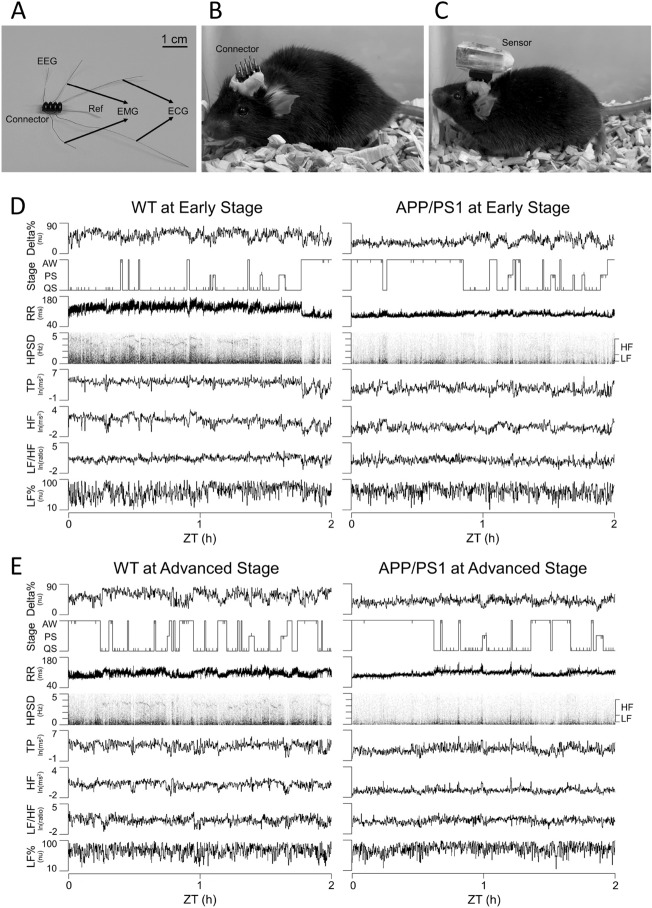
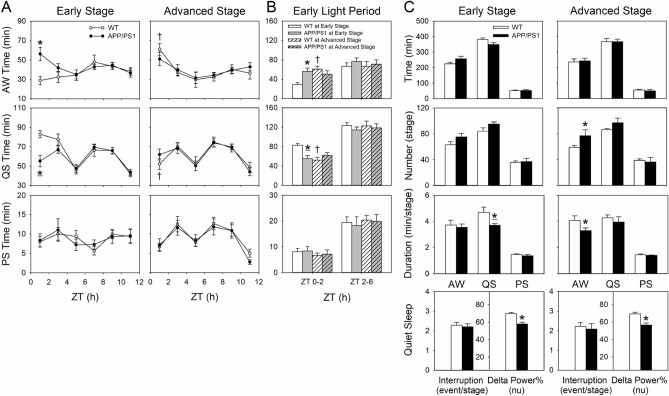
Occurrence of amyloid-β (Aβ) aggregation in brain begins before the clinical onset of Alzheimer's disease (AD), as preclinical AD. Studies have reported that sleep problems and autonomic dysfunction associate closely with AD. However, whether they, especially the interaction between sleep and autonomic function, play critical roles in preclinical AD are unclear. Therefore, we investigated how sleep patterns and autonomic regulation at different sleep-wake stages changed and whether they were related to cognitive performance in pathogenesis of AD mice. Polysomnographic recordings in freely-moving APP/PS1 and wild-type (WT) littermates were collected to study sleep patterns and autonomic function at 4 (early disease stage) and 8 months of age (advanced disease stage), cognitive tasks including novel object recognition and Morris water maze were performed, and Aβ levels in brain were measured. APP/PS1 mice at early stage of AD pathology with Aβ aggregation but without significant differences in cognitive performance had frequent sleep-wake transitions, lower sleep-related delta power percentage, lower overall autonomic activity, and lower parasympathetic activity mainly during sleep compared with WT mice. The same phenomenon was observed in advanced-stage APP/PS1 mice with significant cognitive deficits. In mice at both disease stages, sleep-related delta power percentage correlated positively with memory performance. At early stage, memory performance correlated positively with sympathetic activity during wakefulness; at advanced stage, memory performance correlated positively with parasympathetic activity during both wakefulness and sleep. In conclusion, sleep quality and distinction between wake- and sleep-related autonomic function may be biomarkers for early AD detection.


Conflict of interest statement

The authors declare no competing interests.

Figures

Figure 1
Figure 1
Amyloid plaques and activation of astrocytes in APP/PS1 mice individually at the early (21 weeks of age) and advanced (37 weeks of age) stages of the disease and their age-matched WT littermates. (A) Representative immunohistochemical images of amyloid plaques (green), GFAP (red), and DAPI (blue) in the cortices of 21- and 37-week-old WT and APP/PS1 mice. Scale bar, 50 μm. (B) Histograms for the amyloid plaque coverage and GFAP coverage per amyloid plaque coverage in 21- and 37-week-old WT and APP/PS1 mice. ND is non-detectable. Values are presented as mean ± SEM. Early stage: WT, n = 9; APP/PS1, n = 10; advanced stage: WT, n = 7, APP/PS1, n = 6. *p < 0.05 vs WT mice by Mann–Whitney U test for nonnormality. DAPI, 4′,6-diamidino-2-phenylindole; GFAP, glial fibrillary acidic protein; WT, wild type.
Figure 2
Figure 2
Cognitive function in APP/PS1 mice individually at the early (20–21 weeks of age) and advanced (36–37 weeks of age) stages of the disease and their age-matched WT littermates. (A) Recognition memory by the indexes of the novel object recognition task of discrimination ratio. Early stage: WT, n = 9; APP/PS1, n = 10; advanced stage: WT, n = 10; APP/PS1, n = 9. (B and C) Spatial learning and memory ability indicated by indices for the Morris water maze task of (B) average escape latency for finding the platform (seconds) and (C) the number of times that the mice crossed the original platform location in the probe trial. (D) Average swimming speed during the 6 consecutive days of the Morris water maze. Early stage: WT, n = 9; APP/PS1, n = 12; advanced stage: WT, n = 5, APP/PS1, n = 5. The results are expressed as means ± SEM. *p < 0.05 vs. WT by independent t test, *p < 0.05 vs. WT by Mann–Whitney U test. ap < 0.05 vs. the first day of the Morris water maze in WT by Fisher’s least significant difference test following a significant one-way repeated-measures analysis of variance (ANOVA), ap < 0.05 vs. the first day of the Morris water maze in WT by Dunn post-hoc method following a significant Friedman test. bp < 0.05 vs. the first day of the Morris water maze in APP/PS1 by Dunn post-hoc method following a significant Friedman test. WT, wild type.
Figure 3
Figure 3
Physiological signals acquisition by using the wireless sensor and continuous and simultaneous analyses of various physiological signals in APP/PS1 mice at the early (18–19 weeks of age) and advanced (34–35 weeks of age) stages of the disease and in their age-matched wild-type (WT) littermates. (A) Handmade connector with electroencephalogram (EEG), electromyogram (EMG), and electrocardiogram (ECG) electrodes. (B) The connector on the head of the mouse. (C) The wireless sensor was attached to the connector on the head of the mouse. (D and E) Continuous and simultaneous analyses of delta power percentage of the electroencephalographic spectrogram (Delta%), sleep–wake state, and heart rate variability during the first 2 h (ZT 0–2) of the light period for a WT mouse and an APP/PS1 mouse at (D) the early stage (18–19 weeks old) and (E) the advanced stage (34–35 weeks old) of the disease. The sleep stages (Stage) included active waking (AW), paradoxical sleep (PS), and quiet sleep (QS). Interruptions of QS were marked by the vertical ticks in the hypnogram. R–R interval (RR) and its power spectrogram (HPSD) are displayed with temporal alterations in total power (TP), high-frequency power (HF), low-frequency power to high-frequency power ratio (LF/HF), and normalized low-frequency power (LF%) of heart rate variability. The range of frequencies for HF and LF are denoted on the right side of the spectrograms. Ref, reference; ln, natural logarithm; nu, normalized units; ZT, Zeitgeber time.
Figure 4
Figure 4
Sleep patterns during 11 h of the light period in APP/PS1 mice individually at the early (18–19 weeks of age) and advanced (34–35 weeks of age) stages of the disease and in their age-matched WT littermates. (A and B) Accumulated AW, QS, and PS times using a 2-h window (A) during the light period over 11 h and (B) during ZT 0–2 and ZT 2–6 of the early light period over 5.5 h. Due to the 5.5-h battery life limit of the wireless sensor, we only analyzed the 1.5 h of data recorded between ZT 4–6 and ZT 10–12. (C) Time, number, and duration during different sleep–wake stages and interruptions and delta power% of the electroencephalographic spectrogram during the QS stage. Values are presented as mean ± SEM. Early stage: WT, n = 7; APP/PS1, n = 11; advanced stage: WT, n = 8, APP/PS1, n = 8. *p < 0.05 vs. WT by independent t test, *p < 0.05 vs. WT by Mann–Whitney U test. p < 0.05 vs. early stage in WT by independent t test, there were no significant differences between the early stage and advanced stage of the disease in APP/PS1 mice by either independent t test or Mann–Whitney U test. AW, active waking; QS, quiet sleep; PS, paradoxical sleep; Time, total time spent in a specific stage within the analysis period; Number, number of bouts for a specific stage; Duration, average duration of bouts for a particular stage; nu, normalized units; WT, wild type.
Figure 5
Figure 5
Cardiac autonomic function during different sleep–wake states during the light period in WT and APP/PS1 mice individually at (A) the early (18–19 weeks of age) and (B) advanced (34–35 weeks of age) stages of the disease. Values are presented as mean ± SEM. Early stage: WT, n = 7; APP/PS1, n = 11; advanced stage: WT, n = 8, APP/PS1, n = 8. *p < 0.05 vs. WT by independent t test, *p < 0.05 vs. WT by Mann–Whitney U test. There were no significant differences between the early stage and advanced stage of the disease by independent t test or Mann–Whitney U test. AW, active waking; QS, quiet sleep; PS, paradoxical sleep; RR, R–R interval; TP, total power of heart rate variability; HF, high-frequency power of heart rate variability; LF/HF, low-frequency power to high-frequency power ratio of heart rate variability; LF%, normalized low-frequency power of heart rate variability; ln, natural logarithm; nu, normalized units; WT, wild type.
Figure 6
Figure 6
Relationship between physiological parameters and cognitive function in all mice (WT and APP/PS1 mice) individually at the early and advanced stages of the disease. (A) Correlations of accumulated time, interruption and delta power% of the electroencephalographic spectrogram in QS during the light period with the number of platform crosses. (B) The correlation of cardiac autonomic function—including TP, HF, LF/HF, LF% in AW (open circle and dashed line), and QS (closed circle and solid line) stages—during the light period with the number of platform crosses. Early stage: WT and APP/PS1, n = 17; advanced stage: WT and APP/PS1, n = 10. *p < 0.05 by Pearson correlation analysis. There was no significant correlation between physiological parameters and number of platform crosses by Spearman correlation analysis for nonnormality. AW, active waking; QS, quiet sleep; TP, total power of heart rate variability; HF, high-frequency power of heart rate variability; LF/HF, low-frequency power to high-frequency power ratio of heart rate variability; LF%, normalized low-frequency power of heart rate variability; ln, natural logarithm; nu, normalized units; WT, wild type.

Similar articles

Cited by

References

    1. As Association Alzheimer’s disease facts and figures. Alzheimers Dement. 2021;17:327–406. doi: 10.1002/alz.12328. - DOI - PubMed
    1. Hardy J, Selkoe DJ. The amyloid hypothesis of Alzheimer's disease: Progress and problems on the road to therapeutics. Science. 2002;297:353–356. doi: 10.1126/science.1072994. - DOI - PubMed
    1. Holtzman DM, Morris JC, Goate AM. Alzheimer's disease: The challenge of the second century. Sci. Transl. Med. 2011;3:77sr71. doi: 10.1126/scitranslmed.3002369. - DOI - PMC - PubMed
    1. Sperling RA, et al. Toward defining the preclinical stages of Alzheimer's disease: Recommendations from the National Institute on Aging-Alzheimer's Association workgroups on diagnostic guidelines for Alzheimer's disease. Alzheimers Dement. 2011;7:280–292. doi: 10.1016/j.jalz.2011.03.003. - DOI - PMC - PubMed
    1. Sperling RA, et al. Amyloid deposition is associated with impaired default network function in older persons without dementia. Neuron. 2009;63:178–188. doi: 10.1016/j.neuron.2009.07.003. - DOI - PMC - PubMed

Publication types

Substances