. 2023 Jul 11;3(1):71.
doi: 10.1038/s43705-023-00282-0.

Potential relevance between soybean nitrogen uptake and rhizosphere prokaryotic communities under waterlogging stress

Affiliations

Potential relevance between soybean nitrogen uptake and rhizosphere prokaryotic communities under waterlogging stress

Tengxiang Lian et al. ISME Commun. .

Abstract

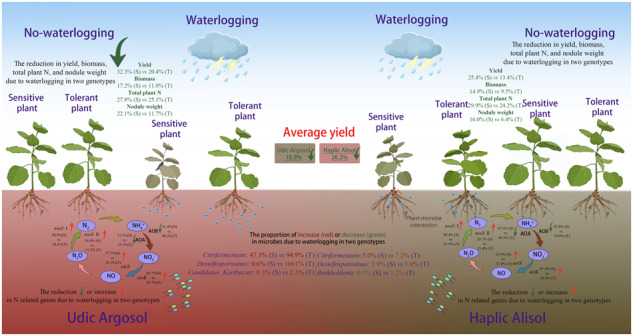
Waterlogging in soil can limit the availability of nitrogen to plants by promoting denitrification and reducing nitrogen fixation and nitrification. The root-associated microorganisms that determine nitrogen availability at the root-soil interface can be influenced by plant genotype and soil type, which potentially alters the nitrogen uptake capacity of plants in waterlogged soils. In a greenhouse experiment, two soybean genotypes with contrasting capacities to resist waterlogging stress were grown in Udic Argosol and Haplic Alisol soils with and without waterlogging, respectively. Using isotope labeling, high-throughput amplicon sequencing and qPCR, we show that waterlogging negatively affects soybean yield and nitrogen absorption from fertilizer, atmosphere, and soil. These effects were soil-dependent and more pronounced in the waterlogging-sensitive than tolerant genotype. The tolerant genotype harbored more ammonia oxidizers and less nitrous oxide reducers. Anaerobic, nitrogen-fixing, denitrifying and iron-reducing bacteria such as Geobacter/Geomonas, Sphingomonas, Candidatus Koribacter, and Desulfosporosinus were proportionally enriched in association with the tolerant genotype under waterlogging. These changes in the rhizosphere microbiome might ultimately help the plant to improve nitrogen uptake under waterlogged, anoxic conditions. This research contributes to a better understanding of the adaptability of soybean genotypes under waterlogging stress and might help to formulate fertilization strategies that improve nitrogen use efficiency of soybean. Schematic representation of the effects of waterlogging on nitrogen uptake and rhizosphere microbiota in dependence of soil type and soybean genotype.


Conflict of interest statement

The authors declare no competing interests.

Figures

None
Schematic representation of the effects of waterlogging on nitrogen uptake and rhizosphere microbiota in dependence of soil type and soybean genotype.
Fig. 1
Fig. 1. Effects of waterlogging on plant properties.
Changes in soybean dry weight seed yield (A) and dry weight biomass (B) at harvest, number of root nodules (C) and nodule fresh weight (D), and total shoot N content (E) and its fractions derived from symbiotic N-fixation (F), N-fertilizer (G), and soil N mineralization (H) across both genotypes (tolerant vs. sensitive) and soils (Udic Argosol vs. Haplic Alisol). Different letters indicate significant (p < 0.05, n = 3 for yield and biomass, n = 6 for all others) differences as determined by Tukey’s HSD. U Udic Argosol, H Haplic Alisol, C control, W waterlogging, S sensitive genotype, T tolerant genotype.
Fig. 2
Fig. 2. Effects of waterlogging on soil chemical properties.
Changes in soil organic carbon (A), total nitrogen (B), ammonium (C), nitrate (D), total phosphorus (E), available phosphorus (F), available potassium (G), and pH (H) across both genotypes (tolerant vs. sensitive) and soils (Udic Argosol vs. Haplic Alisol). Different letters indicate significant (p < 0.05, n = 6) differences as determined by Tukey’s HSD. A acidic soil, N neutral soil, C control, W waterlogging, S sensitive genotype, T tolerant genotype.
Fig. 3
Fig. 3. Effects of waterlogging on prokaryotic gene copy numbers.
Changes in copy numbers of bacterial (A) and archaeal (B) 16S rRNA genes, bacterial (C) and archaeal (D) amoA genes, nirS (E) and nirK (F) genes, and nosZ clade I (G) and clade II (H) genes across both genotypes (tolerant vs. sensitive) and soils (Udic Argosol vs. Haplic Alisol). Different letters indicate significant (p < 0.05, n = 6) differences as determined by Tukey’s HSD. U Udic Argosol, H Haplic Alisol, C control, W waterlogging, S sensitive genotype, T tolerant genotype.
Fig. 4
Fig. 4. Effects of waterlogging on rhizosphere prokaryotic diversity.
Changes in prokaryotic alpha- and beta-diversity in the soybean rhizosphere, i.e., observed richness (A), Pielou’s evenness (B), Shannon diversity (C), principal coordinate analysis (PCO) based on Bray–Curtis dissimilarities (D), canonical analysis of principal coordinates (CAP) constrained by treatment and genotype (E), and relative abundances of the major phyla (F). All metrics are based on iteratively rarefied ASV counts. Different letters in (AC) indicate significant (p < 0.05, n = 6) differences as determined by Tukey’s HSD. Percent explained variance of each PCO axis (D) and percent between group variation of each CAP axis (E) are provided in parentheses. The CAP reclassification success rates (i.e., a quantitative estimation of the robustness of each treatment × genotype group) is provided next to the data clouds (E). The 12 phyla with the highest relative abundance are displayed, whereas less abundant phyla are grouped into “others”. ASVs not assigned at the phylum level (unclassified bacteria and archaea) are grouped into “unclassified”. U Udic Argosol, H Haplic Alisol, C control, W waterlogging, S sensitive genotype, T tolerant genotype.
Fig. 5
Fig. 5. Prokaryotic taxa showing a genotype-dependent response to waterlogging.
Taxonomic tree showing the prokaryotic ASVs assigned at the last common assignment level that responded significantly to interaction between genotype and waterlogging in the Udic Argosol (PERMANOVA, q < 0.1, n = 6). Bars represent scaled relative abundances of ASVs that are proportionally enriched under the control and waterlogging treatments in the rhizosphere of the sensitive and tolerant genotypes in the Udic Argosol. The outer circle shows the last common assignment level information of the ASVs. C control, W waterlogging, S sensitive genotype, T tolerant genotype.

Similar articles

Cited by

References

    1. Loreti E, van Veen H, Perata P. Plant responses to flooding stress. Curr Opin Plant Biol. 2016;33:64–71. doi: 10.1016/j.pbi.2016.06.005. - DOI - PubMed
    1. Kaur G, Singh G, Motavalli PP, Nelson KA, Orlowski JM, Golden BR. Impacts and management strategies for crop production in waterlogged or flooded soils: a review. Agron J. 2020;112:1475–501. doi: 10.1002/agj2.20093. - DOI
    1. Minchin FR, Summerfield RJ, Eaglesham ARJ, Stewart KA. Effects of short-term waterlogging on growth and yield of cowpea (Vigna unguiculata) J Agric Sci. 1978;90:355–66. doi: 10.1017/S0021859600055465. - DOI
    1. Christophe S, Jean-Christophe A, Annabelle L, Alain O, Marion P, Anne-Sophie V. Plant N fluxes and modulation by nitrogen, heat and water stresses: a review based on comparison of legumes and non legume plants. In: Shanker A, Venkateswarlu B, editors. Abiotic stress in plants–mechanisms and adaptations. Rijeka: Intech Open Access Publisher; 2011. p. 79–118.
    1. Oram NJ, Sun Y, Abalos D, van Groenigen JW, Hartley S, De Deyn GB. Plant traits of grass and legume species for flood resilience and N2O mitigation. Funct Ecol. 2021;35:2205–18. doi: 10.1111/1365-2435.13873. - DOI