. 2023 Jul 11;14(1):11.
doi: 10.1186/s13227-023-00215-x.

Expression and possible functions of a horizontally transferred glycosyl hydrolase gene, GH6-1, in Ciona embryogenesis

Affiliations

Expression and possible functions of a horizontally transferred glycosyl hydrolase gene, GH6-1, in Ciona embryogenesis

Kun-Lung Li et al. Evodevo. .

Abstract

Background: The Tunicata or Urochordata is the only animal group with the ability to synthesize cellulose directly and cellulose is a component of the tunic that covers the entire tunicate body. The genome of Ciona intestinalis type A contains a cellulose synthase gene, CesA, that it acquired via an ancient, horizontal gene transfer. CesA is expressed in embryonic epidermal cells and functions in cellulose production. Ciona CesA is composed of both a glycosyltransferase domain, GT2, and a glycosyl hydrolase domain, GH6, which shows a mutation at a key position and seems functionless. Interestingly, the Ciona genome contains a glycosyl hydrolase gene, GH6-1, in which the GH6 domain seems intact. This suggests expression and possible functions of GH6-1 during Ciona embryogenesis. Is GH6-1 expressed during embryogenesis? If so, in what tissues is the gene expressed? Does GH6-1 serve a function? If so, what is it? Answers to these questions may advance our understanding of evolution of this unique animal group.

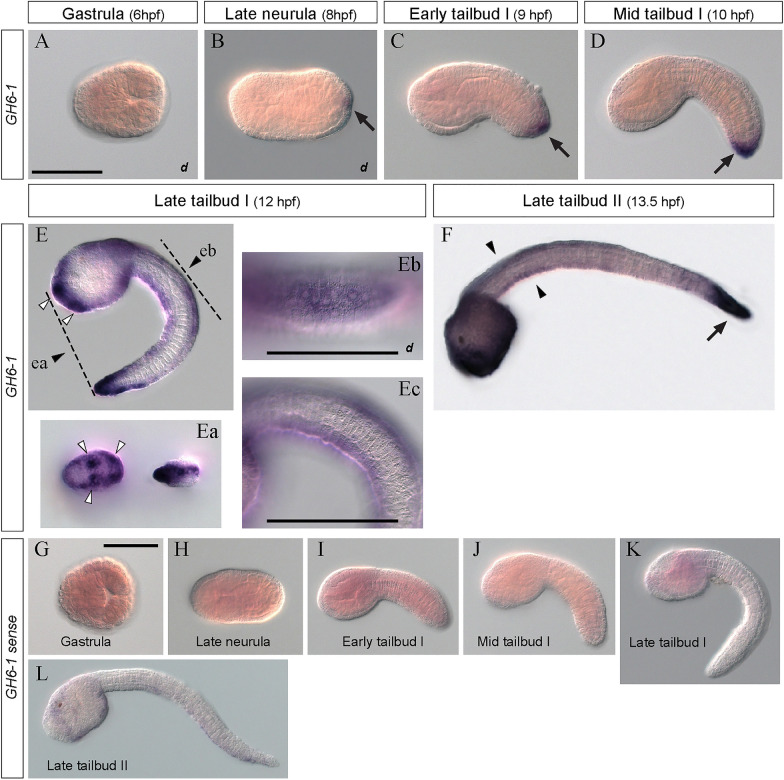
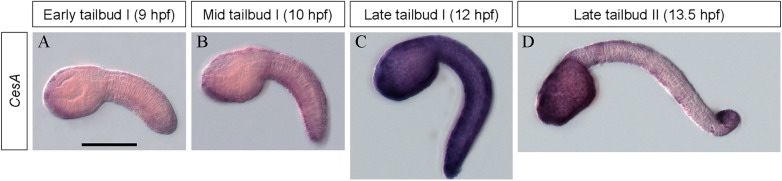
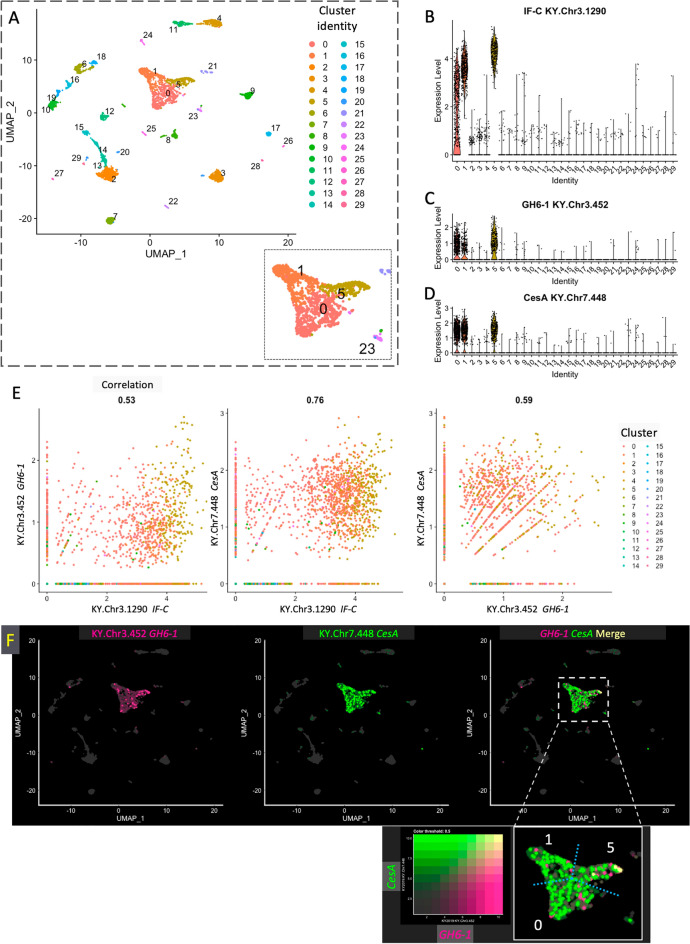
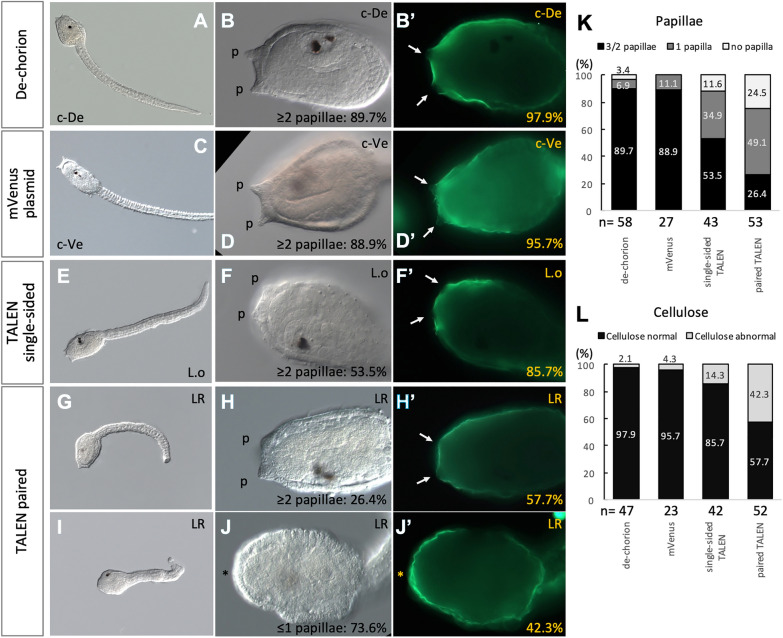
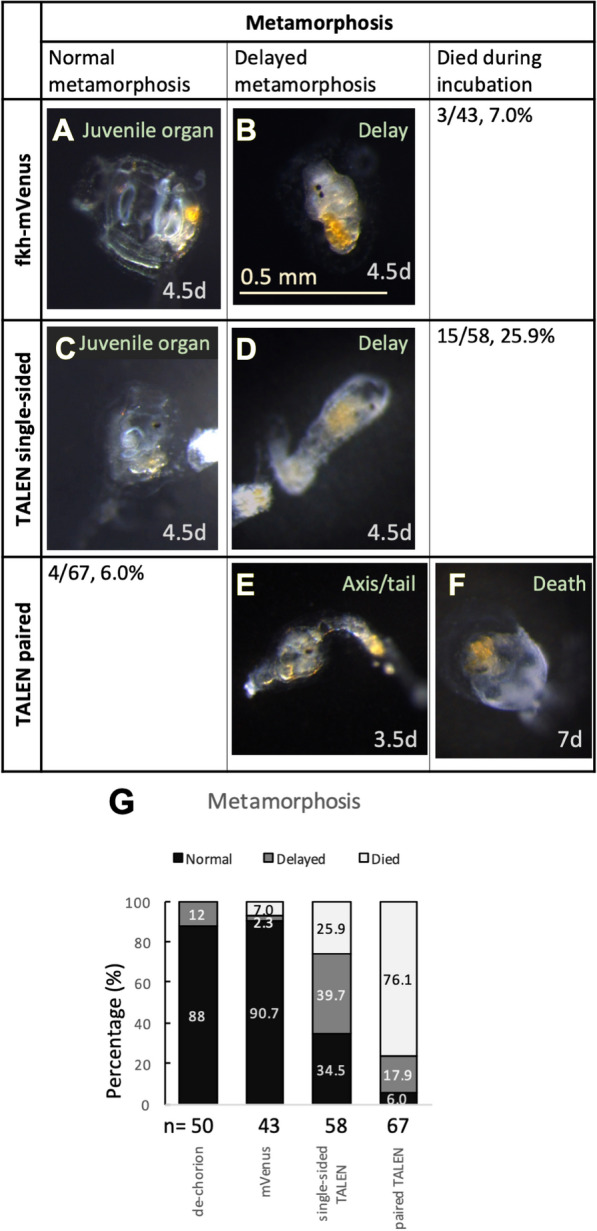
Results: Quantitative reverse transcription PCR and in situ hybridization revealed that GH6-1 is expressed in epidermis of tailbud embryos and in early swimming larvae, a pattern similar to that of CesA. Expression is downregulated at later stages and becomes undetectable in metamorphosed juveniles. The GH6-1 expression level is higher in the anterior-trunk region and caudal-tip regions of late embryos. Single-cell RNA sequencing analysis of the late tailbud stage showed that cells of three clusters with epidermal identity express GH6-1, and that some of them co-express CesA. TALEN-mediated genome editing was used to generate GH6-1 knockout Ciona larvae. Around half of TALEN-electroporated larvae showed abnormal development of adhesive papillae and altered distribution of surface cellulose. In addition, three-fourths of TALEN-electroporated animals failed to complete larval metamorphosis.

Conclusions: This study showed that tunicate GH6-1, a gene that originated by horizontal gene transfer of a prokaryote gene, is recruited into the ascidian genome, and that it is expressed and functions in epidermal cells of ascidian embryos. Although further research is required, this observation demonstrates that both CesA and GH6-1 are involved in tunicate cellulose metabolism, impacting tunicate morphology and ecology.

Keywords: Expression and function in Ciona embryogenesis; Glycosyl hydrolase family-6 GH6 gene; Horizontally transferred genes; Tunicates.


Conflict of interest statement

The authors declare that they have no competing interests.

Figures

Fig. 1
Fig. 1
Quantitative changes in expression levels of GH6-1 (left) and CesA (right) during early development of Ciona intestinalis type A. The X-axis shows developmental time in hours and stages. The Y-axis shows gene expression levels. The expression level of each gene was first normalized to a ubiquitously expressed GAPDH (glyceraldegyde-3-phosphate dehydrogenase) and then expression at 6 h post fertilization (hpf) was set as 1 for normalization. Error bars indicate the standard error of three experimental replicates. Developmental staging follows the TUNICANATO website [44, 57]
Fig. 2
Fig. 2
In situ hybridization of spatial expression of GH6-1 in Ciona embryos. A The hybridization signal was not observed in gastrula stage (6 hpf). B The GH6-1 signal in epidermal cells is first observed at the tail-tip region of late neurulae (arrow; 8 hpf) followed by C early (arrow; 9 hpf) and D mid tailbud stages (arrow; 10 hpf). E, F Expanded signals of GH6-1 are evident in epidermal cells at (E) late tailbud I stage (12 hpf) and (F) late tailbud II stage (13.5 hpf). Panels Ea, Eb, and Ec show enlargement of the area shown in E. Ea The specimen viewed from anterior (left) and posterior side (right). White arrowheads show regions corresponding to adhesive papilla primordia; Eb viewed from the dorsal side, and Ec from the side. F Late tailbud stage (13.5 hpf). Arrows show a strong signal at tail-tip epidermis, while arrowheads show moderate signal along tail midline epidermis. GL Control embryos treated with sense riboprobe show undetectable level of signal. G Gastrula; H late neurula; I early-to-mid tailbud; J mid tailbud; K late tailbud I; L late tailbud II. AE, Ea, and F are at the same magnification as panel A, in which a scale bar represents 100 μm. Scale bars in Eb and Ec represent 100 μm. G Shows a scale bar of 100 μm; HL Are at the same magnification as G. The d footnote in A, B, and Eb denotes a dorsal view
Fig. 3
Fig. 3
In situ hybridization of the CesA gene in Ciona embryos. Signals for Ciona CesA expression become detectable at A early tailbud (9 hpf), B mid tailbud (10 hpf), C late tailbud I (12 hpf) and D late tailbud II (13.5 hpf). Signals appear in epidermis more ubiquitously than expression of GH6-1. The scale bar in panel A represents 100 μm and applies to all panels
Fig. 4
Fig. 4
Single-cell transcriptome analysis showed that Ciona GH6-1 and CesA expression correspond to epidermal cell identity. A A dimension-reduction plot shows a representation of late tailbud stage I embryonic cells, separated into 30 clusters (numbered 0 to 29). Dimensions were reduced by the uniform manifold approximation and projection (UMAP) technique in the Seurat package. Each dot represents the transcriptome of a single cell. Cells in the same cluster have similar gene expression profiles. Numbers and color labels denote cluster identities. BD Violin plots showing expression levels of three genes. X-axis: cell cluster identifier. Y-axis: normalized expression level of each gene. B The IF-C gene (KY.Chr3.1290) was selected as an epidermal marker of cell identity of clusters. It was highly expressed in cells in clusters No. 1 and 5 and to a lesser extent in cluster 0. C, D GH6-1-expressing cells and CesA-expressing cells were mostly identified in clusters 0, 1, and 5. E Scatterplots showing relationships of normalized expression of IF-C, GH6-1, and CesA. Each dot represents the transcriptome of a cell and cells are colored by cluster identity. The X- and Y-axes represent normalized expression levels. Pearson correlation between the two features is displayed above each plot. F UMAP-dimension-reduction plots showing normalized expression levels of GH6-1 and CesA genes. Although expression of these two genes appeared mostly in the same cell clusters 0, 1, and 5, only a few cells show high expression of both genes (yellow dots). The enlarged, dashed rectangular area is shown as an insert at the bottom-right. Note that KY gene models (2019 version, KY.ChrX.yyyy) were used in the original analysis and the corresponding KY21 gene models (the latest version) are described in the main text
Fig. 5
Fig. 5
GH6-1 knockout by TALEN-mediated genome editing affected Ciona larval development. A, B Control larvae developed from dechorionated eggs. C, D Control larvae developed from eggs electroporated with mVenus plasmids. E, F Control larvae developed from eggs electroporated with single-sided TALEN. GJ Experimental larvae developed from eggs electroporated with paired TALEN plasmids. While most control larvae showed adhesive papillae (p in BH) and regionally reduced cellulose (arrows in B′–F′), many larvae of GH6-1 TALEN knockout failed to form adhesive papillae (asterisk in J) and show a strong cellulose signal all over the anterior epidermis (J′). K, L Percentages of larvae of each phenotype. K Larvae were grouped as: 3 or 2 papillae, 1 papilla, no papilla. L Cellulose normal: surface cellulose was found at the larval tunic outside the epidermis, while cellulose signal was reduced around papillae in the anterior trunk. Cellulose abnormal: surface cellulose exists, but there is no local reduction of cellulose signal strength around papillae. AJ Are DIC images; B′, D′, F′, H′ and J′ are green fluorescence channels showing cellulose after CBM-GFP staining. c-De, control-dechorionated group. c-Ve, control-mVenus group. L.o, Only the left TALEN plasmid was introduced during electroporation. LR: both of the left and right TALEN plasmids were introduced during electroporation. p: adhesive papillae. Asterisk sign (*): no papilla formation
Fig. 6
Fig. 6
TALEN-mediated GH6-1 knockout affected Ciona larval metamorphosis. A, B Control metamorphosing Ciona developed from eggs electroporated with mVenus plasmids. A A normally developing animal showing juvenile organs; B an individual showing successful resorption of the larval tail, but further metamorphosis steps were delayed. C, D Control metamorphosing Ciona developed from eggs electroporated with single-sided TALEN. C An individual that completed tail resorption, showing juvenile organs; D an animal showing incomplete tail resorption and delayed metamorphosis. E, F Experimental Ciona developed from eggs electroporated with paired TALEN plasmids. E An individual showing trunk axis rotation, but incomplete tail resorption; F an individual showing no progress of metamorphosis and dying cells. G Percentages of animals of each phenotype. Metamorphosis normal: on the sixth day post fertilization (6dpf), this juvenile had absorbed the tail, completed axis rotation, and showed at least one juvenile structure: mouth, gills, or endostyle. Metamorphosis delayed: at 6dpf, attached larvae either did not grow structures mentioned above or had not finished tail absorption. Three and half days to seven days post fertilization is represented as 3.5d, 4.5d, and 7d. The scale in B applies to all panels

Similar articles

Cited by

References

    1. Delsuc F, Brinkmann H, Chourrout D, Philippe H. Tunicates and not cephalochordates are the closest living relatives of vertebrates. Nature. 2006;439:965–968. doi: 10.1038/nature04336. - DOI - PubMed
    1. Delsuc F, Tsagkogeorga G, Lartillot N, Philippe H. Additional molecular support for the new chordate phylogeny. Genesis. 2008;46:592–604. doi: 10.1002/dvg.20450. - DOI - PubMed
    1. Satoh N, Tagawa K, Takahashi H. How was the notochord born? Evol Dev. 2012;14:56–75. doi: 10.1111/j.1525-142X.2011.00522.x. - DOI - PubMed
    1. Inoue J, Nakashima K, Satoh N. ORTHOSCOPE analysis reveals the presence of the cellulose synthase gene in all tunicate genomes but not in other animal genomes. Genes. 2019;10:294. doi: 10.3390/genes10040294. - DOI - PMC - PubMed
    1. Satoh, N. 2014. Developmental Genomics of Ascidians, Hoboken, New Jersey, Wiley-Blackwell, 9781118656181.

LinkOut - more resources