. 2023 Jul 12;42(1):164.
doi: 10.1186/s13046-023-02747-5.

The Ephrin tyrosine kinase a3 (EphA3) is a novel mediator of RAGE-prompted motility of breast cancer cells

Affiliations

The Ephrin tyrosine kinase a3 (EphA3) is a novel mediator of RAGE-prompted motility of breast cancer cells

Marianna Talia et al. J Exp Clin Cancer Res. .

Abstract

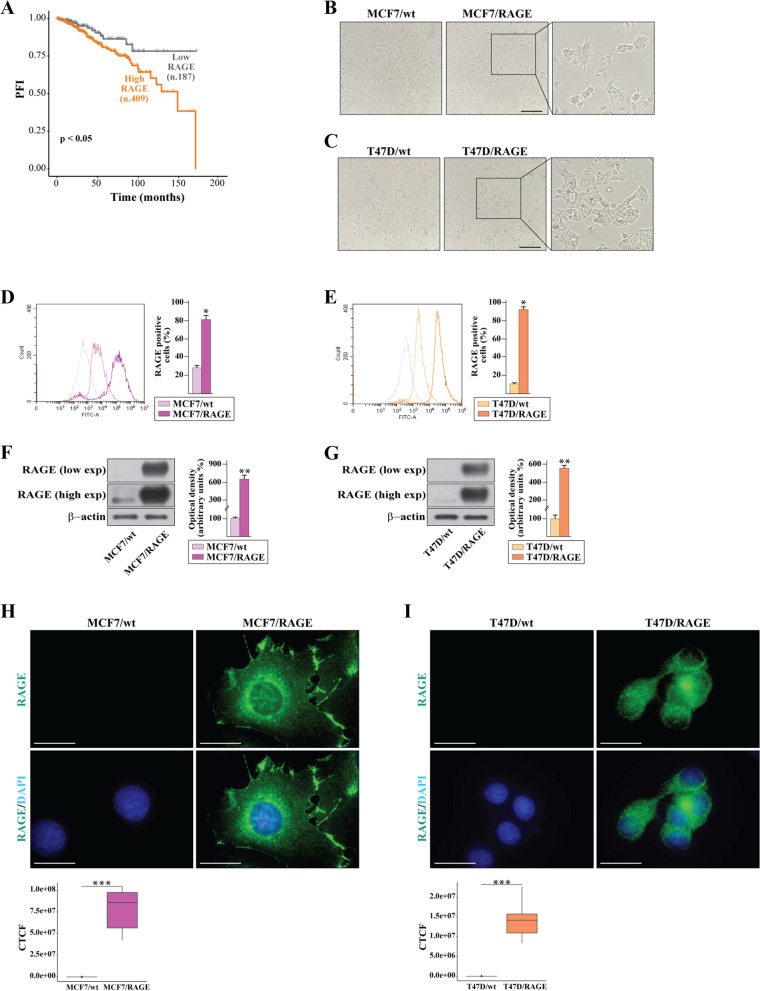
Background: The receptor for advanced glycation-end products (RAGE) and its ligands have been implicated in obesity and associated inflammatory processes as well as in metabolic alterations like diabetes. In addition, RAGE-mediated signaling has been reported to contribute to the metastatic progression of breast cancer (BC), although mechanistic insights are still required. Here, we provide novel findings regarding the transcriptomic landscape and the molecular events through which RAGE may prompt aggressive features in estrogen receptor (ER)-positive BC.

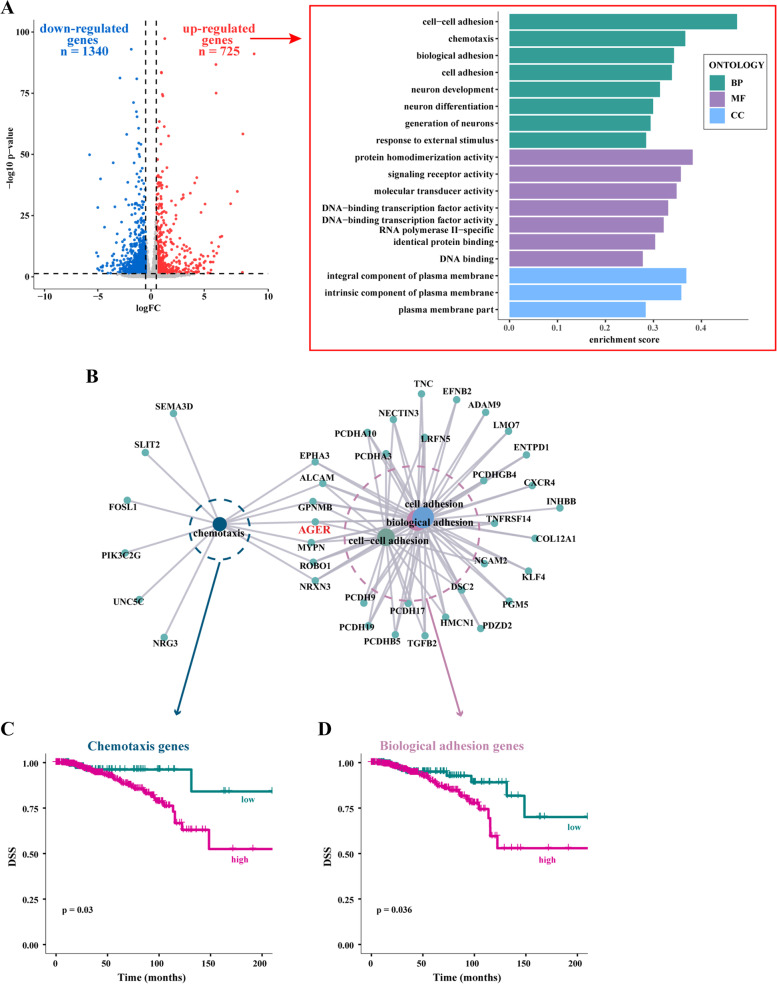
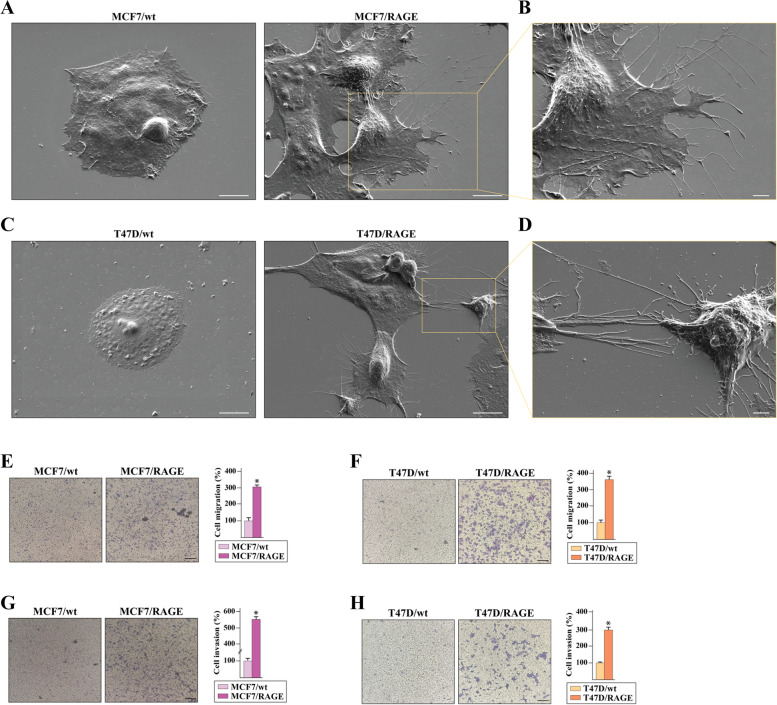
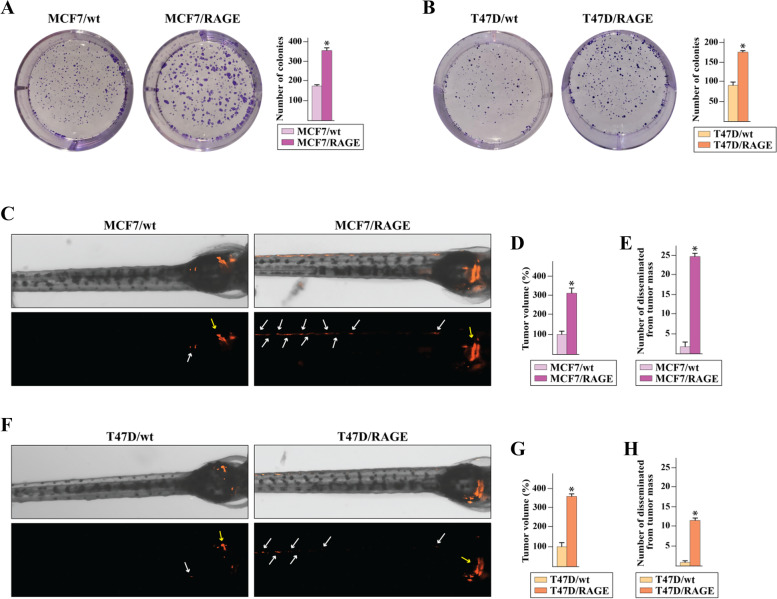
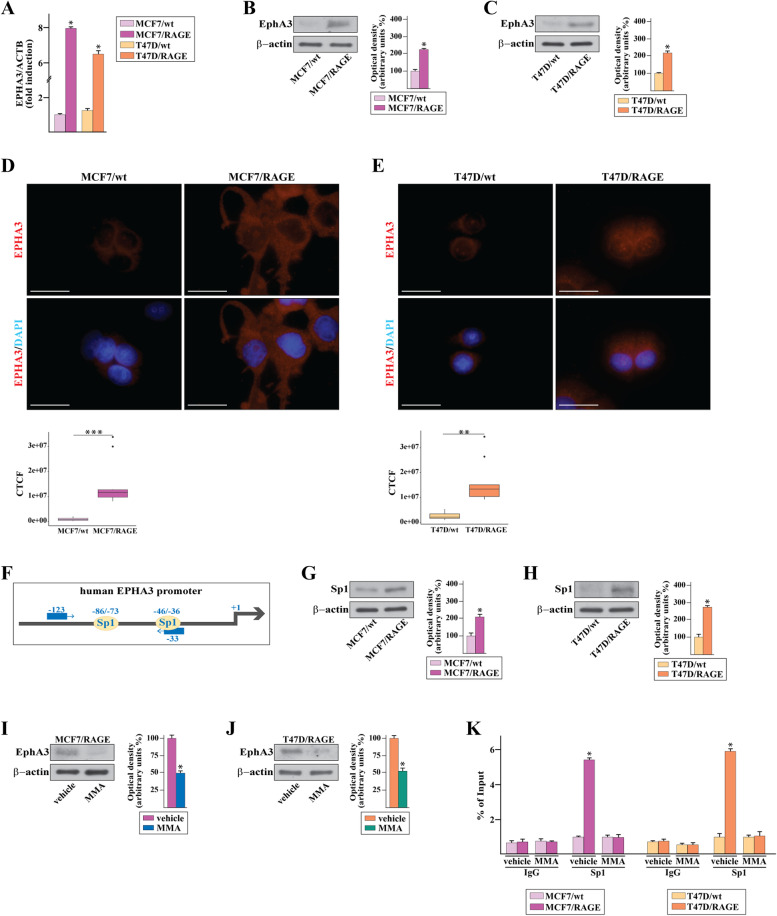
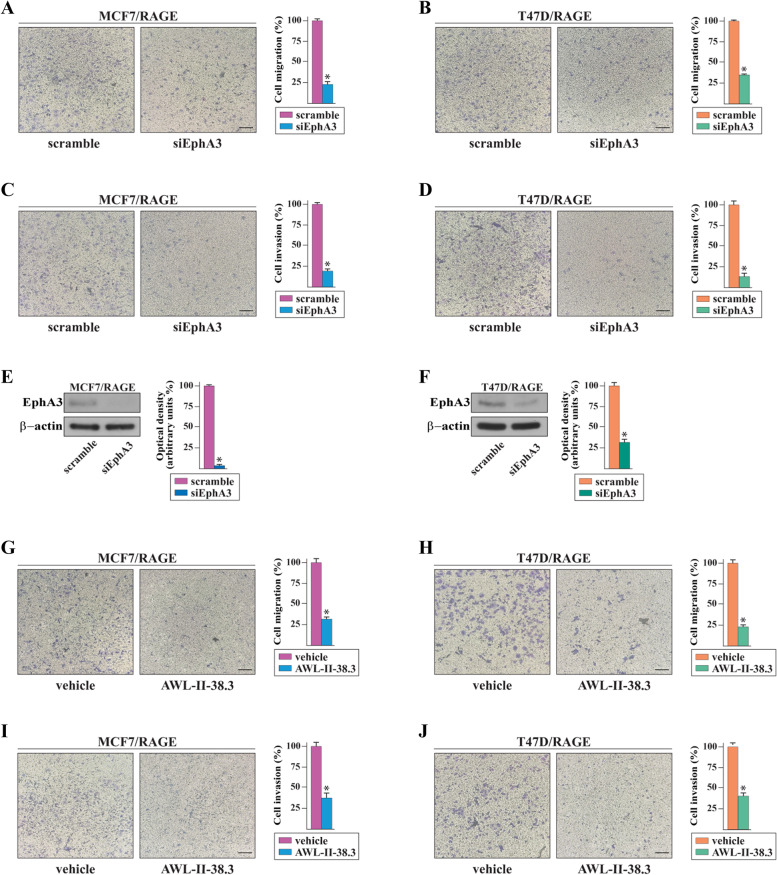
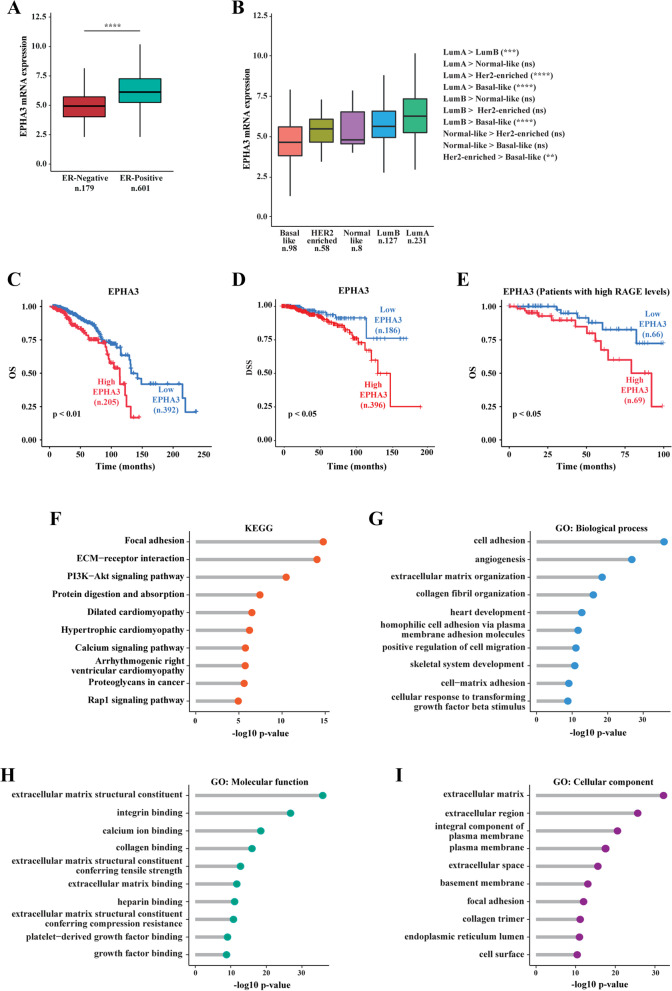
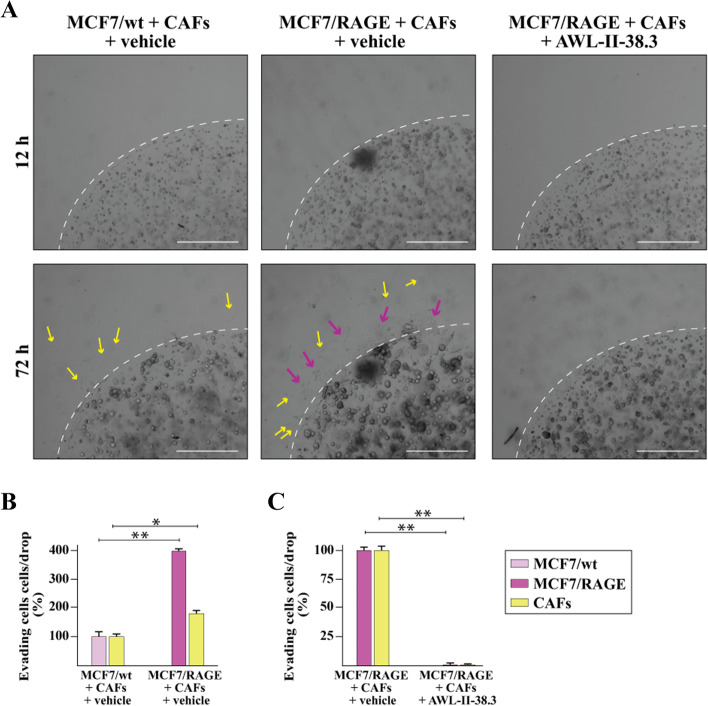
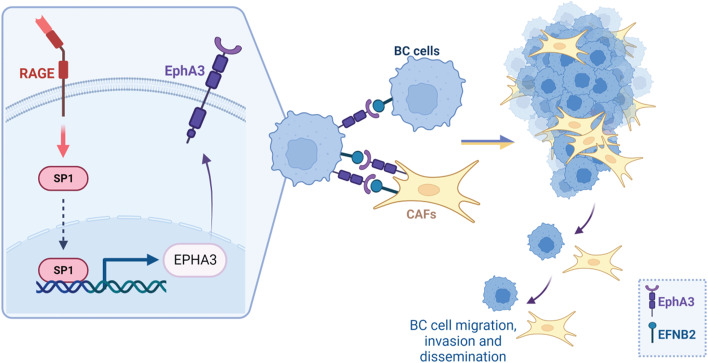
Methods: MCF7 and T47D BC cells stably overexpressing human RAGE were used as a model system to evaluate important changes like cell protrusions, migration, invasion and colony formation both in vitro through scanning electron microscopy, clonogenic, migration and invasion assays and in vivo through zebrafish xenografts experiments. The whole transcriptome of RAGE-overexpressing BC cells was screened by high-throughput RNA sequencing. Thereafter, Gene Ontology (GO) and Kyoto Encyclopedia of Genes and Genomes (KEGG) pathway enrichment analyses allowed the prediction of potential functions of differentially expressed genes (DEGs). Flow cytometry, real time-PCR, chromatin immunoprecipitation, immunofluorescence and western blot assays were performed to investigate the molecular network involved in the regulation of a novel RAGE target gene namely EphA3. The clinical significance of EphA3 was explored in the TCGA cohort of patients through the survivALL package, whereas the pro-migratory role of EphA3 signaling was ascertained in both BC cells and cancer-associated fibroblasts (CAFs). Statistical analysis was performed by t-tests.

Results: RNA-seq findings and GSEA analysis revealed that RAGE overexpression leads to a motility-related gene signature in ER-positive BC cells. Accordingly, we found that RAGE-overexpressing BC cells exhibit long filopodia-like membrane protrusions as well as an enhanced dissemination potential, as determined by the diverse experimental assays. Mechanistically, we established for the first time that EphA3 signaling may act as a physical mediator of BC cells and CAFs motility through both homotypic and heterotypic interactions.

Conclusions: Our data demonstrate that RAGE up-regulation leads to migratory ability in ER-positive BC cells. Noteworthy, our findings suggest that EphA3 may be considered as a novel RAGE target gene facilitating BC invasion and scattering from the primary tumor mass. Overall, the current results may provide useful insights for more comprehensive therapeutic approaches in BC, particularly in obese and diabetic patients that are characterized by high RAGE levels.

Keywords: Breast cancer; Cancer-associated fibroblast (CAFs); EphA3; Receptor for advanced glycation end-products (RAGE).


Conflict of interest statement

The authors declare that they have no competing interests.

Figures

Fig.1
Fig.1
Validation of RAGE-overexpressing BC cells. A Kaplan–Meier plot showing the association of RAGE mRNA expression with the progression free interval (PFI) of the TCGA ER-positive BC patients. Samples were divided into RAGE high and low groups using the optimum cut-off. B-C Morphological appearance of wild type (MCF7/wt and T47D/wt) and RAGE-overexpressing (MCF7/RAGE and T47D/RAGE) cells in phase-contrast microscopy; scale bar: 250 μm. Enlarged details are shown in the separate boxes. Flow cytometric histograms in RAGE-overexpressing compared with wild type MCF7 (D) and T47D (E) cells. FITC, fluorescein isothiocyanate. Side panels show the percentage of RAGE-positive cells. F-G Immunoblots of RAGE in wild type (MCF7/wt and T47D/wt) and RAGE-overexpressing (MCF7/RAGE and T47D/RAGE) cells. Side panels show densitometric analysis of the blots normalized to β-actin, which was used as a loading control. Values represent the mean ± SD of three independent experiments performed in triplicate. H-I Evaluation of RAGE protein expression (green signal) by immunofluorescence experiment in wild type (MCF7/wt and T47D/wt) and RAGE-overexpressing (MCF7/RAGE and T47D/RAGE) cells; nuclei were stained by DAPI (blue signal). The images shown represent 10 random fields from three independent experiments. Scale bar: 25 μm. Side panels represent corrected total cell fluorescence (CTCF), which was calculated on at least 10 pictures from each sample. (*) indicates p < 0.05; (**) indicates p < 0.01; (**) indicates p < 0.001
Fig.2
Fig.2
Comprehensive transcriptome analysis by RNA-seq of wild type and RAGE-overexpressing MCF7 cells. A Volcano plot evidencing the differentially expressed genes (DEGs) in RAGE-overexpressing (MCF7/RAGE) respect to wild type (MCF7/wt) MCF7 cells, as ascertained by RNA-seq analysis. p-value < 0.05 was considered as a significant threshold; significantly down-regulated genes (log2FC ≤ 0.5 and p < 0.05) are shown in blue (n = 1340), significantly up-regulated genes (log2FC ≥ 0.5 and p < 0.05) are shown in red (n = 725), non-significant genes are shown in grey (p > 0.05). Side box shows enrichment scores for gene ontology (GO) terms of the up-regulated DEGs in MCF7/RAGE versus MCF7/wt cells, involved in biological process (BP), molecular function (MF), cellular component (CC), according to p < 0.05 and log2FC > 0.5. B Interrelation analysis of “cell–cell adhesion”, “chemotaxis”, “biological adhesion” and “cell adhesion” BP and relative genes. Survival analysis showing the association of high expression of the genes belonging to the “chemotaxis” (C) and “biological adhesion” (D) BP with a worse disease specific survival (DSS) in ER-positive BC patients of the TCGA cohort
Fig.3
Fig.3
Membrane protrusions and motile phenotype in RAGE-overexpressing BC cells. A Scanning electron microscopy (SEM) images of wild type (MCF7/wt) and RAGE-overexpressing (MCF7/RAGE) MCF7 cells; scale bar: 10 μm. B Higher magnification (square in A), scale bar: 3 μm. C SEM images of wild type (T47D/wt) and RAGE-overexpressing (T47D/RAGE) T47D cells; scale bar: 10 μm. D Higher magnification (square in C), scale bar: 2 μm. Transwell migration (EF) and invasion (G-H) assays in wild type and RAGE-overexpressing MCF7 and T47D cells. Cells were counted in at least 5 random fields in three independent experiments performed in triplicate, as quantified in the side panels. Scale bar 200 μm
Fig.4
Fig.4
Growth and dissemination of RAGE-overexpressing BC cells. A-B Colony formation in wild type (MCF7/wt and T47D/wt) and RAGE-overexpressing (MCF7/RAGE and T47D/RAGE) MCF7 and T47D cells. After 10 days of incubation cell colonies were stained and pictures were captured by a digital camera. Colonies were counted using the program WCIF ImageJ for Windows. Each data point is the mean ± SD of three independent experiments performed in triplicate. C,F DiI-labeled wild type (MCF7/wt and T47D/wt) and RAGE-overexpressing (MCF7/RAGE and T47D/RAGE) cells were injected into the yolk sac of 48 hpf larvae, and tumor cell growth and dissemination were detected using fluorescent microscopy at day 3 post-injection. Yellow arrows indicate primary tumors. White arrows indicate disseminated tumor foci. D,G Quantification of DiI-labeled tumor volume (n = 6/group). The mean value of the tumor size in wild type zebrafish xenografts was settled as 100%. E,H Quantification of numbers of disseminated tumor foci (n = 6/group). Data are represented as mean ± SD. (*) indicates p < 0.05
Fig.5
Fig.5
Sp1 is involved in the up-regulation of Epha3 in RAGE-overexpressing BC cells. A mRNA expression of EPHA3 in RAGE-overexpressing (MCF7/RAGE and T47D/RAGE) respect to wild type (MCF7/wt and T47D/wt) cells, as ascertained by real-time PCR. Values are normalized to the actin beta (ACTB) expression and shown as fold changes of mRNA expression in RAGE-overexpressing respect to wild type cells. B-C Immunoblots of EphA3 in wild type (MCF7/wt and T47D/wt) and RAGE-overexpressing (MCF7/RAGE and T47D/RAGE) cells. Side panels show densitometric analysis of the blots normalized to β-actin, which was used as a loading control. D-E Evaluation of EphA3 protein expression (red signal) by immunofluorescence experiment in wild type (MCF7/wt and T47D/wt) and RAGE-overexpressing (MCF7/RAGE and T47D/RAGE) cells; nuclei were stained by DAPI (blue signal). The images shown represent 10 random fields from three independent experiments. Bottom panels represent corrected total cell fluorescence (CTCF), which was calculated on at least 10 pictures from each sample. Scale bar: 25 μm. F Schematic representation of human EPHA3 promoter carrying the Sp1-responsive sites (the transcriptional start site is indicated as + 1). G-H Protein expression of Sp1 in wild type (MCF7/wt and T47D/wt) and RAGE-overexpressing (MCF7/RAGE and T47D/RAGE) cells, as evaluated by immunoblotting. I-J Protein levels of EphA3 in the presence of 100 nM Sp1 inhibitor mithramycin A (MMA) in RAGE-overexpressing (MCF7/RAGE and T47D/RAGE) cells. Side panel shows densitometric analysis of the blots normalized to β-actin. K Recruitment of Sp1 to EphA3 promoter by ChIP assay in wild type (MCF7/wt and T47D/wt) and RAGE-overexpressing (MCF7/RAGE and T47D/RAGE) cells in the presence or absence of 100 nM Sp1 inhibitor mithramycin A (MMA). In control samples nonspecific IgGs were used instead of the primary antibody. The amplified sequences were evaluated by real-time PCR. Values represent the mean ± SD of three independent experiments performed in triplicate. (*) indicates p < 0.05
Fig.6
Fig.6
The EphA3 signaling mediates the motile phenotype of RAGE-overexpressing BC cells and is associated with a worse prognosis in BC patients. Transwell migration (A-B) and invasion (C-D) assays in MCF7/RAGE and T47D/RAGE cells in the presence or absence of EphA3 silencing. Efficacy of EphA3 silencing in MCF7/RAGE (E) and T47D/RAGE (F) cells. Side panel shows densitometric analysis of the blots normalized to β-actin. Transwell migration (G-H) and invasion (I-J) assays in MCF7/RAGE and T47D/RAGE cells in the presence or absence of 10 μM EphA3 inhibitor AWL-II-38.3. Cells were counted in at least 5 random fields in three independent experiments performed in triplicate, as quantified in the side panels. Scale bar: 200 μm. Values represent the mean ± SD of three independent experiments performed in triplicate. (*) indicates p < 0.05
Fig.7
Fig.7
EphA3 expression correlates with poor clinical outcomes and pro-migratory and invasive genes in ER-positive BC patients. A Box plot showing the differential EphA3 expression levels in ER-positive and negative BC patients, as found in the TCGA dataset. B EphA3 mRNA levels according to BC intrinsic molecular subtypes of the TCGA cohort. The number of patients is reported in each panel. Kaplan–Meier plots showing the association of EphA3 expression with the overall survival (OS) (C) and disease specific survival (DSS) (D) of the TCGA ER-positive BC patients. Patients were divided into EphA3 high and low categories using the optimum cut-off. E Kaplan–Meier plot showing the association of EphA3 expression with the OS of ER-positive BC patients characterized by high RAGE expression levels (above the 3Q). Patients were divided into EphA3 high and low categories using the optimum cut-off. KEGG pathway (F) and gene ontology (GO) (G-I) analyses depicting the association of EphA3 expression with pro‐metastatic pathways and GO terms in ER‐positive BC samples of TCGA. The x-axes and the y-axes indicate respectively the -log10 p-value and the different KEGG pathways and GO terms. Lum A, Luminal A; Lum B, Luminal B; ns, not significant; (**) indicates p < 0.01; (***) indicates p < 0.001 and (****) indicates p < 0.0001
Fig.8
Fig.8
EphA3 axis is involved in the evasion of RAGE-overexpressing BC cells and CAFs from Matrigel drops. A Representative phase contrast images from the Matrigel drops evasion assay from co-cultures of MCF7/wt or MCF7/RAGE cells and CAFs in the presence or absence of 10 μM EphA3 inhibitor AWL-II-38.3. B-C Percentage of cells around the drop upon 3 days treatment from three independent experiments performed in triplicate. Yellow arrows indicate CAFs. Purple arrows indicate MCF7/RAGE cells. The dotted line indicates the border of drop; scale bar: 650 μm. (*) indicates p < 0.05; (**) indicates p < 0.01
Fig.9
Fig.9
Cartoon depicting the molecular events and the biological responses triggered by RAGE within the BC microenvironment. Created with BioRender.com

References

    1. Heer E, Harper A, Escandor N, Sung H, McCormack V, Fidler-Benaoudia MM. Global burden and trends in premenopausal and postmenopausal breast cancer: a population-based study. Lancet Glob Health. 2020;8:e1027–e1037. doi: 10.1016/S2214-109X(20)30215-1. - DOI - PubMed
    1. Bray F, Ferlay J, Soerjomataram I, Siegel RL, Torre LA, Jemal A. Global cancer statistics 2018: GLOBOCAN estimates of incidence and mortality worldwide for 36 cancers in 185 countries. CA Cancer J Clin. 2018;68:394–424. doi: 10.3322/caac.21492. - DOI - PubMed
    1. Gallagher EJ, LeRoith D. Obesity and Diabetes: The Increased Risk of Cancer and Cancer-Related Mortality. Physiol Rev. 2015;95:727–748. doi: 10.1152/physrev.00030.2014. - DOI - PMC - PubMed
    1. Kim D-S, Scherer PE. Obesity, Diabetes, and Increased Cancer Progression. Diabetes Metab J. 2021;45:799–812. doi: 10.4093/dmj.2021.0077. - DOI - PMC - PubMed
    1. Kang C, LeRoith D, Gallagher EJ. Diabetes, Obesity, and Breast Cancer. Endocrinology. 2018;159:3801–3812. doi: 10.1210/en.2018-00574. - DOI - PMC - PubMed

Substances