. 2023 Aug 23;33(17):9802-9814.
doi: 10.1093/cercor/bhad245.

Temporal fingerprints of cortical gyrification in marmosets and humans

Affiliations

Temporal fingerprints of cortical gyrification in marmosets and humans

Qiyu Wang et al. Cereb Cortex. .

Abstract

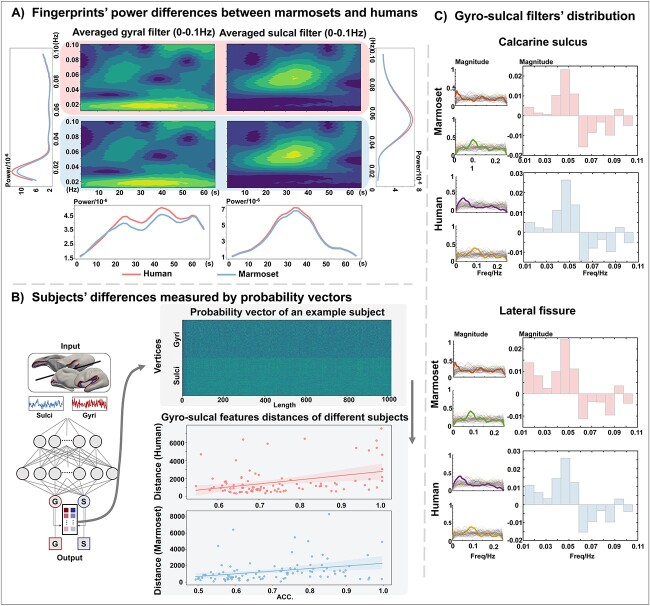
Recent neuroimaging studies in humans have reported distinct temporal dynamics of gyri and sulci, which may be associated with putative functions of cortical gyrification. However, the complex folding patterns of the human cortex make it difficult to explain temporal patterns of gyrification. In this study, we used the common marmoset as a simplified model to examine the temporal characteristics and compare them with the complex gyrification of humans. Using a brain-inspired deep neural network, we obtained reliable temporal-frequency fingerprints of gyri and sulci from the awake rs-fMRI data of marmosets and humans. Notably, the temporal fingerprints of one region successfully classified the gyrus/sulcus of another region in both marmosets and humans. Additionally, the temporal-frequency fingerprints were remarkably similar in both species. We then analyzed the resulting fingerprints in several domains and adopted the Wavelet Transform Coherence approach to characterize the gyro-sulcal coupling patterns. In both humans and marmosets, sulci exhibited higher frequency bands than gyri, and the two were temporally coupled within the same range of phase angles. This study supports the notion that gyri and sulci possess unique and evolutionarily conserved features that are consistent across functional areas, and advances our understanding of the functional role of cortical gyrification.

Keywords: Marmoset; convolutional neural network; cortical folding; functional connectivity; resting-state fMRI.


Conflict of interest statement

None declared.

Figures

Fig. 1
Fig. 1
Overview of our study for extracting and characterizing temporal fingerprints of gyri and sulci. (A) Extraction of gyral and sulcal skeletons and their regions. Left: the gyral and sulcal skeleton of the lateral fissure (top) and the calcarine sulcus (bottom) of humans and marmosets, respectively. Right: Gyral regions and sulcal regions that are defined as adjacent vertices with a Euclidean distance of 3 to the skeleton. (B) The resting-state fMRI timeseries from gyral/sulcal regions are fed into ptFCN to extract their temporal features. The ptFCN consists of three convolutional layers (represented as series filters) and generates probability vectors representing the likelihood that each filter belongs to the category of gyri or sulci. Based on these probability vectors, these convolutional filters are defined as gyral and sulcal temporal fingerprints. The probability vector corresponding to the selected representative features is marked in the box. Dropout layers, shown with dashed lines, act as regulators to avoid overfitting. (C) the resultant temporal fingerprints are transformed into a complex plane (by Hilbert transform) and time-frequency domain (by wavelet transform). (D) The correlation and coherence of gyral and sulcal fingerprints are analyzed and compared cross-species in different domains.
Fig. 2
Fig. 2
Evaluation of gyro-sulcal classification performance in marmosets (blue) and humans (red). (A) Cross-regional classification. Neural networks are trained on the calcarine-sulcus area or lateral-fissure area, and then tested on the other regions, respectively (left panel). Training (gray) and testing accuracies of marmosets (blue) and humans (red) are shown in the right panel. ACC: accuracy. (B) Gyral and sulcal temporal-frequency fingerprints transformed from the prediction convolutional filters of ptFCN by wavelet transform. Fingerprints of the calcarine sulcus are shown here, and those of the lateral fissure are shown in Supplementary Fig. 1(A). Gyri and sulci exhibit distinct temporal features, and the temporal-frequency fingerprints are similar across species. (C) Classification results after applying the trained ptFCN on whole brain gyral and sulcal data of humans. The left panel shows the test results of the ptFCN trained on calcarine sulcus. The right panel shows the test results of the ptFCN trained on lateral fissure.
Fig. 3
Fig. 3
Cross-species comparison of temporal fingerprints and inter-subject variability. (A) Cross-species comparison of temporal fingerprints. To measure the differences between humans (red line) and marmosets (blue line), we calculated the wavelet power of the filters (temporal fingerprints) in frequency and time space. Humans and marmosets have similar power magnitude distributions, but the magnitude of humans is higher than that of marmosets. Fingerprints of the calcarine sulcus are shown here, and those of the lateral fissure are shown in Supplementary Fig. 1(B). The vertical plots show the average wavelet power over all time points, and the horizontal plots show the average wavelet power over all frequency bands. (B) Inter-subjects’ variability measured by probability vectors. We measured inter-subject variability by calculating the distance between the probability vectors of gyri and sulci (left panel). The top row of the right panel visualizes the probability vectors of each input vertex. The distances between the gyral and sulcal vectors were calculated using dynamic time wrapping. The regression of the distances and the classification accuracy of different subjects are plotted in the bottom panel. The magnitude of the distance indicates the differences in gyral and sulcal probability vectors: The longer the distance, the higher the classification accuracy. (C) The detailed gyral and sulcal filters of a randomly selected subject. In each panel, the left column shows the frequency distribution of all gyral (the upper plot) or sulcal (the lower plot) filters, the right column shows the histogram differences between gyral and sulcal filters. The magnitude of histogram higher than zero indicates gyral filters distributed more in this frequency band compare to sulcal filters. The magnitude of histogram lower than zero indicates sulcal filters distributed more in this frequency band compare to gyral filters.
Fig. 4
Fig. 4
Evaluation of the gyro-sulcal coupling in time, frequency, and phase domains. (A) Within-regional gyro-sulcal relationship. Dynamic correlation coefficient (top row), frequency coherence magnitude (second row), and phase coherence (third row) of extracted gyral and sulcal temporal fingerprints for the calcarine sulcus (left) and the lateral fissure (right), respectively. Dynamic correlation coefficients are calculated using a sliding-window method, frequency coherences using Welch’s method, and phase coherences using the Hilbert transformation. The X-axis shows the frequency band or time points, and the Y-axis shows the magnitude of coherence or the correlation coefficients. The dots represent the correlation/coherence magnitude of different subjects, and the line represents the average magnitude of different subjects. Red lines and dots represent human data, and blue represents marmoset data. The bottom row shows the phase lag angles distribution of gyro-sulcal coupling. (B) Cross-regional relationship. The coupling patterns between the gyri (top row) or the sulci (bottom row) of the calcarine sulcus (left) and the lateral fissure (right) are displayed, respectively.
Fig. 5
Fig. 5
Evaluation of the gyro-sulcal coupling by WTC. (A) The procedure for calculating WTC involves wavelet transforming gyral and sulcal fingerprints to obtain wavelet transform coherence (WTC; formula image). (B) Gyro-sulcal wavelet coherence maps of the calcarine sulcus are shown for marmosets (left) and humans (right), and those of the lateral fissure are shown in Supplementary Fig. 5. For each WTC map, the color scale represents the magnitude of coherence, and arrows indicate phase angles in the time-frequency plane. A rightward-pointing arrow indicates in-phase or positive correlation (formula image), a leftward-pointing arrow indicates anti-correlation (formula image), and the downward- and upward-pointing arrows indicate phase-lag angles of formula image and formula image, respectively. Data outside the “cone of influence” (COI) are removed because they may be susceptible to edge effects and thus less accurate during wavelet transformation. (C) Inter-regional gyral/sulcal wavelet coherence maps of marmosets and humans. Gyral/sulcal coherence maps between different regions are displayed. The first two rows show gyral coherence and sulcal coherence between the calcarine sulcus (CS) and lateral fissure (LF) of marmosets, respectively. The bottom two rows show gyral coherence and sulcal coherence between CS and LF of humans, respectively.

Similar articles

Cited by

References

    1. Barch DM, Burgess GC, Harms MP, Petersen SE, Schlaggar BL, Corbetta M, Glasser MF, Curtiss S, Dixit S, Feldt C, et al. Function in the human connectome: task-FMRI and individual differences in behavior. NeuroImage. 2013:80(October):169–189. - PMC - PubMed
    1. Barkovich AJ, Guerrini R, Kuzniecky RI, Jackson GD, Dobyns WB. A developmental and genetic classification for malformations of cortical development: update 2012. Brain. 2012:135(Pt 5):1348–1369. - PMC - PubMed
    1. Beauchamp A, Yee Y, Darwin BC, Raznahan A, Mars RB, Lerch JP. Whole-brain comparison of rodent and human brains using spatial transcriptomics. Edited by Alex Fornito, Kate M Wassum, and Bratislav Misic. Elife. 2022:11(November):e79418. - PMC - PubMed
    1. Belloy ME, Naeyaert M, Abbas A, Shah D, Vanreusel V, van Audekerke, Keilholz SD, Keliris GA, Van der Linden, Verhoye M. Dynamic resting state FMRI analysis in mice reveals a set of quasi-periodic patterns and illustrates their relationship with the global signal. NeuroImage Brain Connect Dyn. 2018:180(October):463–484. - PMC - PubMed
    1. Bolt T, Nomi JS, Bzdok D, Salas JA, Catie Chang BT, Yeo T, Uddin LQ, Keilholz SD. A parsimonious description of global functional brain organization in three spatiotemporal patterns. Nat Neurosci. 2022:25(8):1093–1103. - PubMed

Publication types

LinkOut - more resources