. 2023 Jul 12;290(2002):20230981.
doi: 10.1098/rspb.2023.0981. Epub 2023 Jul 12.

Blind fish have cells that see light

Affiliations

Blind fish have cells that see light

Inga A Frøland Steindal et al. Proc Biol Sci. .

Abstract

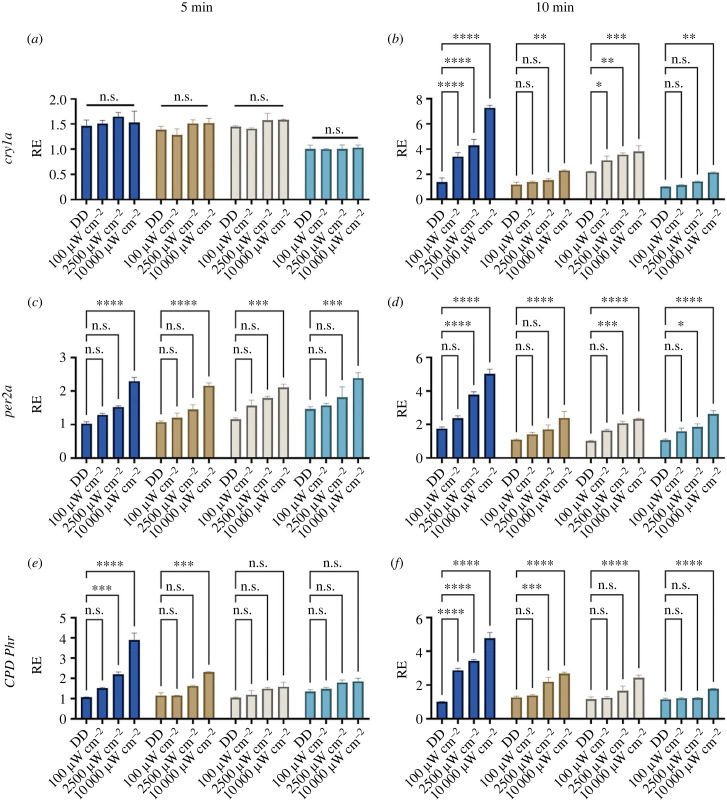
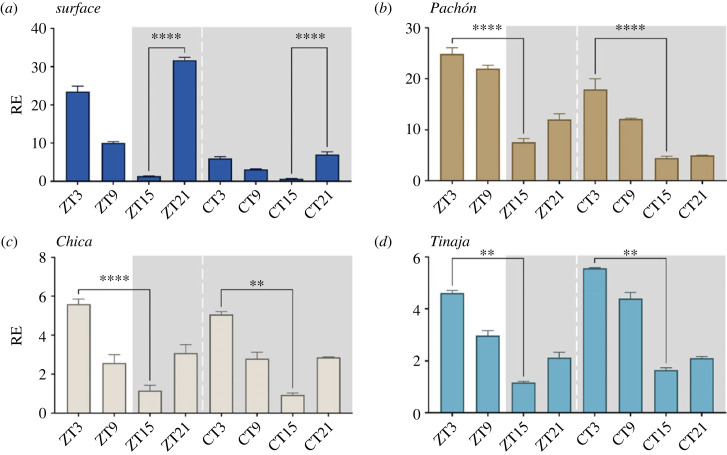
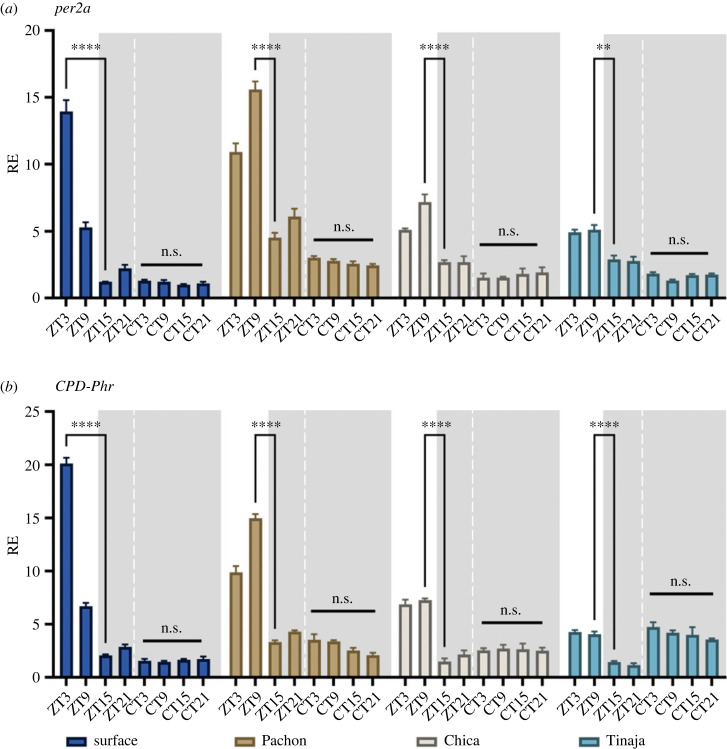
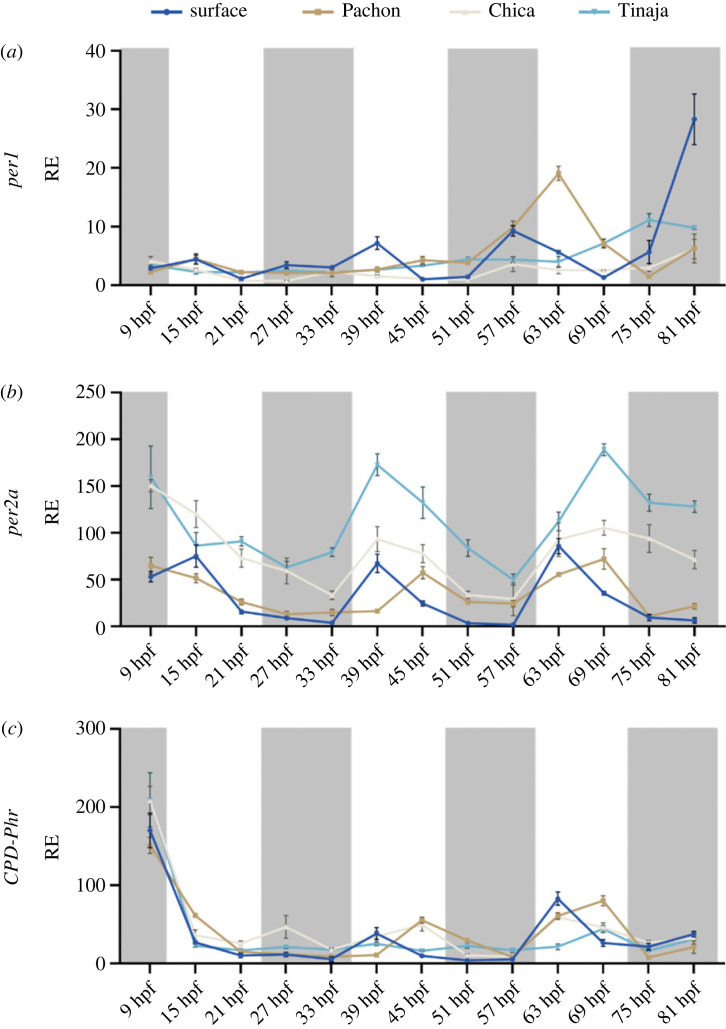
Most animals on earth have evolved under daily light-dark cycles and consequently possess a circadian clock which regulates much of their biology, from cellular processes to behaviour. There are however some animals that have invaded dark ecosystems and have adapted to an apparently arrhythmic environment. One such example is the Mexican blind cavefish Astyanax mexicanus, a species complex with over 30 different isolated cave types, including the founding surface river fish. These cavefish have evolved numerous fascinating adaptations to the dark, such as loss of eyes, reduced sleep phenotype and alterations in their clock and light biology. While cavefish are an excellent model for studying circadian adaptations to the dark, their rarity and long generational time makes many studies challenging. To overcome these limitations, we established embryonic cell cultures from cavefish strains and assessed their potential as tools for circadian and light experiments. Here, we show that despite originating from animals with no eyes, cavefish cells in culture are directly light responsive and show an endogenous circadian rhythm, albeit that light sensitivity is relatively reduced in cave strain cells. Expression patterns are similar to adult fish, making these cavefish cell lines a useful tool for further circadian and molecular studies.

Keywords: Astyanax mexicanus; biological clock; cavefish; cell culture; circadian; light biology.


Conflict of interest statement

We declare we have no competing interests.

Figures

Figure 1.
Figure 1.
Induction of light-inducible genes in cavefish cell lines. Cell lines were subjected to the light of three different intensities as well as a non-light pulsed dark control for 5 min and 10 min. The different colours denote the different cell culture from the different cave populations; dark blue = surface, brown = Pachón, beige = Chica, teal = Tinaja. RE of genes was determined by RT-qPCR for (a) 5 min cry1a, (b) 10 min cry1a, (c) 5 min per2a, (d) 10 min per2a, (e) 5 min CPD-Ph and (f) 10 min CPD-Ph. RE is plotted against lowest expressed gene across strains. Normalized against housekeeping gene RLP-13α. A two-way ANOVA with a Tukey post-test was used to determine significance (n = 3–4). **** = p < 0.0001, *** = p < 0.001, ** = p < 0.01, * = p < 0.05, n.s. = not significant.
Figure 2.
Figure 2.
per1 rhythmic expression in cavefish cell lines. Cell lines were sampled every 6 h on a light–dark cycle and then subsequently on a free-running cycle. Light area represents the day, while dark grey area represents the dark (12 : 12 LD cycle). ZT = zeitgeber. The different colours denote the different cell culture from the different cave populations; dark blue = surface, brown = Pachón, beige = Chica, teal = Tinaja. RE of per1 was determined by RT-qPCR (a) surface cells, (b) Pachón, (c) Chica and (d) Tinaja. RE is plotted against lowest expressed timepoint across all strains. A two-way ANOVA with a Tukey post-test was used to determine the significance between peaks and troughs (n = 3–4). **** = p < 0.0001, *** = p < 0.001, ** = p < 0.01. Normalized against housekeeping gene RLP-13α. RAIN, a non-parametric rhythmicity test [40] was used to determine significance and period length in dataset electronic supplementary material, file S1.
Figure 3.
Figure 3.
per2a and CPD-Phr expression in cavefish cell lines in LD and DD. Cell lines were sampled every 6 h on a light–dark cycle and then subsequently on a free-running cycle. Light area represents the day, while dark grey area represents the dark (12 : 12 LD cycle). ZT = zeitgeber. The different colours denote the different cell culture from the different cave populations; dark blue = surface, brown = Pachón, beige = Chica, teal = Tinaja. RE was determined by RT-qPCR (a) per2a and (b) CPD-Phr. RE is plotted against lowest expressed gene. Normalized against housekeeping gene RLP-13α. A two-way ANOVA with a Tukey post-test was used to determine significance between peaks and troughs (n = 3–4). **** = p < 0.0001, ** = p < 0.01, n.s. = not significant.
Figure 4.
Figure 4.
Early embryonic expression of key clock genes in developing cavefish embryos on a light:dark cycle. Developing embryos were sampled from 9 hpf every 6 h on a light–dark cycle until 81 hpf. Light area represents the day, while dark grey area represents the dark (12 : 12 LD cycle). The different colours denote the different cell culture from the different cave populations; dark blue = surface, brown = Pachón, beige = Chica, teal = Tinaja. RE was determined by RT-qPCR (a) per1, (b) per2a, (c) CPD-Phr. RE is plotted against lowest expressed gene. Normalized against housekeeping gene RLP-13α. Associated statistics can be found in the electronic supplementary material, file S2. Data on surface and Pachón were published in 2018 [26].
Figure 5.
Figure 5.
Early embryonic expression of key clock genes in developing cavefish embryos in complete darkness. Developing embryos were raised in complete darkness and sampled every 6 h from 9 hpf until 81 hpf. The different colours denote the different cell culture from the different cave populations; dark blue = surface, brown = Pachón, beige = Chica, teal = Tinaja. RE was determined by RT-qPCR (a) per1, (b) per2a and (c) CPD-Phr. Relative expression is plotted against lowest expressed gene. Normalized against housekeeping gene RLP-13α. Associated statistics can be found in the electronic supplementary material, file S2. Data on surface and Pachón were published in 2018 [26].

Similar articles

Cited by

References

    1. King DP, Takahashi JS. 2000. Molecular genetics of circadian rhythms in mammals. Annu. Rev. Neurosci. 23, 713-742. ( 10.1146/ANNUREV.NEURO.23.1.713) - DOI - PubMed
    1. Ishiura M, Kutsuna S, Aoki S, Iwasaki H, Andersson CR, Tanabe A, Golden SS, Johnson CH, Kondo T. 1998. Expression of a gene cluster kaiABC as a circadian feedback process in cyanobacteria. Science (New York, N.Y.) 281, 1519-1523. ( 10.1126/SCIENCE.281.5382.1519) - DOI - PubMed
    1. Johnson CH, Golden SS, Ishiura M, Kondo T. 1996. Circadian clocks in prokaryotes. Mol. Microbiol. 21, 5-11. ( 10.1046/J.1365-2958.1996.00613.X) - DOI - PubMed
    1. Pittendrigh CS. 1993. Temporal organization: reflections of a Darwinian clock-watcher. Annu. Rev. Physiol. 55, 17-54. ( 10.1146/ANNUREV.PH.55.030193.000313) - DOI - PubMed
    1. Frøland Steindal IA, Whitmore D. 2019. Circadian clocks in fish-what have we learned so far? Biology 8, 17. ( 10.3390/biology8010017) - DOI - PMC - PubMed

Publication types

LinkOut - more resources