. 2023 Jun 26:14:1203089.
doi: 10.3389/fpls.2023.1203089. eCollection 2023.

Effect of temperature on betacyanins synthesis and the transcriptome of Suaeda salsa

Affiliations

Effect of temperature on betacyanins synthesis and the transcriptome of Suaeda salsa

Min Li et al. Front Plant Sci. .

Abstract

Introduction: Suaeda salsa (Linn.) Pall. is an important tourist resource and ecological restoration species in coastal wetlands. Environmental factors such as low temperature, darkness, phytohormone, salt stress and seawater flflooding, and light can induce betalain synthesis in S. salsa, which plays an important role in plant adaptation to abiotic stress processes and in shaping the beautiful "red beach" landscape.

Methods: In this study, Illumina sequencing was used to profifile the transcriptome sequence (RNA-Seq) of S. salsa leaves at different temperatures (5° C, 10°C, 15°C, 20°C, 25°C, and 30°C) and to validate differentially expressed genes (DEGs) indicated by real-time PCR (RT-qPCR).

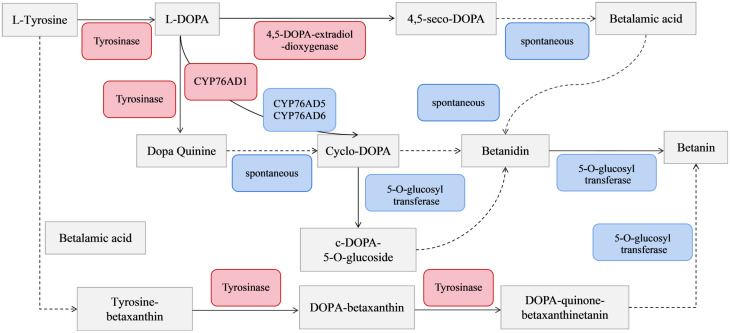
Results: The betacyanin content was highest in S. salsa leaves at 15°C. Transcription group data showed that compared to the control group (15°C), the "betacyanin biosynthesis pathway" was signifificantly enriched in the fifive different temperature groups. KEGG analysis showed that the DEGs were mainly involved in pathways of phenylpropanoid biosynthesis, carbon fifixation in photosynthetic organisms, flflavonoid biosynthesis, and betacyanin biosynthesis. Among the key enzymes involved in biosynthesis of betacyanin, genes for tyrosinase, CYP76AD1 and 4,5-DOPA dioxygenase were signifificantly upregulated and most abundantly expressed at 15°C. It is possible that the gene for betacyanin synthesis from S. salsa is primarily regulated by the MYB1R1 and MYB1 transcription factor. Four DEGs were randomly selected for quantitative PCR analysis, and DEG expression was generally consistent with the RNA-Seq data, verifying the validity of the transcriptome sequencing data.

Discussion: Relative to other temperatures, 15°C was optimum for S. salsa betacyanin synthesis, and this provides a theoretical reference for coastal wetland ecological remediation, reveals mechanisms of S. salsa discoloration, and further mines its potential application for landscape vegetation.

Keywords: Suaeda salsa; betacyanins; coastal wetlands; temperature; transcriptome.


Conflict of interest statement

The authors declare that the research was conducted in the absence of any commercial or financial relationships that could be construed as a potential conflict of interest.

Figures

Figure 1
Figure 1
Differences in betacyanin content in S. salsa leaves under different temperature conditions. Lowercase letters indicate differences between groups under different temperature treatment conditions (P < 0.05). The error bars show std error.
Figure 2
Figure 2
Differentially expressed gene (DEG) analysis. (A) Venn diagram of comparison of DEGs. (B) DEGs in Ss15vsSs30, Ss15vsSs25, Ss15vsSs20, Ss15vsSs10, and Ss15vsSs5. (C) Number of up-regulated and down-regulated genes in five different groups.
Figure 3
Figure 3
Expression of four differentially expressed genes (DEGs) in the transcriptome, verified by qRT-PCR. Fold changes are shown to verify the RNA-seq results. A (A) Genes used for validation from left to right: TRINITY_DN24971_c0_g1, TRINITY_DN1758_c0_g1, TRINITY_DN14253_c0_g1, and TRINITY_DN4658_c0_g1. (B) Linear regression fitting of RNA-seq and qRT-PCR DEGs.
Figure 4
Figure 4
Gene ontology (GO) annotation analysis of DEGs in pairwise comparisons between the control (SS15) and other temperature treatments: (A) SS15vsSS30, (B) SS15vsSS25, (C) SS15vsSS20, (D) SS15vsSS10, and (E) SS15vsSS5. First circle: enriched classification, with a coordinate scale for the number of genes outside the circle. Different colors represent different classifications. Second circle: the number of the classification in the background gene and the Q or P value. The more genes, the longer the bars. The smaller the value, the redder the color. Third circle: bar graph of the proportion of up–down genes, deep purple represents an upregulated gene proportion, light purple represents the proportion of downregulated genes, and specific values are displayed below. Fourth circle: RichFactor values for each category (the number of foreground genes divided by the number of background genes in this classification), and each small grid of the background guides represents 0.1.
Figure 5
Figure 5
Kyoto Encyclopedia of Genes and Genomes (KEGG) enrichment analysis of DEGs in pairwise comparisons between the control (Ss15) and other temperature treatments: (A) Ss15vsSs30, (B) SS15vsSS25, (C) Ss15vsSs20, (D) Ss15vsSs10, and (E) Ss15vsSs5.
Figure 6
Figure 6
KEGG senior network chart of phenylpropanoid, flavonoid, and betalain biosyntheses.
Figure 7
Figure 7
Phylogenetic analysis of betalain biosynthetic pathway DEGs. (A) Predicted: tyrosine decarboxylase 1, Transcript ID: TRINITY_DN25136_c1_g2. (B) 4,5-DOPA dioxygenase extradiol, Transcript ID: TRINITY_DN12121_c0_g1. (C) tyrosine/DOPA decarboxylase 1-like, Transcript ID: TRINITY_DN47998_c0_g1. (D) tyrosinase like protein orsC, Transcript ID : TRINITY_DN36005_c0_g1.
Figure 8
Figure 8
(A) Distribution and abundance distribution of up- and downregulated proteins of S. salsa in Ss15 vs Ss20. Red and blue indicate up- and downregulated differential proteins, respectively, and gray indicates no significant difference in protein. (B) Expression of four key enzyme genes, TYR, DODA, UGTs, and Cyp450s under different temperature conditions.
Figure 9
Figure 9
Betacyanin biosynthesis pathway. Red indicates upregulation of genes; blue indicates spontaneous reactions and genes without significant changes (P < 0.05). Solid lines indicate reactions involving key enzymes process. The dotted line represents the spontaneous reaction process.
Figure 10
Figure 10
Phylogenetic analysis of Cyp450s and UGTs. (A) cyclo-DOPA 5-O-glucosyltransferase, Transcript ID: TRINITY_DN24208_c0_g1. (B) cytochrome P450 76AD1-like protein, Transcript ID: TRINITY_DN2265_c0_g1.

Similar articles

Cited by

References

    1. Abdollahi F., Jahadi M., Ghavami M. (2021). Thermal stability of natural pigments produced by monascus purpureus in submerged fermentation. Food Sci. Nutr. 9 (9), 4855–4862. doi: 10.1002/fsn3.2425 - DOI - PMC - PubMed
    1. Bailey P. C., Martin C., Toledo-Ortiz G., Quail P. H., Huq E., Heim M. A., et al. . (2003). Update on the basic helix-loop-helix transcription factor gene family in arabidopsis thaliana. Plant Cell. 15 (11), 2497–2501. doi: 10.1105/tpc.151140 - DOI - PMC - PubMed
    1. Chen J., Xie F. F., Shah K., Chen C. B., Zeng J. M., Chen J. X., et al. . (2023). Identification of HubHLH family and key role of HubHLH159 in betalain biosynthesis by activating the transcription of HuADH1, HuCYP76AD1-1, and HuDODA1 in pitaya . Plant Sci. 328, 111595. doi: 10.1016/j.plantsci.2023.111595 - DOI - PubMed
    1. Cong M., Lv J., Liu X., Zhao J. M., Wu H. F. (2013). Gene expression responses in Suaeda salsa after cadmium exposure. SpringerPlus 2 (1), 232. doi: 10.1186/2193-1801-2-232 - DOI - PMC - PubMed
    1. Cui M. Z. (2020). Biosynthesis of betacyanins in suaeda salsa under the combined stress of low nitrogen, low phosphorus and high salt and its effect on plant salt tolerance (Lanzhou (CN: Lan Zhou University; ).

LinkOut - more resources