. 2023 Jun 15;26(7):107147.
doi: 10.1016/j.isci.2023.107147. eCollection 2023 Jul 21.

IFITM1 inhibits trophoblast invasion and is induced in placentas associated with IFN-mediated pregnancy diseases

Affiliations

IFITM1 inhibits trophoblast invasion and is induced in placentas associated with IFN-mediated pregnancy diseases

Séverine A Degrelle et al. iScience. .

Abstract

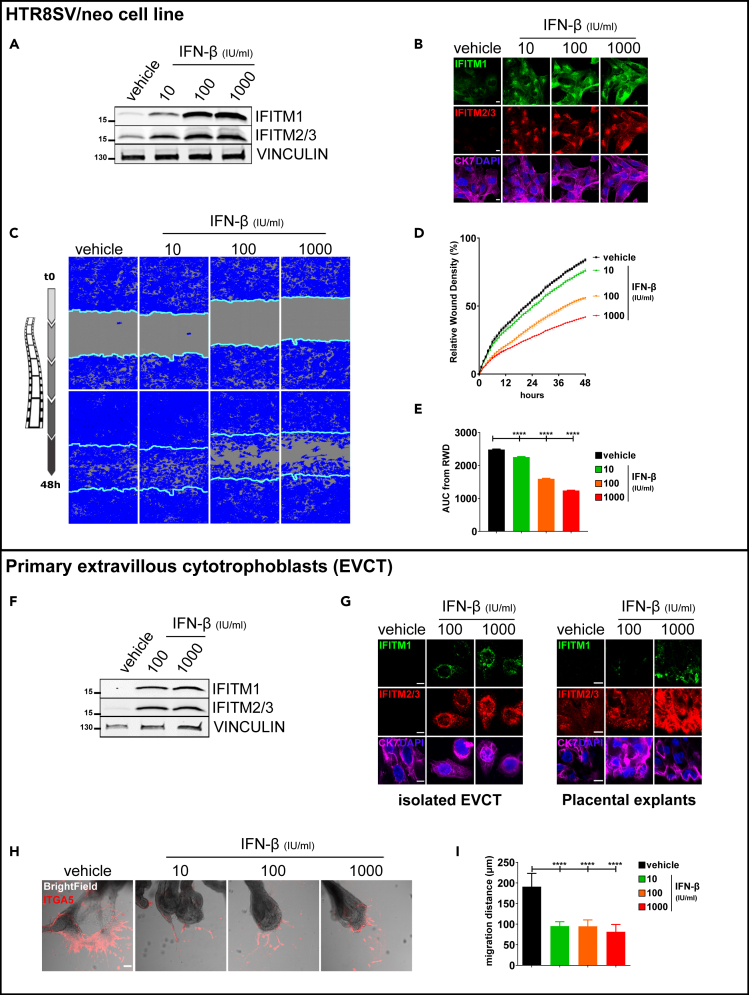
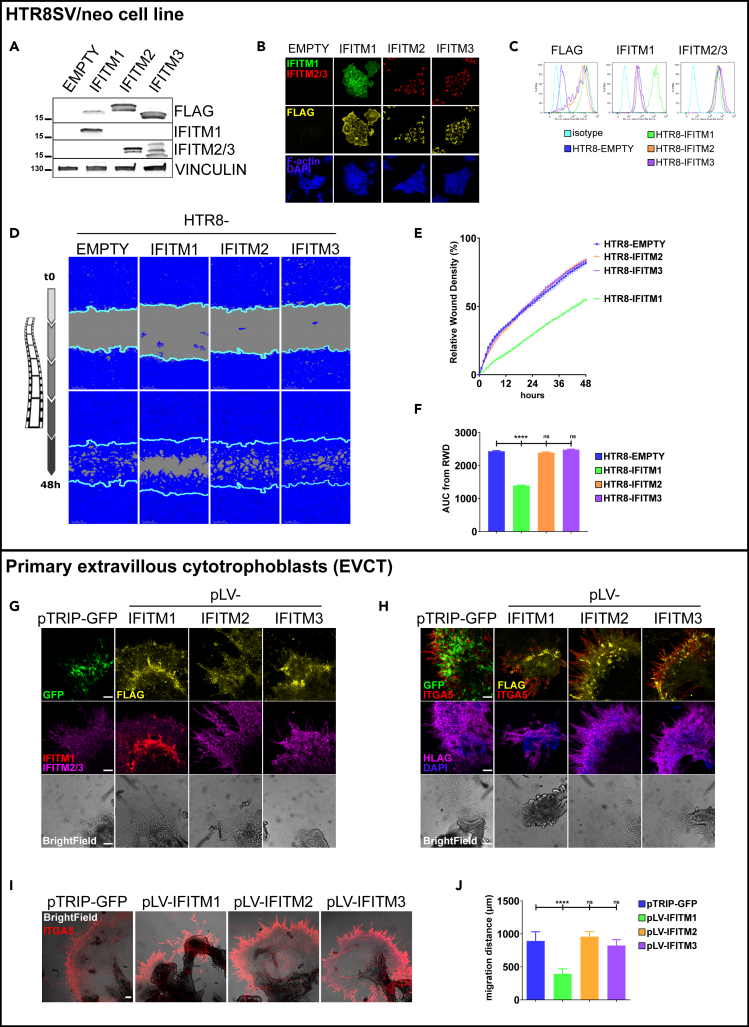
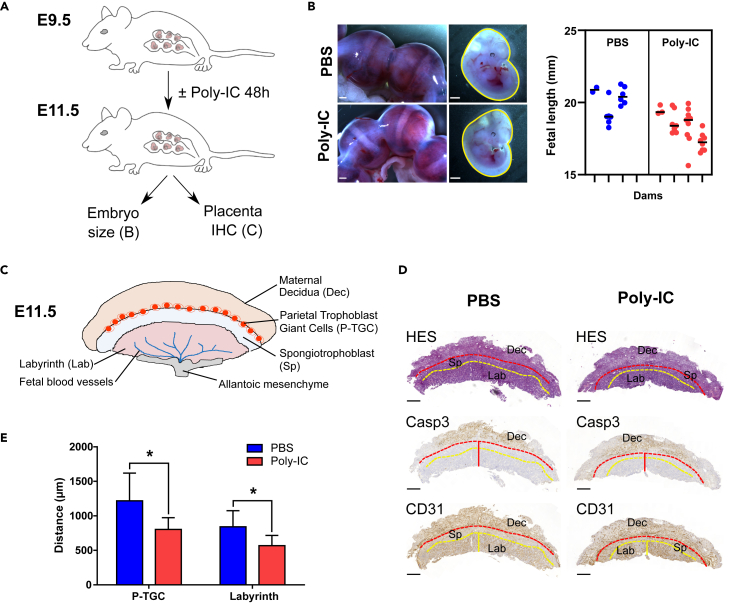
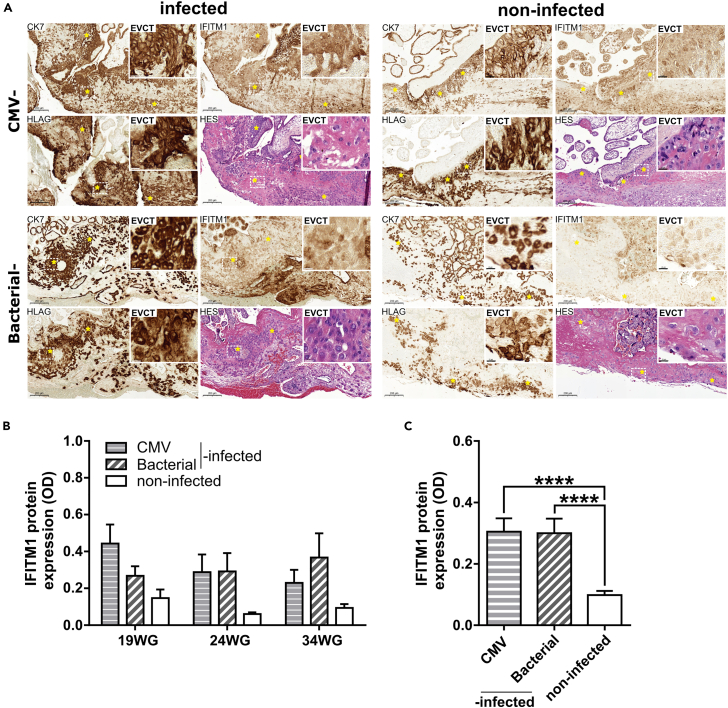
Interferon-induced transmembrane proteins (IFITMs) are restriction factors that block many viruses from entering cells. High levels of type I interferon (IFN) are associated with adverse pregnancy outcomes, and IFITMs have been shown to impair the formation of syncytiotrophoblast. Here, we examine whether IFITMs affect another critical step of placental development, extravillous cytotrophoblast (EVCT) invasion. We conducted experiments using in vitro/ex vivo models of EVCT, mice treated in vivo with the IFN-inducer poly (I:C), and human pathological placental sections. Cells treated with IFN-β demonstrated upregulation of IFITMs and reduced invasive abilities. Transduction experiments confirmed that IFITM1 contributed to the decreased cell invasion. Similarly, migration of trophoblast giant cells, the mouse equivalent of human EVCTs, was significantly reduced in poly (I:C)-treated mice. Finally, analysis of CMV- and bacterial-infected human placentas revealed upregulated IFITM1 expression. These data demonstrate that high levels of IFITM1 impair trophoblast invasion and could explain the placental dysfunctions associated with IFN-mediated disorders.

Keywords: Biological sciences; Cell biology; Virology.


Conflict of interest statement

The authors declare no competing interests.

Figures

None
Graphical abstract
Figure 1
Figure 1
Upregulation of IFITMs in HTR8/SVneo cells following IFN-β treatment was evaluated by western blot and immunofluorescence IFN-β inhibits invasion of HTR8/SVneo cells (A–E) and primary human EVCTs (F–I). HTR8/SVneo cells and EVCTs were incubated for 48 h with IFN-β (10, 100, or 1000 IU/mL). (A) Cell lysates (40 μg) were loaded in 4–15% SDS-PAGE gradient gels and blots were probed for IFITM1, IFITM2/3, and vinculin expression. One representative experiment (out of 3) is shown. (B) Representative image of HTR8/SVneo cells immunostained for cytokeratin 7 (marker of trophoblast, magenta) and IFITM1 (green) or IFITM2/3 (red), and then counterstained with DAPI (blue). Scale bars: 10 μm. Inhibition of HTR8/SVneo cell invasion following IFN-β treatment, quantified using IncuCyte technology (C–E). HTR8/SVneo cells were cultured in a monolayer in 96-well plates. Cells were treated for 48 h, then a wound was made using a 96-well wound maker; this was covered by Matrigel and cells were imaged with Incucyte every 30 min for 48 h. (C) Representative images of HTR8/SVneo cell invasion at 48 h. The blue region denotes the area of the initial wound (light blue line) covered by advancing cells. (D) Time course of wound closure expressed as relative wound density (%). Values are reported as mean ± SEM. (E) Comparison between vehicle and IFN-β-treated cells was performed using an analysis of the area under the curve of the replicates represented in (D). Values are reported as mean + SEM (n = 6 wells/condition, n = 3 experiments). Statistical analysis was performed with one-way ANOVA to compare treatment to vehicle controls. ∗∗∗p < 0.001, ∗∗∗∗p < 0.0001. Upregulation of IFITMs in EVCTs following IFN-β treatment was evaluated by western blot (F) and immunofluorescence (G). (F) Cell lysates (40 μg) from isolated EVCTs were loaded in 4–15% SDS-PAGE gradient gels and blots were probed for IFITM1, IFITM2/3, and vinculin expression. One representative experiment (out of 3) is shown. (G) Representative image of isolated EVCTs and placental explants immunostained for cytokeratin 7 (marker of trophoblast, magenta) and IFITM1 (green) or IFITM2/3 (red), and then counterstained with DAPI (blue). Scale bars: 10 μm. Inhibition of EVCT invasion following IFN-β treatment using villous explant culture model (H–I). (H) Representative image of extravillous explants cultured on Matrigel and immunostained for integrin α5 (ITGA5, marker of invasion, red). Scale bars: 100 μm. (I) Statistical analysis of the invasion distance of ITGA5 + EVCTs, as representatively shown in H. Values are presented as mean + SD (n = 3 explants per condition, n = 3 placentas). One-way ANOVA was performed to compare treatment to vehicle control; ∗∗∗∗p < 0.0001.
Figure 2
Figure 2
Ectopic expression of FLAG and IFITMs in HTR8/SVneo cells transduced with IFITM1–3 was verified by western blot, immunofluorescence, and flow cytometry IFITM1 inhibits invasion of HTR8/SVneo cells (A–E) and primary human EVCTs. (A) Cell lysates (40 μg) were loaded in 4–15% SDS-PAGE gradient gels and blots were probed for IFITM1, IFITM2/3, and vinculin expression. A representative experiment is shown. (B) Representative image of transduced HTR8/SVneo cells immunostained for FLAG (yellow) and IFITM1 (green) or IFITM2/3 (red), and then counterstained with DAPI (blue). Scale bar: 10 μm. (C) HTR8/SVneo cells transduced with a vector containing IFITM1 (green), IFITM2 (orange), IFITM3 (magenta), or a control empty vector (dark blue) were stained with antibodies for IFITM1, IFITM2/3, and FLAG, as well as corresponding isotypes. Cells were then analyzed by flow cytometry. Inhibition of IFITM1-transduced HTR8/SVneo cell invasion, quantified using IncuCyte technology (D–F). HTR8/SVneo cells transduced with IFITM1–3 were cultured in a monolayer in 96-well plates and a wound was made using a 96-well wound maker; this was covered by Matrigel and cells were imaged with Incucyte every 30 min for 48 h. (D) Representative images of transduced HTR8/SVneo cell invasion at 48 h. The blue region denotes the area of the initial wound (light blue line) covered by advancing cells. (E) Time course of wound closure expressed as relative wound density (%). Values are reported as mean ± SEM of the percentage. (F) Comparison between cells transduced with IFITM1–3 and the empty vector was performed using an analysis of the area under the curve of the replicates represented in (E). Values are represented as mean + SEM (n = 6 wells/condition, n = 3 experiments). Statistical analysis was performed with one-way ANOVA to compare treatment to vehicle controls. ∗∗∗p < 0.001, ∗∗∗∗p < 0.0001. Ectopic expression of GFP, FLAG, and IFITMs in EVCT explants transduced with IFITM1–3 was verified by immunofluorescence (G–J). (G) Representative image of placental explants transduced with GFP or IFITM1–3, cultured on Matrigel, and immunostained for FLAG (yellow), GFP (green), and IFITM1 (red) or IFITM2/3 (magenta), and then counterstained with DAPI (blue). Scale bars: 100 μm. (H) Representative image of EVCT explants transduced with GFP or IFITM1–3, cultured on Matrigel, and immunostained for FLAG (yellow), GFP (green), and ITGA5 (red) or HLAG (magenta), and then counterstained with DAPI (blue). Scale bars: 100 μm. Inhibition of IFITM1-transduced EVCT invasion using villous explant culture model (I–J). (I) Representative image of transduced extravillous explants cultured on Matrigel and immunostained for integrin α5 (ITGA5, marker of invasion, red). Scale bars: 100 μm. (J) Statistical analysis of the invasion distance of ITGA5 + EVCTs, as representatively shown in I. Values are presented as mean + SD (n = 3 explants per condition, n = 3 placentas). One-way ANOVA was performed to compare treatment to pTRIP-GFP control; ∗∗∗∗p < 0.0001.
Figure 3
Figure 3
IFN induction inhibits P-TGC invasion and fetal growth in mice (A) Gestating C57BL/6JRj dams mated with C57BL/6JRj males were injected intraperitoneally with 60 μg poly (I:C) or phosphate-buffered saline (PBS) at E9.5. No fetal resorption was observed in the poly (I:C) injection condition. The fetal lengths were assessed at E11.5. (B) Representative images of E11.5 uterus and corresponding fetuses. Scale bars: 1 mm. Right panel corresponds to the measurement of fetal length (mm), performed manually using Image J. Numbers of litters were as follows: PBS n = 3 and poly (I:C) n = 4. Mixed model analysis with dam as subject, and fetuses as repeated measures was performed using a nested t-test. (C) Schematic depiction of the anatomy of the mouse placenta. (D) Representative images of immunohistochemistry of placental sections at E11.5 for CASP3 and CD31 in both PBS and poly (I:C) treatment groups. The red dashed line represents the P-TGC layer at the decidua (Casp3+)/spongiotrophoblast junction area, the red vertical line represents the distance of P-TGC invasion measured from the chorion to the P-TGC layer, the yellow dashed line depicts the labyrinth/spongiotrophoblast junction area, and the yellow vertical line represents the thickness of the labyrinth (CD31+). (E) Measurement of the distance of P-TGC invasion and labyrinth thickness in both PBS (n = 3) and poly (I:C) (n = 4) treatment groups. Values are presented as mean + SD. Unpaired t-test was performed to compare treatment to PBS control; ∗p < 0.05, ∗∗∗∗p < 0.0001.
Figure 4
Figure 4
Induction of IFITM1 expression in placental tissues from IFN-induced pathologies of pregnancy (A) Representative images of CK7, IFITM1, and HLAG immunostaining and HES staining in placental tissues from CMV- and bacterial-infected patients (left panel) and non-infected controls (right panel). Yellow asterisks represent EVCTs (CK7+, HLGA+). Scale bars: 200 μm. The insets depict a higher magnification of EVCT labeling. Scale bar: 20 μm. (B) Quantification of IFITM1 protein expression in EVCTs from CMV- and bacterial-infected and non-infected control pregnancies at three different weeks of gestation (19, 24, and 34 WG, n = 1 per condition, 25 non-overlapping ROIs per placenta). (C) Statistical analyses of IFITM1 protein expression of data shown in B combined by all gestational ages per (n = 3 placentas (19, 24, and 34 WG) per condition (CMV- or bacterial-infected and non-infected), 75 non-overlapping ROIs per condition). Values are presented as mean + SD. One-way ANOVA was performed to compare infected to non-infected controls; ∗∗∗∗p < 0.0001.

Similar articles

Cited by

References

    1. Pijnenborg R., Dixon G., Robertson W.B., Brosens I. Trophoblastic invasion of human decidua from 8 to 18 weeks of pregnancy. Placenta. 1980;1:3–19. doi: 10.1016/s0143-4004(80)80012-9. - DOI - PubMed
    1. Warner J.A., Zwezdaryk K.J., Day B., Sullivan D.E., Pridjian G., Morris C.A. Human cytomegalovirus infection inhibits CXCL12- mediated migration and invasion of human extravillous cytotrophoblasts. Virol. J. 2012;9:255. doi: 10.1186/1743-422X-9-255. - DOI - PMC - PubMed
    1. Coyne C.B., Lazear H.M. Zika virus - reigniting the TORCH. Nat. Rev. Microbiol. 2016;14:707–715. doi: 10.1038/nrmicro.2016.125. - DOI - PubMed
    1. Lau S.Y., Guild S.J., Barrett C.J., Chen Q., McCowan L., Jordan V., Chamley L.W. Tumor necrosis factor-alpha, interleukin-6, and interleukin-10 levels are altered in preeclampsia: a systematic review and meta-analysis. Am. J. Reprod. Immunol. 2013;70:412–427. doi: 10.1111/aji.12138. - DOI - PubMed
    1. Sharma K., Singh R., Kumar M., Gupta U., Rohil V., Bhattacharjee J. First-Trimester Inflammatory Markers for Risk Evaluation of Pregnancy Hypertension. J. Obstet. Gynaecol. India. 2018;68:27–32. doi: 10.1007/s13224-017-0988-1. - DOI - PMC - PubMed

LinkOut - more resources