

Associations between hearing loss and clinical outcomes: population-based cohort study
- PMID: 37434743
- PMCID: PMC10331811
- DOI: 10.1016/j.eclinm.2023.102068
Associations between hearing loss and clinical outcomes: population-based cohort study
Abstract
Background: Hearing loss (HL) is a leading cause of disability worldwide, but its clinical consequences and population burden have been incompletely studied.
Methods: We did a retrospective population-based cohort study of 4,724,646 adults residing in Alberta between April 1, 2004 and March 31, 2019, of whom 152,766 (3.2%) had HL identified using administrative health data. We used administrative data to identify comorbidity and clinical outcomes, including death, myocardial infarction, stroke/transient ischemic attack, depression, dementia, placement in long-term care (LTC), hospitalization, emergency visits, pressure ulcers, adverse drug events and falls. We used Weibull survival models (binary outcomes) and negative binomial models (rate outcomes) to compare the likelihood of outcomes in those with vs without HL. We calculated population-attributable fractions to estimate the number of binary outcomes associated with HL.
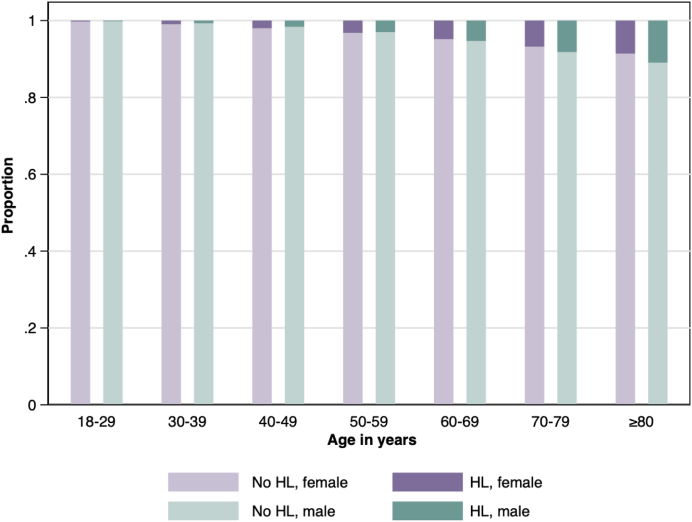
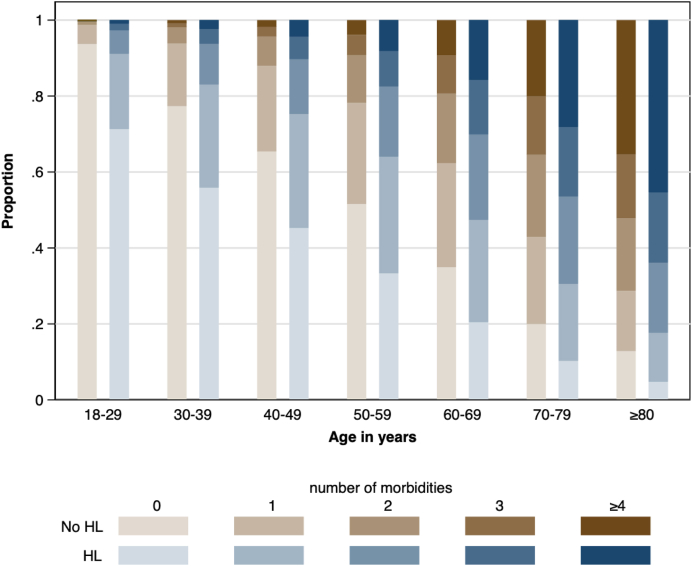
Findings: The age-sex-standardized prevalence of all 31 comorbidities at baseline was higher among participants with HL than those without. Over median follow-up of 14.4 y and after adjustment for potential confounders at baseline, participants with HL had higher rates of days in hospital (rate ratio 1.65, 95% CI 1.39, 1.97), falls (RR 1.72, 95% CI 1.59, 1.86), adverse drug events (RR 1.40, 95% CI 1.35, 1.45), and emergency visits (RR 1.21, 95% CI 1.14, 1.28) compared to those without, and higher adjusted hazards of death, myocardial infarction, stroke/transient ischemic attack, depression, heart failure, dementia, pressure ulcers and LTC placement. The estimated number of people with HL who required new LTC placement annually in Canada was 15,631, of which 1023 were attributable to HL. Corresponding estimates for new dementia among people with HL were 14,959 and 4350, and for stroke/TIA the estimates were 11,582 and 2242.
Interpretation: HL is common, is often accompanied by substantial comorbidity, and is associated with significant increases in risk for a broad range of adverse clinical outcomes, some of which are potentially preventable. This high population health burden suggests that increased and coordinated investment is needed to improve the care of people with HL.
Funding: Canadian Institutes of Health Research; David Freeze chair in health services research.
Keywords: Epidemiology; Hearing loss.
© 2023 The Author(s).
Conflict of interest statement
TH is a (non-paid) board director for the Canadian Academy of Audiology. SWK is a director of the Real World Evidence Consortium, and the Alberta Drug and Therapeutic Evaluation Consortium (Universities of Alberta, Calgary, and Institute of Health Economics); these entities receive funding from decision makers and industry to conduct research. All research funding is made to the academic institution; investigator retains full rights of academic freedom and right to publish. This relationship is not related to the current work. Otherwise there were no potential conflicts of interest to declare.
Figures
References
-
- Mick P.T., Hamalainen A., Kolisang L., et al. The prevalence of hearing, vision, and dual sensory loss in older Canadians: an analysis of data from the Canadian longitudinal study on aging. Can J Aging. 2021;40(1):1–22. - PubMed
-
- World Health Organization . WHO; Geneva: 2021. World report on hearing.
-
- Feng X., Li W., Cheng M., et al. Association of hearing loss with total and cause-specific mortality in US adults. Environ Sci Pollut Res Int. 2022;29(4):5032–5042. - PubMed
LinkOut - more resources
Full Text Sources
Miscellaneous
