

A new nomogram for the individualized prediction of children's mortality risk in pediatric intensive care unit
- PMID: 37434832
- PMCID: PMC10331687
A new nomogram for the individualized prediction of children's mortality risk in pediatric intensive care unit
Abstract
Objective: We developed a new nomogram for the prediction of mortality risk in children in pediatric intensive care units (PICU).
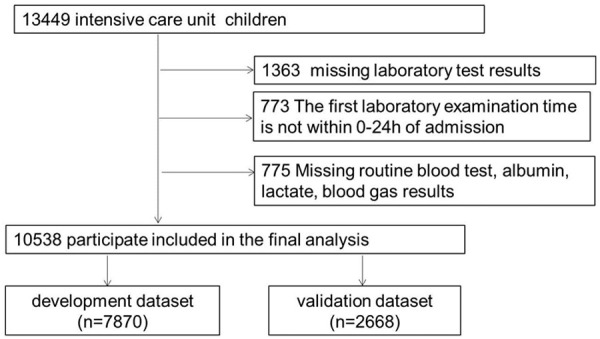
Methods: We conducted a retrospective analysis using the PICU Public Database, a study that included a total of 10,538 children, to develop a new risk model for mortality in children in the intensive care units (ICU). The prediction model was analyzed using multivariate logistic regression with predictors including age and physiological indicators, and the prediction model was presented as a nomogram. The performance of the nomogram was evaluated based on its discriminative power and was internally validated.
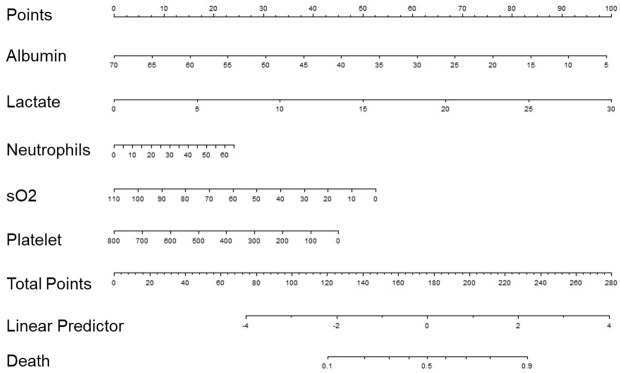
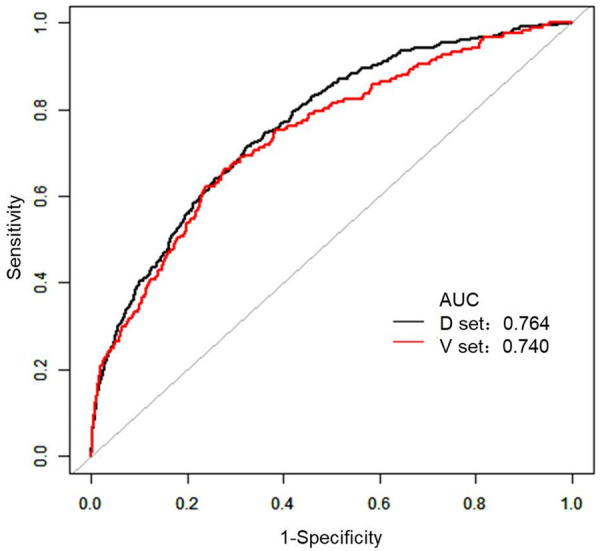
Results: Predictors contained in the individualized prediction nomogram included the neutrophils, platelets, albumin, lactate, oxygen saturation (P<0.1). The area under the receiver operating characteristic (ROC) curve for this prediction model is 0.7638 (95% CI: 0.7415-0.7861), which has effective discriminatory power. The area under the ROC curve of the prediction model in the validation dataset is 0.7404 (95% CI: 0.7016-0.7793), which is still effectively discriminative.
Conclusion: The mortality risk prediction model constructed in this study can be easily used for individualized prediction of mortality risk in children in pediatric intensive care units.
Keywords: Pediatric ICU; mortality; nomogram; prediction.
AJTR Copyright © 2023.
Conflict of interest statement
None.
Figures
References
-
- Pollack MM, Patel KM, Ruttimann UE. PRISM III: an updated pediatric risk of mortality score. Crit Care Med. 1996;24:743–752. - PubMed
-
- Straney L, Clements A, Parslow RC, Pearson G, Shann F, Alexander J, Slater A ANZICS Paediatric Study Group and the Paediatric Intensive Care Audit Network. Paediatric index of mortality 3: an updated model for predicting mortality in pediatric intensive care*. Pediatr Crit Care Med. 2013;14:673–81. - PubMed
-
- Zhang L, Huang H, Cheng Y, Xu L, Huang X, Pei Y, Tang W, Qin Z. Predictive value of four pediatric scores of critical illness and mortality on evaluating mortality risk in pediatric critical patients. Zhonghua Wei Zhong Bing Ji Jiu Yi Xue. 2018;30:51–56. - PubMed
-
- Teres D, Lemeshow S. Why severity models should be used with caution. Crit Care Clin. 1994;10:93–110. - PubMed
LinkOut - more resources
Full Text Sources