. 2023 Jun 26:4:1165340.
doi: 10.3389/fpain.2023.1165340. eCollection 2023.

Pain sensitivity differs between dog breeds but not in the way veterinarians believe

Affiliations

Pain sensitivity differs between dog breeds but not in the way veterinarians believe

Rachel M P Caddiell et al. Front Pain Res (Lausanne). .

Abstract

Background: Veterinarians hold distinct breed-specific pain sensitivity beliefs that differ from the general public but are highly consistent with one another. This is remarkable as there is no current scientific evidence for biological differences in pain sensitivity across dog breeds. Therefore, the present study evaluated whether pain sensitivity thresholds differ across a set of dog breeds and, if so, whether veterinarians' pain sensitivity ratings explain these differences or whether these ratings are attributed to behavioral characteristics.

Methods: Pain sensitivity thresholds [using quantitative sensory testing (QST) methods] and canine behaviors (using owner questionnaires and emotional reactivity tests) were prospectively measured across selected dog breeds. Adult, healthy dogs from 10 dog breeds/breed types were recruited, representing breeds subjectively rated by veterinarians as high (chihuahua, German shepherd, Maltese, Siberian husky), average (border collie, Boston terrier, Jack Russell terrier), or low (golden retriever, pitbull, Labrador retriever) pain sensitivity. A final sample of 149 dogs was included in statistical analyses.

Results: Veterinarians' pain sensitivity ratings provided a minimal explanation for pain sensitivity thresholds measured using QST in dogs; however, dog breeds did differ in their pain sensitivity thresholds across the QST methods evaluated. Breed differences were observed for some aspects of emotional reactivity tests; however, these behavioral differences did not explain the differences in pain sensitivity thresholds found. Veterinarians' pain sensitivity ratings were positively associated with dog approach scores for the disgruntled stranger test suggesting that the way dogs greet strangers may be a factor influencing veterinarians' ratings of pain sensitivity across dog breeds.

Conclusions and clinical relevance: Overall, these findings highlight a need to investigate biological mechanisms that may explain breed differences in pain sensitivity because this may inform pain management recommendations. Further, future research should focus on when and how these breed-specific pain sensitivity beliefs developed in veterinarians, as veterinarians' beliefs could impact the recognition and treatment of pain for canine patients.

Keywords: affective states; animal welfare; attitudes; canine behavior; healthcare provider beliefs; perceptions of patient pain; quantitative sensory testing; stereotypes.


Conflict of interest statement

The authors declare that the research was conducted in the absence of any commercial or financial relationships that could be construed as a potential conflict of interest.

Figures

Figure 1
Figure 1
Ten dog breeds/breed types selected for study inclusion. (A) Findings from Gruen et al. (1) demonstrating the average pain sensitivity ratings by both veterinarians and general public members for the ten dog breeds selected. The scale ranged from 0 = not at all sensitive to 100 = most sensitive imaginable. In Gruen et al. (1), median pain sensitivity ratings between veterinarians and the general public were compared using two-sample t-tests, and p-values = 0.001 are indicated using asterisks (*). (B) Visual representation of the ten dog breeds/breed types selected based on the classification of pain sensitivity ratings by veterinarians. Height is demonstrated for each breed, as consideration was provided to include dog breeds/breed types of varying sizes.
Figure 2
Figure 2
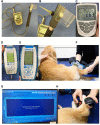
Quantitative sensory testing methods used (27). (A–C) EVF device: (A) EVF device set up displaying the von Frey tip with the cord affixed to the recording device, (B) close-up of the 0.9-mm von Frey tip applicator used, and (C) close-up of the recording device that demonstrates the current force (center), the maximum force applied (upper left), and the unit force measured (upper right). (D–F) PA device: (D) PA device setup displaying the blunt probe affixed to the recording device, (E) close-up of the recording device displaying the maximum force applied (center) and the unit force measured (top), and (F) application of the blunt probed PA to the metatarsus of the dog demonstrating the researcher's technique of applying the tip perpendicular to the dog's skin. (G, H) Thermal device including the thermosensory analyzer connected to the laptop and the thermode: (G) laptop screen displayed when the thermosensory analyzer is ready to start a new test and (H) application of the thermal probe to the metatarsus of the dog. The researcher uses a stopwatch to record the latency for the dog to display a behavioral response within one-hundredth of a second. EVFG, electronic von Frey; PA, pressure algometer.
Figure 3
Figure 3
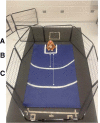
Exercise pen setup for the novel object task. Markings on the yoga mat were used to indicate where the novel object was set by the experimenter and different distances from the novel object that were used to assist observers with behavioral data coding from video recordings. (A) Square markings (33 cm × 33 cm) where the novel object was set by the experimenter. (B) Arced line indicating a distance of 50 cm from the novel object. (C) Arced line indicating a distance of 100 cm from the novel object.
Figure 4
Figure 4
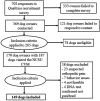
Visual representation of recruitment efforts resulting in the final sample retained.
Figure 5
Figure 5
Dog breed/breed type comparisons for dog pain sensitivity thresholds for the electronic von Frey method using pairwise t-tests. Benjamini–Yekutieli corrections were used to account for multiple comparisons. The mean and SD values are displayed for each breed/breed type. The more grams of force the breed/breed type tolerated would indicate dogs with a higher pain sensitivity threshold or dogs who are less sensitive to pain, on average. The fewer grams of force the breed/breed type tolerated would indicate dogs with a lower pain sensitivity threshold or dogs who are more sensitive to pain, on average. Differing letters denote statistical differences between breeds at an adjusted p < 0.05.
Figure 6
Figure 6
Dog breed/breed type comparisons for dog pain sensitivity thresholds for the pressure algometer method using pairwise t-tests. Benjamini–Yekutieli corrections were used to account for multiple comparisons. The mean and SD values are displayed for each breed/breed type. The more grams of force the breed/breed type tolerated would indicate dogs with a higher pain sensitivity threshold or dogs who are less sensitive to pain, on average. The fewer grams of force the breed/breed type tolerated would indicate dogs with a lower pain sensitivity threshold or dogs who are more sensitive to pain, on average. Different letters denote statistical differences between breeds at an adjusted p < 0.05.
Figure 7
Figure 7
Dog breed/breed type comparisons for dog pain sensitivity thresholds for the thermal probe method positioned on the dog's metatarsus using pairwise t-tests. Benjamini–Yekutieli corrections were used to account for multiple comparisons. The mean and SD values are displayed for each breed/breed type. The longer latency of time the breed/breed type is allowed to pass before exhibiting a reaction would indicate dogs with a higher pain sensitivity threshold or dogs who are less sensitive to pain, on average. The shorter latency of time the breed/breed type is allowed to pass before exhibiting a reaction would indicate dogs with a lower pain sensitivity threshold or dogs who are more sensitive to pain, on average. Different letters denote statistical differences between breeds at an adjusted p < 0.05.
Figure 8
Figure 8
Dog breed/breed type comparisons for dog pain sensitivity thresholds for the thermal probe method positioned on the dog's carpus using pairwise t-tests. Benjamini–Yekutieli corrections were used to account for multiple comparisons. The mean and SD values are displayed for each breed/breed type. The longer latency of time the breed/breed type is allowed to pass before exhibiting a reaction would indicate dogs with a higher pain sensitivity threshold or dogs who are less sensitive to pain, on average. The shorter latency of time the breed/breed type is allowed to pass before exhibiting a reaction would indicate dogs with a lower pain sensitivity threshold or dogs who are more sensitive to pain, on average. Different letters denote statistical differences between breeds at an adjusted p < 0.05.
Figure 9
Figure 9
Dog breed/breed type comparisons for novel object task subjective score using pairwise t-tests. Benjamini–Yekutieli corrections were used to account for multiple comparisons. The proportion of dogs within each breed assigned a subjective score of 1—Interested, 2—Apprehensive, and 3—Avoidant is displayed. Different letters denote statistical differences between breeds at an adjusted p < 0.05.
Figure 10
Figure 10
Dog breed/breed type comparisons for approach scores assigned for the disgruntled stranger test were conducted using pairwise t-tests. Benjamini–Yekutieli corrections were used to account for multiple comparisons. The proportion of dogs within each breed assigned an approach score of 1—Immediate, 2—Cautious, 3—Reluctant, and 4—Refusal is displayed. Different letters denote statistical differences between breeds at an adjusted p < 0.05.

Similar articles

Cited by

References

    1. Gruen ME, White P, Hare B. Do dog breeds differ in pain sensitivity? Veterinarians and the public believe they do. PLoS One. (2020) 15(3):e0230315. 10.1371/journal.pone.0230315 - DOI - PMC - PubMed
    1. Hoffman KM, Trawalter S, Axt JR, Oliver MN. Racial bias in pain assessment and treatment recommendations, and false beliefs about biological differences between blacks and whites. Proc Natl Acad Sci U S A. (2016) 113(16):4296–301. 10.1073/pnas.1516047113 - DOI - PMC - PubMed
    1. Schäfer G, Prkachin KM, Kaseweter KA, Williams AdC. Health care providers’ judgments in chronic pain: the influence of gender and trustworthiness. Pain. (2016) 157(8):1618–25. 10.1097/j.pain.0000000000000536 - DOI - PubMed
    1. Wesolowicz D, Clark J, Boissoneault J, Robinson M. The roles of gender and profession on gender role expectations of pain in health care professionals. JPR. (2018) 11:1121–8. 10.2147/JPR.S162123 - DOI - PMC - PubMed
    1. Joynt M, Train MK, Robbins BW, Halterman JS, Caiola E, Fortuna RJ. The impact of neighborhood socioeconomic Status and race on the prescribing of opioids in emergency departments throughout the United States. J Gen Intern Med. (2013) 28(12):1604–10. 10.1007/s11606-013-2516-z - DOI - PMC - PubMed

LinkOut - more resources