

Improving localization accuracy for non-invasive automated early left ventricular origin localization approach
- PMID: 37435305
- PMCID: PMC10330701
- DOI: 10.3389/fphys.2023.1183280
Improving localization accuracy for non-invasive automated early left ventricular origin localization approach
Abstract
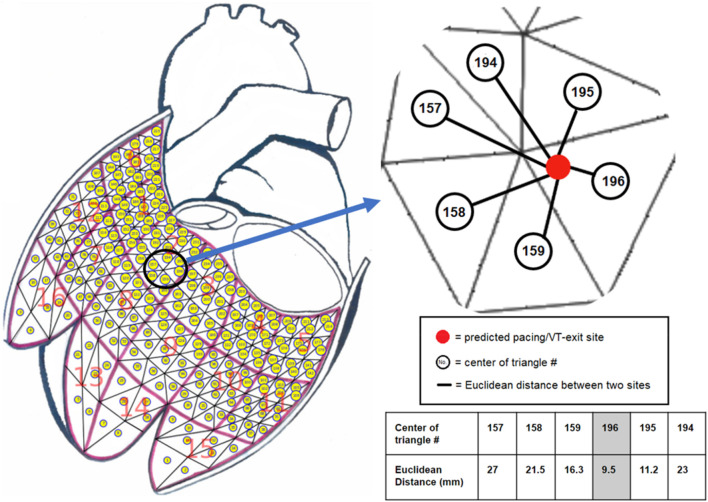
Background: We previously developed a non-invasive approach to localize the site of early left ventricular activation origin in real time using 12-lead ECG, and to project the predicted site onto a generic LV endocardial surface using the smallest angle between two vectors algorithm (SA). Objectives: To improve the localization accuracy of the non-invasive approach by utilizing the K-nearest neighbors algorithm (KNN) to reduce projection errors. Methods: Two datasets were used. Dataset #1 had 1012 LV endocardial pacing sites with known coordinates on the generic LV surface and corresponding ECGs, while dataset #2 included 25 clinically-identified VT exit sites and corresponding ECGs. The non-invasive approach used "population" regression coefficients to predict the target coordinates of a pacing site or VT exit site from the initial 120-m QRS integrals of the pacing site/VT ECG. The predicted site coordinates were then projected onto the generic LV surface using either the KNN or SA projection algorithm. Results: The non-invasive approach using the KNN had a significantly lower mean localization error than the SA in both dataset #1 (9.4 vs. 12.5 mm, p < 0.05) and dataset #2 (7.2 vs. 9.5 mm, p < 0.05). The bootstrap method with 1,000 trials confirmed that using KNN had significantly higher predictive accuracy than using the SA in the bootstrap assessment with the left-out sample (p < 0.05). Conclusion: The KNN significantly reduces the projection error and improves the localization accuracy of the non-invasive approach, which shows promise as a tool to identify the site of origin of ventricular arrhythmia in non-invasive clinical modalities.
Keywords: ECG; k-nearest neighbors (KNN) algorithm; pace-mapping; radiofrequency ablation; ventricular tachycardia.
Copyright © 2023 Zhou, Wang, Seagren, Emmert, Warren, MacInnis, AbdelWahab and Sapp.
Conflict of interest statement
JS: a co-holder of a patent for automated VT localization; no licensing, royalties or income currently or anticipated. Research funding from Biosense-Webster and Abbott (for clinical trial of catheter ablation of VT); modest speaker honoraria Medtronic, Biosense Webster, Abbott. AA: speaker honoraria Abbott, Medtronic. The remaining authors declare that the research was conducted in the absence of any commercial or financial relationships that could be construed as a potential conflict of interest.
Figures


Similar articles
-
Rapid 12-lead automated localization method: Comparison to electrocardiographic imaging (ECGI) in patient-specific geometry.J Electrocardiol. 2018 Nov-Dec;51(6S):S92-S97. doi: 10.1016/j.jelectrocard.2018.07.022. Epub 2018 Jul 29. J Electrocardiol. 2018. PMID: 30177365
-
Localization of Ventricular Activation Origin from the 12-Lead ECG: A Comparison of Linear Regression with Non-Linear Methods of Machine Learning.Ann Biomed Eng. 2019 Feb;47(2):403-412. doi: 10.1007/s10439-018-02168-y. Epub 2018 Nov 21. Ann Biomed Eng. 2019. PMID: 30465152
-
Localization of the site of origin of postinfarction ventricular tachycardia by endocardial pace mapping. Body surface mapping compared with the 12-lead electrocardiogram.Circulation. 1993 Nov;88(5 Pt 1):2290-306. doi: 10.1161/01.cir.88.5.2290. Circulation. 1993. PMID: 8222124
-
Identifying sites for catheter ablation of ventricular tachycardia.Herz. 1992 Jun;17(3):158-70. Herz. 1992. PMID: 1639335 Review.
-
Mapping for ventricular tachycardia.Card Electrophysiol Rev. 2002 Dec;6(4):436-41. doi: 10.1023/a:1021196627551. Card Electrophysiol Rev. 2002. PMID: 12438825 Review.
Cited by
-
Assessment of Intraprocedural Automated Arrhythmia Origin Localization System for Localizing Pacing Sites in 3D Space.JACC Clin Electrophysiol. 2025 May;11(5):907-918. doi: 10.1016/j.jacep.2024.12.003. Epub 2025 Jan 29. JACC Clin Electrophysiol. 2025. PMID: 39895448 Free PMC article.
References
-
- Al-Khatib S. M., Stevenson W. G., Ackerman M. J., Bryant W. J., Callans D. J., Curtis A. B., et al. (2017). 2017 AHA/ACC/HRS guideline for management of patients with ventricular arrhythmias and the prevention of sudden cardiac death: Executive summary: A report of the American college of cardiology/American heart association task force on clinical practice guidelines and the heart rhythm society. Circulation 138, e210–e271. 10.1161/CIR.0000000000000548 - DOI - PubMed
-
- Betensky B. P., Park R. E., Marchlinski F. E., Hutchinson M. D., Garcia F. C., Dixit S., et al. (2011). The V(2) transition ratio: A new electrocardiographic criterion for distinguishing left from right ventricular outflow tract tachycardia origin. J. Am. Coll. Cardiol. 57, 2255–2262. 10.1016/j.jacc.2011.01.035 - DOI - PubMed
-
- Bhaskaran A., Nayyar S., Porta-Sanchez A., Haldar S., Bokhari M., Massé S., et al. (2019). Exit sites on the epicardium rarely subtend critical diastolic path of ischemic VT on the endocardium: Implications for noninvasive ablation. J. Cardiovasc Electrophysiol. 30, 520–527. 10.1111/jce.13843 - DOI - PubMed
LinkOut - more resources
Full Text Sources