. 2023 Jun 28;19(3):149-162.
doi: 10.12965/jer.2346178.089. eCollection 2023 Jun.

Whole body vibration accelerates the functional recovery of motor nerve components in sciatic nerve-crush injury model rats

Affiliations

Whole body vibration accelerates the functional recovery of motor nerve components in sciatic nerve-crush injury model rats

Atsushi Doi et al. J Exerc Rehabil. .

Abstract

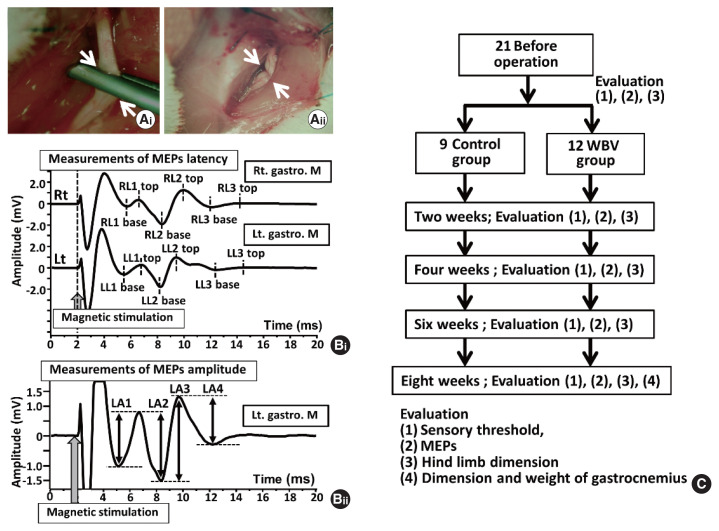
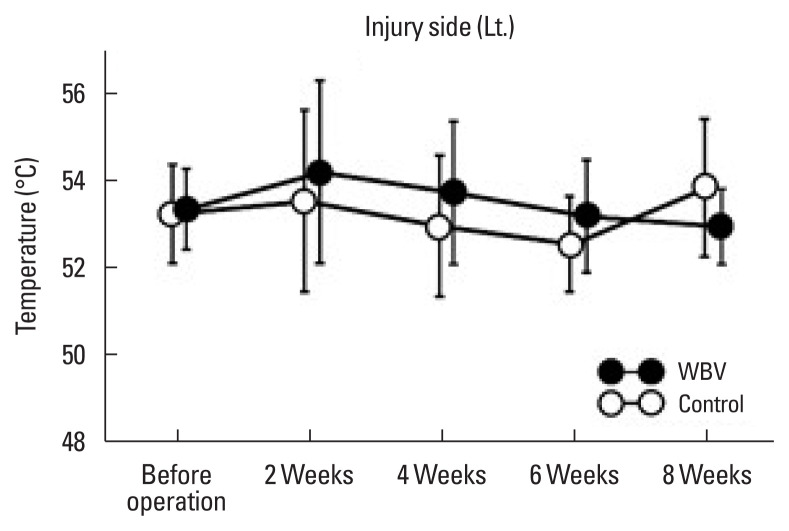
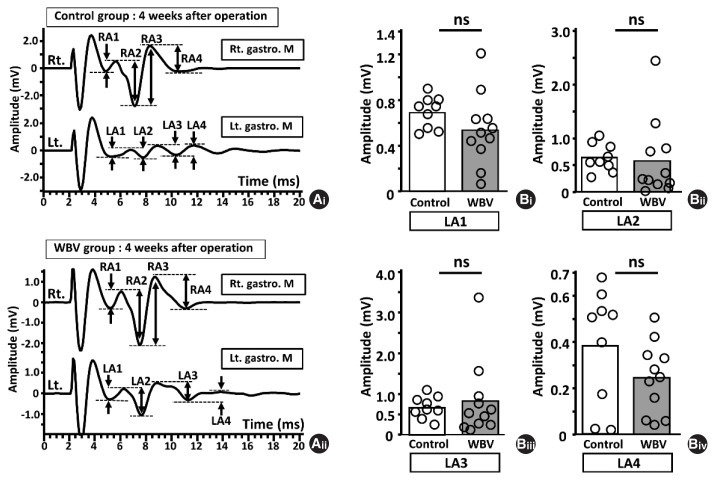
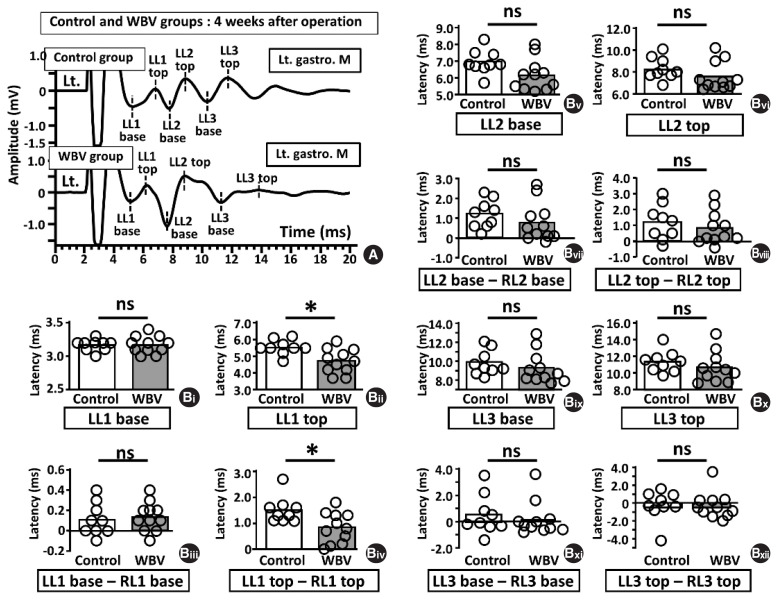
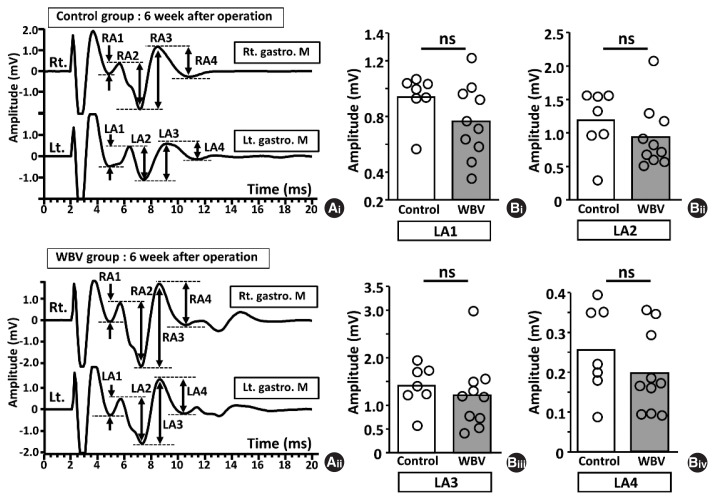
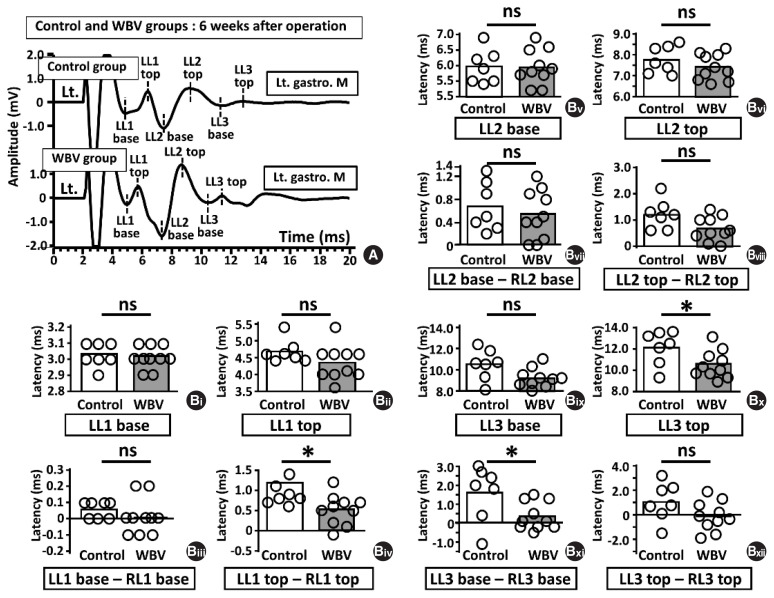
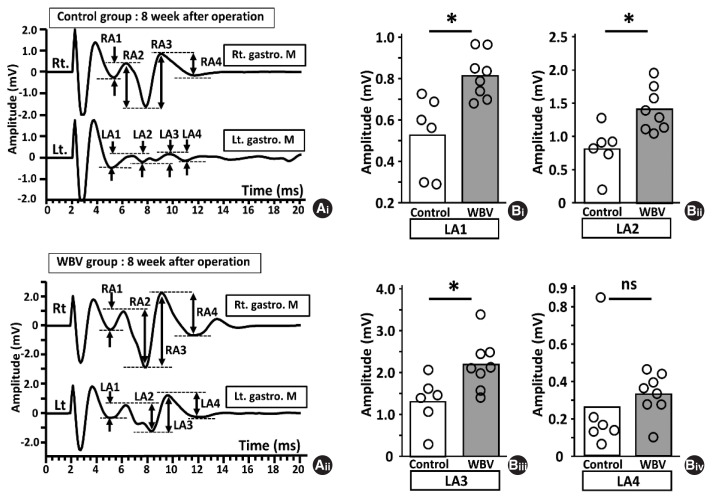
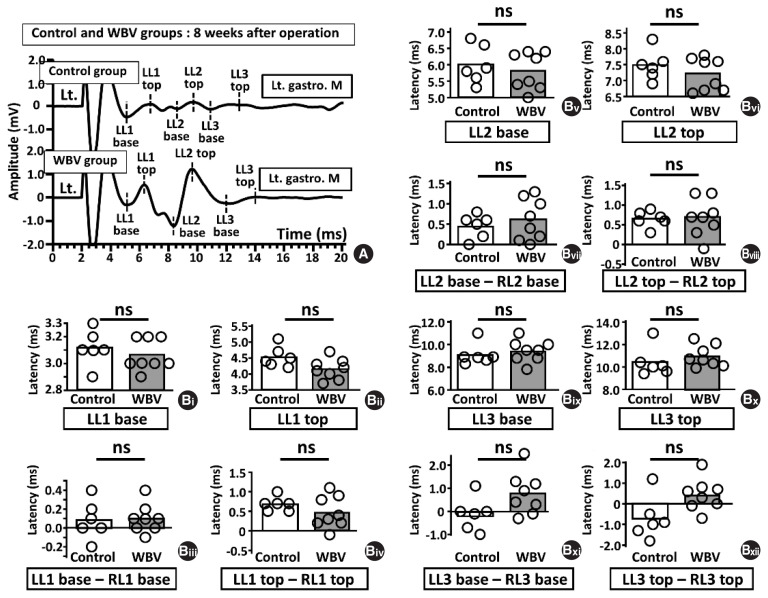
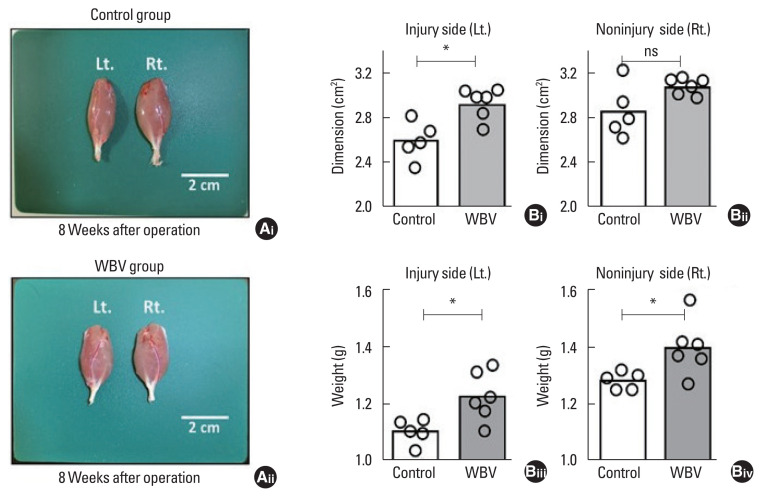
This study aimed to investigate the effect of whole body vibration (WBV) on the sensory and motor nerve components with sciatic nerve injury model rats. Surgery was performed on 21 female Wister rats (6-8 weeks) under intraperitoneal anesthesia. The nerve-crush injuries for the left sciatic nerve were inflicted using a Sugita aneurysm clip. The sciatic nerve model rats were randomly divided into two groups (n=9; control group, n=12; WBV group). The rats in the WBV group walked in the cage with a vibratory stimulus (frequency 50 Hz, 20 min/day, 5 times/wk), while those in the control group walked in the cage without any vibratory stimulus. We used heat stimulation-induced sensory threshold and lumbar magnetic stimulation-induced motor-evoked potentials (MEPs) to measure the sensory and motor nerve components, respectively. Further, morphological measurements, bilateral hind-limb dimension, bilateral gastrocnemius dimension, and weight were evaluated. Consequently, there were no significant differences in the sensory threshold at the injury side between the control and WBV groups. However, at 4 and 6 weeks postoperatively, MEPs latencies in the WBV group were significantly shorter than those in the control group. Furthermore, both sides of the hind-limb dimension at 6 weeks postoperatively, the left side of the gastrocnemius dimension, and both sides of the gastrocnemius weight significantly increased. In conclusion, WBV especially accelerates the functional recovery of motor nerve components in sciatic nerve-crush injury model rats.

Keywords: Lumbar magnetic stimulation; Motor nerve evaluation; Motor-evoked potentials; Nerve-crush injury model; Whole body vibration.


Conflict of interest statement

CONFLICT OF INTEREST The authors report no conflicts of interest in this work.

Figures

Fig. 1
Fig. 1
Sciatic nerve surgery, sensory threshold, and lumbar magnetic stimulation (LMS)-induced motor-evoked potentials (MEPs) from bilateral gastrocnemius muscle. (A) Surgery for left sciatic nerve. Arrows in (Ai) and (Aii) show the compression sites with the clip. (Ai) A photo of sciatic nerve compression with a Sugita aneurysm clip. (Aii) A photo of sciatic nerve decompression. (B) An example of a single bilateral MEPs raw data before sciatic nerve surgery. (Bi) Measurements of MEPs latency. (Upper panel of Bi) LMS-induced MEPs from the right gastrocnemius muscle. (Lower panel of Bi) LMS-induced MEPs from the left gastrocnemius muscle. (Bii) Y-axis expanded LMS-induced MEPs from the left gastrocnemius muscle and measurements of MEPs amplitude. (C) A flow chart of the experimental protocol. RL1, right side’s latency 1; RL2, right side’s latency 2; RL3, right side’s latency 3; LL1, left side’s latency 1; RL2, left side’s latency 2; RL3, left side’s latency 3; LA1, the amplitude value of (LL1 top–LL1 base); LA2, the amplitude value of (LL1 top–LL2 base); LA3, the amplitude value of (LL2 top–LL2 base); LA4, the amplitude value of (LL2 top–LL3 base); gastro. M, gastrocnemius muscle.
Fig. 2
Fig. 2
Changing of sensory threshold before and after sciatic nerve-crush model rats between control and whole body vibration (WBV) groups. Lt., left.
Fig. 3
Fig. 3
Amplitudes of lumbar magnetic stimulation (LMS)-induced motor-evoked potentials (MEPs) amplitudes at 4 weeks postoperatively. (A) An example of a single bilateral MEPs raw data 4 weeks after sciatic nerve surgery. (Ai) Control group. (Upper panel of Ai) LMS-induced MEPs from right gastrocnemius muscle. (Lower panel of Ai) LMS-induced MEPs from left gastrocnemius muscle. (Aii) WBV group. (Upper panel of Aii) LMS-induced MEPs from right. right gastrocnemius muscle. (Lower panel of Aii) LMS-induced MEPs from left right gastrocnemius muscle. (B) Bar graphs of amplitude related eight parameters and comparison between the control group (left bar, n=9) and WBV group (right bar, n=11). (Bi) Comparison of LA1. (Bii) Comparison of LA2. (Biii) Comparison of LA3. (Biv) Comparison of LA4. RA1, the amplitude value of (RL1 top–RL1 base); RA2, the amplitude value of (RL1 top–RL2 base); RA3, the amplitude value of (RL2 top–RL2 base); LA4, the amplitude value of (RL2 top–RL3 base); LA1, the amplitude value of (LL1 top–LL1 base); LA2, the amplitude value of (LL1 top–LL2 base); LA3, the amplitude value of (LL2 top–LL2 base); LA4, the amplitude value of (LL2 top–LL3 base); WBV, whole body vibration; gastro. M, gastrocnemius muscle; ns, not significant.
Fig. 4
Fig. 4
Latencies of lumbar magnetic stimulation (LMS)-induced motor-evoked potentials (MEPs) latencies at 4 weeks postoperatively. (A) An example of a single left MEPs raw data 4 weeks after sciatic nerve surgery. (Upper panel of 4A) Control group. (Lower panel of 4A) WBV group. (B) Bar graphs of latencies related to twelve parameters and comparison between the control group (left bar, n=9) and WBV group (right bar, n=11). (Bi) Comparison of LL1 base. (Bii) Comparison of LL1 top. (Biii) Comparison of LL1 base – RL1 base. (Biv) Comparison of LL1 top – RL1 top. (Bv) Comparison of LL2 base. (Bvi) Comparison of LL2 top. (Bvii) Comparison of LL2 base – RL2 base. (Bviii) Comparison of LL1 top – RL1 top. (Bix) Comparison of LL3 base. (Bx) Comparison of LL3 top. (Bxi) Comparison of LL3 base – RL3 base. (Bxii) Comparison of LL3 top – RL3 top. RL1, right side’s latency 1; RL2, right side’s latency 2; RL3, right side’s latency 3; LL1, left side’s latency 1; LL2, left side’s latency 2; LL3, left side’s latency 3; WBV, whole body vibration; gastro. M, gastrocnemius muscle; ns, not significant. *P<0.05.
Fig. 5
Fig. 5
Amplitudes of lumbar magnetic stimulation (LMS)-induced motor-evoked potentials (MEPs) amplitudes at 6 weeks postoperatively. (A) An example of a single bilateral MEPs raw data 6 weeks after sciatic nerve surgery. (Ai) Control group. (Upper panel of Ai) LMS-induced MEPs from Rt. gastro. M. (Lower panel of Ai) LMS-induced MEPs from Lt. gastro. M. (Aii) WBV group. (Upper panel of Aii) LMS-induced MEPs from Rt. gastro. M. (Lower panel of Aii) LMS-induced MEPs from Lt. gastro. M. (B) Bar graphs of amplitude related eight parameters and comparison between the control group (left bar, n=7) and WBV group (right panels, n=10). (Bi) Comparison of LA1. (Bii) Comparison of LA2. (Biii) Comparison of LA3. (Biv) Comparison of LA4. RA1, the amplitude value of (RL1 top–RL1 base); RA2, the amplitude value of (RL1 top–RL2 base); RA3, the amplitude value of (RL2 top–RL2 base); LA4, the amplitude value of (RL2 top–RL3 base); LA1, the amplitude value of (LL1 top–LL1 base); LA2, the amplitude value of (LL1 top–LL2 base); LA3, the amplitude value of (LL2 top–LL2 base); LA4, the amplitude value of (LL2 top–LL3 base); WBV, whole body vibration; gastro. M, gastrocnemius muscle; ns, not significant.
Fig. 6
Fig. 6
Latencies of lumbar magnetic stimulation (LMS)-induced motor-evoked potentials (MEPs) latencies at 6 weeks postoperatively. (A) An example of a single left MEPs raw data 6 weeks after sciatic nerve surgery. (Ai) Control group. (Aii) WBV group. (B) Bar graphs of latencies related to twelve parameters and comparison between the control group (left bar, n=7) and WBV group (right bar, n=10). (Bi) Comparison of LL1 base. (Bii) Comparison of LL1 top. (Biii) Comparison of LL1 base – RL1 base. (Biv) Comparison of LL1 top – RL1 top. (Bv) Comparison of LL2 base. (Bvi) Comparison of LL2 top. (Bvii) Comparison of LL2 base – RL2 base. (Bviii) Comparison of LL1 top – RL1 top. (Bix) Comparison of LL3 base. (Bx) Comparison of LL3 top. (Bxi) Comparison of LL3 base – RL3 base. (Bxii) Comparison of LL3 top – RL3 top. RL1, right side’s latency 1; RL2, right side’s latency 2; RL3, right side’s latency 3; LL1, left side’s latency 1; LL2, left side’s latency 2; LL3, left side’s latency 3; WBV, whole body vibration; gastro. M, gastrocnemius muscle; ns, not significant. *P<0.05.
Fig. 7
Fig. 7
Amplitudes of lumbar magnetic stimulation (LMS)-induced motor-evoked potentials (MEPs) amplitudes at 8 weeks postoperatively. (A) An example of a single bilateral MEPs raw data 8 weeks after sciatic nerve surgery. (Ai) Control group. (Upper panel of Ai) LMS-induced MEPs from Rt. gastro. M. (Lower panel of Ai) LMS-induced MEPs from Lt. gastro. M. (Ab) WBV group. (Upper panel of Aii) LMS-induced MEPs from Rt. gastro. M. (Lower panel of Aii) LMS-induced MEPs from Lt. gastro. M. (B) Bar graphs of amplitude related eight parameters and comparison between the control group (left bar, n=6) and WBV group (right bar, n=8). (Bi) Comparison of LA1. (Bii) Comparison of LA2. (Biii) Comparison of LA3. (Biv) Comparison of LA4. RA1, the amplitude value of (RL1 top–RL1 base); RA2, the amplitude value of (RL1 top–RL2 base); RA3, the amplitude value of (RL2 top–RL2 base); LA4, the amplitude value of (RL2 top–RL3 base); LA1, the amplitude value of (LL1 top–LL1 base); LA2, the amplitude value of (LL1 top–LL2 base); LA3, the amplitude value of (LL2 top–LL2 base); LA4, the amplitude value of (LL2 top–LL3 base); WBV, whole body vibration; gastro. M, gastrocnemius muscle; ns, not significant. *P<0.05.
Fig. 8
Fig. 8
Latencies of lumbar magnetic stimulation (LMS)-induced motor-evoked potentials (MEPs) latencies at 8 weeks postoperatively. (A) An example of a single left MEPs raw data 8 weeks after sciatic nerve surgery. (Ai) Control group. (Aii) WBV group. (B) Bar graphs of latencies related to twelve parameters and comparison between the control group (left bar, n=6) and WBV group (right bar, n=8). (Bi) Comparison of LL1 base. (Bii) Comparison of LL1 top. (Biii) Comparison of LL1 base – RL1 base. (Biv) Comparison of LL1 top – RL1 top. (Bv) Comparison of LL2 base. (Bvi) Comparison of LL2 top. (Bvii) Comparison of LL2 base – RL2 base. (Bviii) Comparison of LL1 top – RL1 top. (Bix) Comparison of LL3 base. (Bx) Comparison of LL3 top. (Bxi) Comparison of LL3 base – RL3 base. (Bxii) Comparison of LL3 top – RL3 top. RL1, right side’s latency 1; RL2, right side’s latency 2; RL3, right side’s latency 3; LL1, left side’s latency 1; LL2, left side’s latency 2; LL3, left side’s latency 3; WBV, whole body vibration; gastro. M, gastrocnemius muscle; ns, not significant.
Fig. 9
Fig. 9
Temporal measurements of bilateral hind-limb dimension. (A) Photos of bilateral hind-limb from the top side. (Ai) A photo of bilateral hind-limb in the control group. (Aii) A photo of bilateral hind-limb at WBV group. (B) Two line graphs of bilateral hind-limb dimension between control and WBV group. (Bi) Two line graphs of the injured left side and a comparison between the control group (white circle) and the WBV group (black circle). (Bii) Two line graphs of the noninjured right side and a comparison between the control group (white circle) and WBV group (black circle). WBV, whole body vibration. *P<0.05.
Fig. 10
Fig. 10
Measurement of both bilateral gastrocnemius dimension and bilateral gastrocnemius weight at 8 weeks postoperatively. (A) Photos of bilateral gastrocnemius from the top side. (Ai) A photo of bilateral gastrocnemius in the control group. (Aii) A photo of bilateral gastrocnemius at WBV group. (B) Bar graphs of both dimension and weight of bilateral gastrocnemius. (Bi) Bar graphs of left gastrocnemius dimension and comparison between the control group (left bar, n=5) and WBV group (right bar, n=6). (Bii) Bar graphs of right gastrocnemius dimension and comparison between the control group (left bar, n=5) and WBV group (right bar, n=6). (Biii) Bar graphs of left gastrocnemius weight and comparison between the control group (left bar, n=5) and WBV group (right bar, n=6). (Biv) Bar graphs of right gastrocnemius weight and comparison between the control group (left bar, n=5) and WBV group (right bar, n=6). WBV, whole body vibration; Lt., left; Rt., right. *P<0.05.

Similar articles

Cited by

References

    1. Alvites RD, Branquinho MV, Sousa AC, Amorim I, Magalhães R, João F, Almeida D, Amado S, Prada J, Pires I, Zen F, Raimondo S, Luís AL, Geuna S, Varejão ASP, Maurício AC. Combined use of chitosan and olfactory mucosa mesenchymal stem/stromal cells to promote peripheral nerve regeneration in vivo. Stem Cells Int. 2021;2021:6613029. - PMC - PubMed
    1. Barker K, Eickmeyer S. Therapeutic exercise. Med Clin North Am. 2020;104:189–198. - PubMed
    1. Berner K, Albertyn SCS, Dawnarain S, Hendricks LJ, Johnson J, Landman A, Burger M. The effectiveness of combined lower limb strengthening and whole-body vibration, compared to strengthening alone, for improving patient-centred outcomes in adults with COPD: a systematic review. S Afr J Physiother. 2020;76:1412. - PMC - PubMed
    1. Betik AC, Parker L, Kaur G, Wadley GD, Keske MA. Whole-body vibration stimulates microvascular blood flow in skeletal muscle. Med Sci Sports Exerc. 2021;53:375–383. - PubMed
    1. Bonanni R, Cariati I, Romagnoli C, D’Arcangelo G, Annino G, Tancredi V. Whole body vibration: a valid alternative strategy to exercise? J Funct Morphol Kinesiol. 2022;7:99. - PMC - PubMed