. 2023 Jul;43(7):3331024231187162.
doi: 10.1177/03331024231187162.

Symptoms associated with headache in youth

Affiliations

Symptoms associated with headache in youth

Carlyn Patterson Gentile et al. Cephalalgia. 2023 Jul.

Abstract

Objective: To determine the underlying relationships between a broad range of headache-associated symptoms and how they relate to headache burden.

Background: Symptoms associated with head pain inform classification of headache disorders. However, many headache-associated symptoms are not included in the diagnostic criteria, which is largely based on expert opinion. Large symptom databases can assess headache-associated symptoms irrespective of pre-existing diagnostic categories.

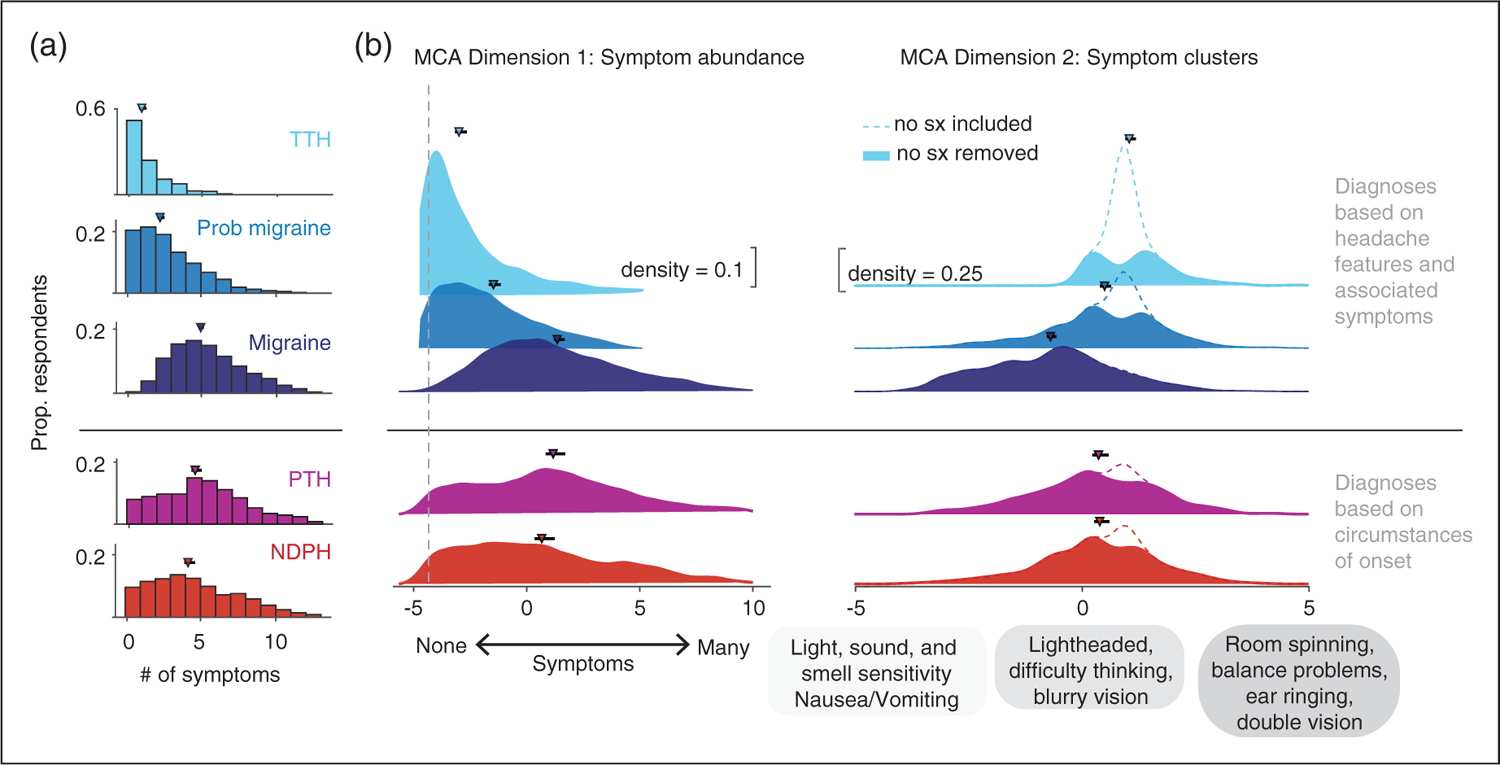
Methods: We conducted a large single-center cross-sectional study on youth (6-17 years old) assessing patient-reported outpatient headache questionnaires between June 2017 and February 2022. Multiple correspondence analysis, an exploratory factor analysis, was applied to 13 headache-associated symptoms.

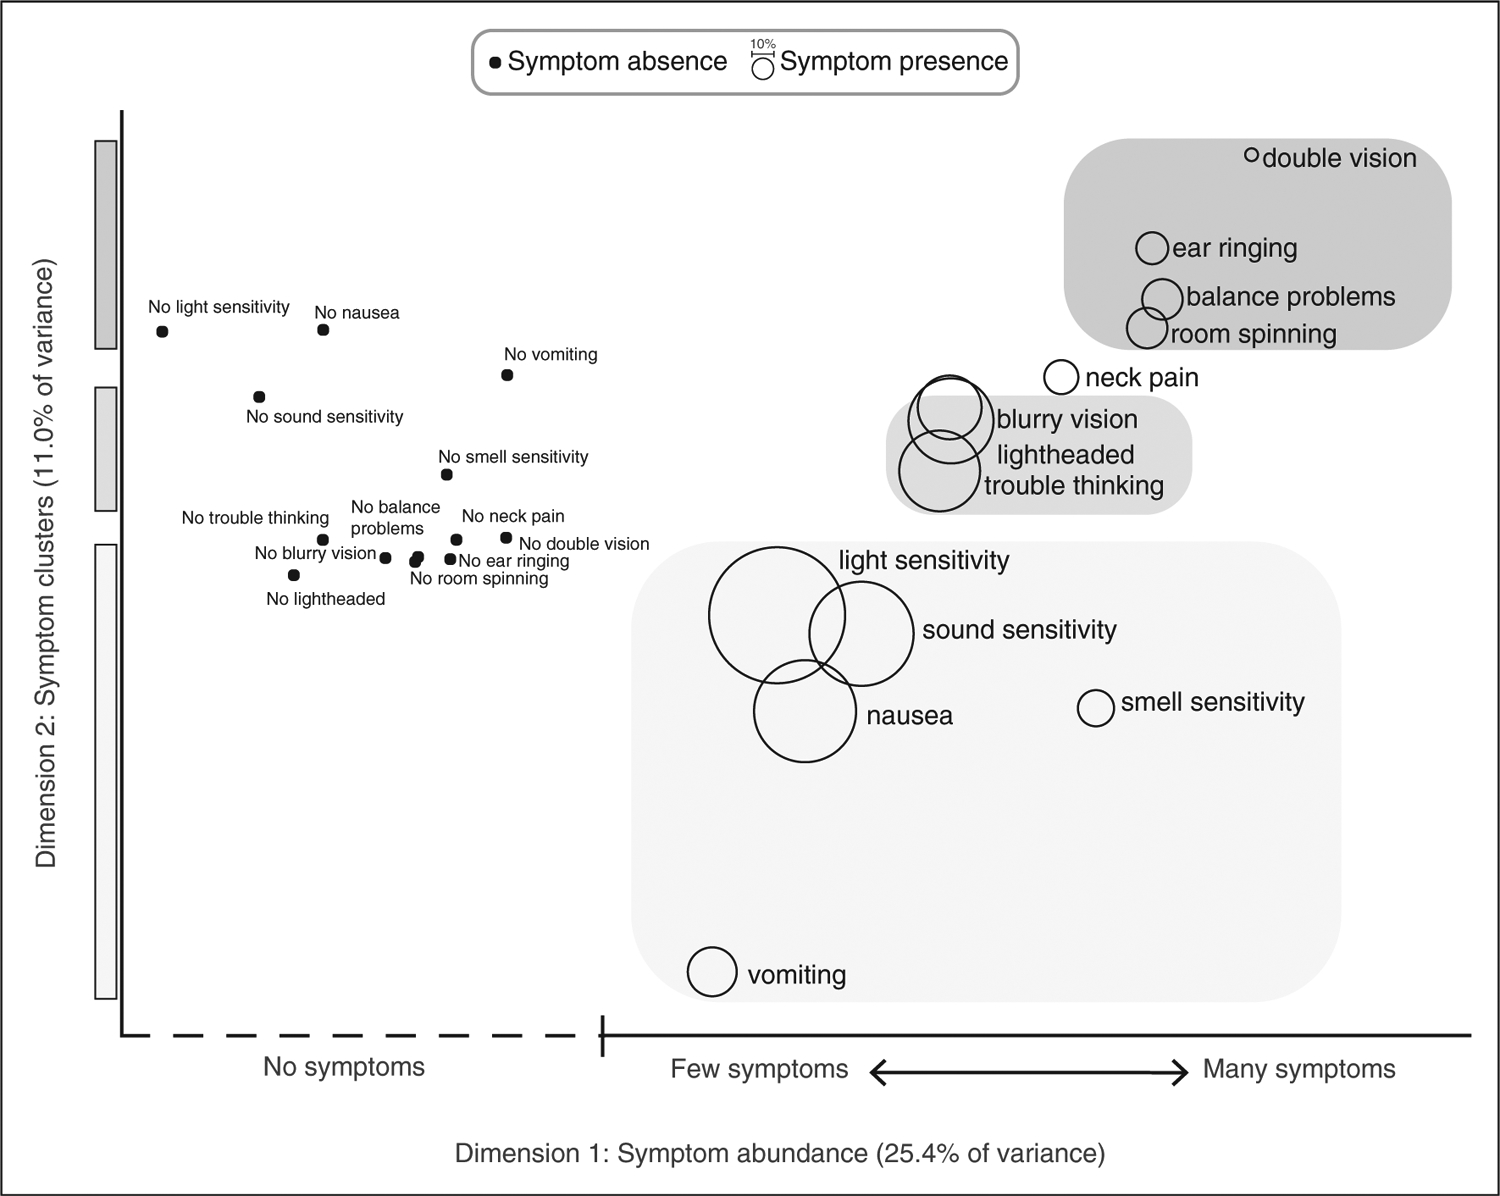
Results: 6662 participants (64% female; median age 13.6 years) were included. Multiple correspondence analysis dimension 1 (25.4% of the variance) captured the absence or abundance of headache-associated symptoms. A greater number of headache-associated symptoms correlated with greater headache burden. Dimension 2 (11.0% of the variance) revealed three symptom clusters: (1) cardinal features of migraine (light, sound, and smell sensitivity, nausea, and vomiting), (2) nonspecific global neurologic dysfunction symptoms (lightheadedness, trouble thinking, blurry vision), (3) vestibular and brainstem dysfunction symptoms (vertigo, balance problems, ear ringing, double vision).

Conclusion: Assessing a broader range of headache-associated symptoms reveals clustering of symptomatology and a strong relationship with headache burden.

Keywords: Pediatric; diagnosis; headache; headache-associated symptoms; migraine.


Figures

Figure 1.
Figure 1.
Flowchart. Questionnaire inclusion/exclusion are shown. The majority of those excluded for missing data occurred with the PedMIDAS question as this was the nal aspect of the questionnaire. Demographics of those with missing questionnaire data did not significantly differ from the nal cohort based on age (h = 0.02, p = 0.50), sex assigned at birth (χ2 = 4.3, p = 0.12), or ethnicity (χ2 = 0.71, p = 0.87), but did differ by race (χ2 = 18.4, p = 0.005). Specially, a larger percentage of missing data identified as Black compared to the final cohort (13.7% vs. 17.1%).
Figure 2.
Figure 2.
Headache-associated symptoms in MCA space. Factor loadings corresponding to the presence and absence of 13 headache-associated symptoms for MCA dimension 1 (x-axis) and MCA dimension 2 (y-axis). The presence of symptoms are shown as bubbles, with bubble size representing the proportion of respondents who reported the presence of that symptom. Factor loadings for the absence of each symptom is shown as black dots. The proximity of two data points in the 2-dimensional MCA space indicates that these symptoms are more likely to co-occur. Factor loading units are omitted for clarity since the absolute values do not hold specific meaning. MCA dimension 1 consists of the relative absence (left side of graph) or abundance (right side of graph) of headache-associated symptoms. Symptom absence is found at the far left of the graph, and the presence of symptoms to the far right of the graph are more likely to be reported with many other symptoms, while symptoms to the middle of the graph are more likely to be reported with few other symptoms. For instance, vomiting and balance problems are reported with similar frequency, but vomiting is more likely to be reported with relatively few symptoms, while balance problems tend to be reported as one of many symptoms. MCA dimension 2 (y-axis) reveals symptom clustering. Symptoms of hypersensitivity tend to co-occur with nausea and vomiting (bottom of graph, lightest gray), while symptoms of nonspecific neurologic dysfunction (lightheaded, blurry vision, trouble thinking) cluster in the middle of the graph (middle gray), and vestibular and brainstem symptoms cluster at the top of the graph (darkest gray).
Figure 3.
Figure 3.
Comparison of abundance of headache-associated symptoms with headache burden and demographic data. (a) MCA dimension 1 factor loadings for individual respondents is shown as a function of overall headache severity (left panel), headache-related disability as measured by PedMIDAS (middle panel), and frequency of severe headaches (right panel). Box-and-whisker plots represent the median (thick line), interquartile range (box), 95th percentile (whiskers), and outliers (+ signs) and (b) Median MCA dimension 1 factor loadings are plotted as a function of age (binned by age in years), and legal sex. HA = headache, mod. = moderate, mo = month, wk = week, yr = year.
Figure 4.
Figure 4.
Headache-associated symptom by ICHD-3 diagnosis. (a) Histograms of the total number of headache-associated symptoms (maximum 13) reported by individual respondents by ICHD-3 headache diagnosis. Markers indicate median number of symptoms with 95% confidence intervals by bootstrap analysis. A small percentage (0.4%) of those with a migraine diagnosis reported no headache-associated symptoms because ICHD-3 associated symptom criteria could still be met if they reported light and sound as a trigger for headache, though this was a rare occurrence (b) Ridgeline plots of individual respondents’ factor loadings of MCA dimensions 1 (left panel), and 2 (right panel) by ICHD-3 diagnosis. Markers and errorbars represent the median MCA score for each diagnosis with 95% confidence intervals. ICHD-3 diagnoses are grouped based on whether diagnosis is made by features of headache (migraine, probable migraine, tension-type headache) or the circumstances of their onset (post-traumatic headache, new daily persistent headache). Dotted gray line represents the factor loading corresponding to no symptoms for MCA dimension 1. Ridgeline plots for MCA dimension 2 are shown with (dotted line) and without (solid color) respondents who reported no symptoms. This was done to distinguish respondents who reported no symptoms compared to those who were experiencing symptoms in the lightheadedness cluster, which have similar factor loadings near 0. Distributions represent kernel density function based on normal distribution with a bandwidth of 0.5 for MCA dimension 1, and 0.25 for MCA dimension 2. # = number, Sx = symptoms, TTH = tension-type headache, PTH = post-traumatic headache, NDPH = New daily persistent/new onset headache.

References

    1. Goadsby PJ. Recent advances in the diagnosis and management of migraine. BMJ 2006; 332: 25–29. - PMC - PubMed
    1. Harriott AM and Schwedt TJ. Migraine is associated with altered processing of sensory stimuli. Curr Pain Headache Rep 2014; 18: 1–7. - PubMed
    1. Hershey AD, Winner P, Kabbouche MA, et al. Use of the ICHD-ii criteria in the diagnosis of pediatric migraine. Headache J Head Face Pain 2005; 45: 1288–1297. - PubMed
    1. International Headache Society. The International Classification of Headache Disorders, 3rd edition. Cephalalgia 2018; 38: 1–211. - PubMed
    1. Harris PA, Taylor R, Minor BL, et al. The REDCap consortium: Building an international community of software platform partners. J Biomed Inform 2019; 95: 103208. - PMC - PubMed