. 2023 Jul 12:12:e83868.
doi: 10.7554/eLife.83868.

Conformational regulation and target-myristoyl switch of calcineurin B homologous protein 3

Affiliations

Conformational regulation and target-myristoyl switch of calcineurin B homologous protein 3

Florian Becker et al. Elife. .

Abstract

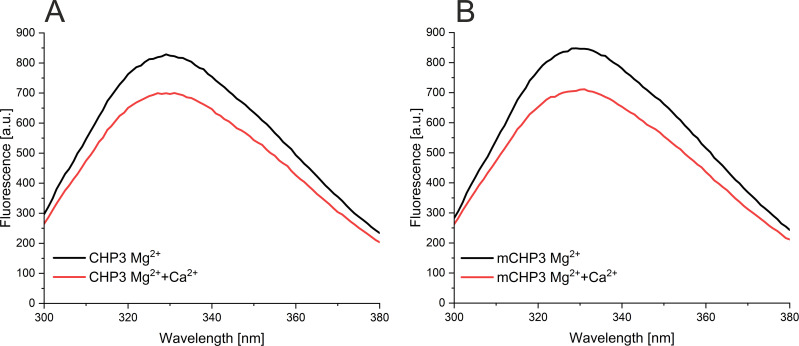
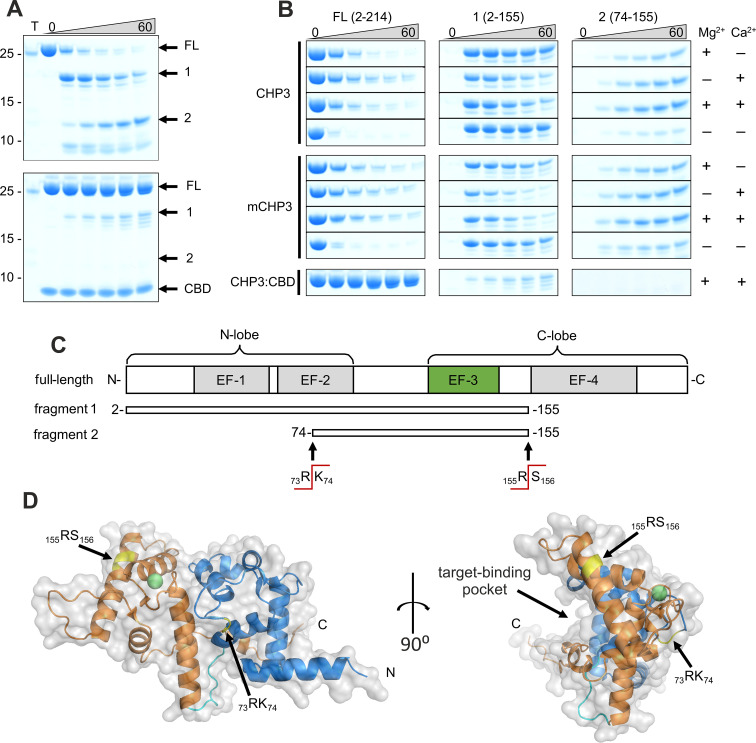
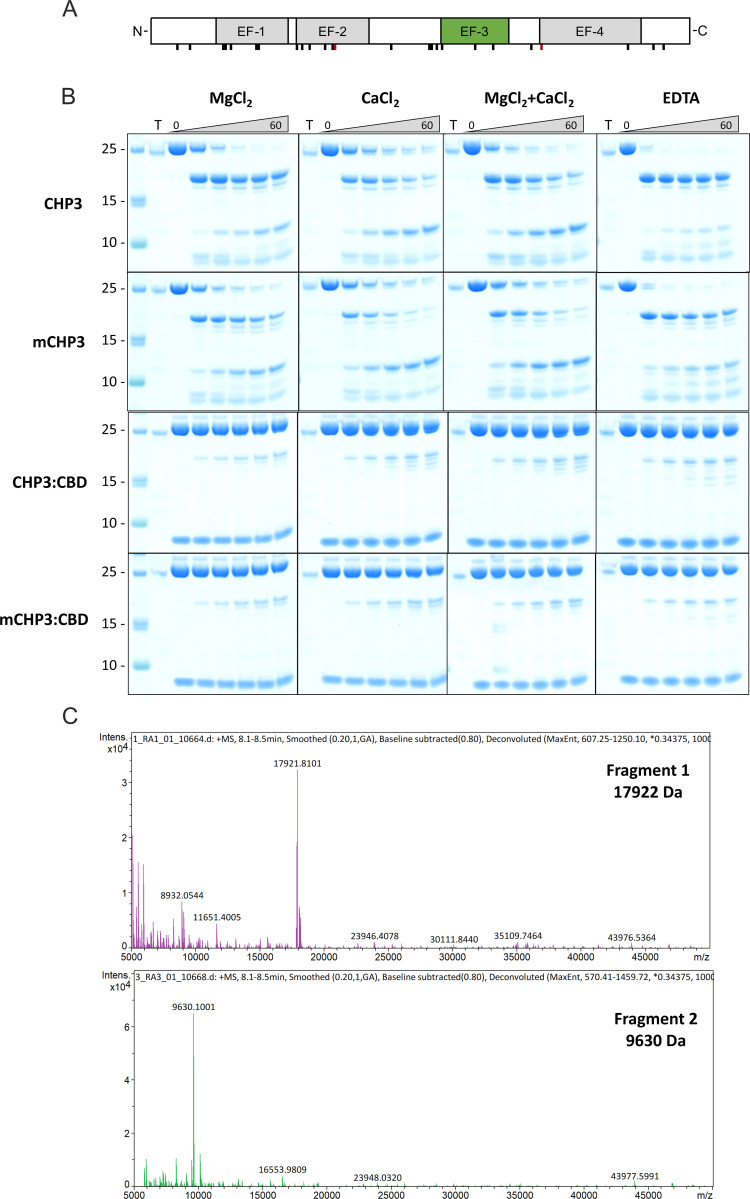
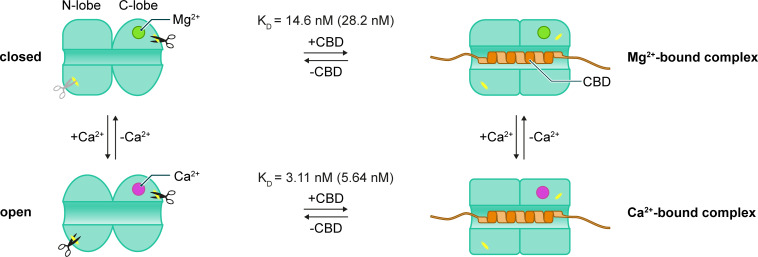
Calcineurin B homologous protein 3 (CHP3) is an EF-hand Ca2+-binding protein involved in regulation of cancerogenesis, cardiac hypertrophy, and neuronal development through interactions with sodium/proton exchangers (NHEs) and signalling proteins. While the importance of Ca2+ binding and myristoylation for CHP3 function has been recognized, the underlying molecular mechanism remained elusive. In this study, we demonstrate that Ca2+ binding and myristoylation independently affect the conformation and functions of human CHP3. Ca2+ binding increased local flexibility and hydrophobicity of CHP3 indicative of an open conformation. The Ca2+-bound CHP3 exhibited a higher affinity for NHE1 and associated stronger with lipid membranes compared to the Mg2+-bound CHP3, which adopted a closed conformation. Myristoylation enhanced the local flexibility of CHP3 and decreased its affinity to NHE1 independently of the bound ion, but did not affect its binding to lipid membranes. The data exclude the proposed Ca2+-myristoyl switch for CHP3. Instead, a Ca2+-independent exposure of the myristoyl moiety is induced by binding of the target peptide to CHP3 enhancing its association to lipid membranes. We name this novel regulatory mechanism 'target-myristoyl switch'. Collectively, the interplay of Ca2+ binding, myristoylation, and target binding allows for a context-specific regulation of CHP3 functions.

Keywords: CHP3; Ca2+-binding proteins; NHE1; biochemistry; chemical biology; conformational changes; human; myristoyl switch; myristoylation; tescalcin.


Conflict of interest statement

FB, SF, LR, FD, WB, SL, JH, SH, CK, BW, EM, CH No competing interests declared, US is an employee and shareholder of Logopharm GmbH that produces ComplexioLyte 47 used in this study, BF is shareholder of Logopharm GmbH. The company provides ComplexioLyte reagents to academic institutions on a non-profit basis

Figures

Figure 1.
Figure 1.. Quality control of the purified non-myristoylated CHP3 and myristoylated CHP3 (mCHP3).
(A) Sodium dodecyl sulfate–polyacrylamide gel electrophoresis (SDS–PAGE) analysis (16%, tricine mini gels) showed a mobility shift of mCHP3 in comparison to CHP3; positions of co-migrated molecular mass standards are indicated in kDa on the left; Figure 1—source data 1: Full gel for (A). (B) Left, deconvoluted mass spectra of CHP3 (top) and mCHP3 (bottom) show a measured intact protein mass of 24.617 and 24.828 kDa (∆Mr = 211 Da), which is in line with the addition of the myristoyl group of 210 Da. For mCHP3, also low abundant dimeric species were observed by native MS analysis. Right, zoom-in spectra in the range of 24.8 ± 0.3 kDa that show differences in masses as indicated by dashed lines. In the presence of Ca2+, the measured intact protein mass of CHP3 and mCHP3 was increased by ~40 Da (mass accuracy ± 1 Da), respectively, indicating binding of one Ca2+ ion. (C) Ion mobility arrival time distributions for the +8 charge state of CHP3 (solid line) and mCHP3 (dashed line). A shoulder with shorter arrival times indicates the presence of a low abundant dimeric species for CHP3 and mCHP3. Arrival times of mCHP3 were reduced by 1.36 ms (±0.37 ms; n = 3; p = 0.024) compared to CHP3. See Figure 1—figure supplement 2 for non-deconvoluted mass spectra showing charge state distributions of CHP3 and mCHP3 measured in the positive ion mode by native MS.
Figure 1—figure supplement 1.
Figure 1—figure supplement 1.. Analytical size exclusion chromatography of purified CHP3 (A) and mCHP3 (B) on Superdex 75 Increase 10/300 GL.
The position of elution peaks of mass standards (aldolase: 158 kDa, conalbumin: 75 kDa, carbonic anhydrase: 29 kDa, cytochrome c: 12.4 kDa) are indicated on the top.
Figure 1—figure supplement 2.
Figure 1—figure supplement 2.. Non-deconvoluted mass spectra showing charge state distributions of CHP3 and mCHP3 measured in the positive ion mode by native MS.
Figure 2.
Figure 2.. Ca2+-induced conformational changes in CHP3 and mCHP3.
(A) Kinetic fluorescence probe hydrophobicity (FPH) assay. Fluorescence of dye bound at hydrophobic protein surfaces was monitored at λem = 585 nm (excitation λex = 470 nm) and at 22°C. Protein (1.5 µM) was prepared in the Mg2+-bound state (2 mM MgCl2, 1 mM EGTA). CaCl2, EDTA, and EGTA were sequentially added as indicated. First, 2 mM CaCl2 was added and then chelated with addition of 3 mM EGTA. Next, 3 mM EDTA was added to remove both divalent ions (CHP3 in apo-state) followed by another addition of 4 mM CaCl2. (B) Intrinsic tryptophan fluorescence was monitored at λem = 330 nm (excitation λex = 280 nm) at 22°C. Protein (2.5 μM) in the Mg2+-bound state was used and the additions were performed as described above for the FPH assay. (C) AlphaFold2.0 model (Varadi et al., 2022) of CHP3 in surface presentation, with surface coloured for hydrophobicity (Eisenberg et al., 1984). The model most likely resembles the open or target-bound conformation. The single tryptophan residue highlighted in green (Trp191) is located in the hydrophobic target-binding pocket. EC50 values for binding of Ca2+ to CHP3 (D) and mCHP3 (E) determined with FPH assay. Fluorescence of samples with CHP3 or mCHP3 at different Ca2+ concentrations was measured at 590 nm in the presence of 2 mM MgCl2. Three biological replicates (shown in different colours) with three to four technical replicates each for CHP3 and mCHP3 were measured. The data were fitted with Hill equation using global non-linear regression. (F) 95% confidence intervals (Δχ2 of 3.84) of EC50 values for binding of Ca2+ calculated with profile likelihood method. EC50 values (asterisks) are shown with confidence intervals in square brackets below the graph.
Figure 2—figure supplement 1.
Figure 2—figure supplement 1.. Conformational changes of CHP3, mCHP3, recoverin, and myristoylated recoverin monitored with the fluorescence probe hydrophobicity (FPH) assay.
(A) Original fluorescence traces of the FPH assay for three biological replicates of CHP3 and mCHP3. (B) Normalized fluorescence traces of the FPH assay for myristoylated and non-myristoylated recoverin (mRec and Rec).
Figure 2—figure supplement 2.
Figure 2—figure supplement 2.. Intrinsic tryptophan fluorescence spectra of CHP3 (A) and mCHP3 (B).
Figure 3.
Figure 3.. Ca2+ and target peptide binding affect the thermal stability of CHP3 and mCHP3.
Thermal stabilities of free proteins and complexes with the target peptide CBD were measured with nanoDSF in the presence of either 10 mM Mg2+, Ca2+, Ca2+ + Mg2+, or EDTA. Temperatures of thermal unfolding (apparent Tm) are shown as mean ± standard deviation (SD) of three independent biological replicates. Raw nanoDSF traces are shown in Figure 3—figure supplement 1.
Figure 3—figure supplement 1.
Figure 3—figure supplement 1.. Thermal unfolding of CHP3 (A), mCHP3 (B), CHP3:CBD (C), and mCHP3:CBD (D) shown as raw nanoDSF traces (left) and first derivatives (right) in the presence of either Mg2+, Ca2+, Mg2+ + Ca2+, or in the absence of both ions (EDTA).
Figure 4.
Figure 4.. Ca2+-binding and complex formation change the accessibility of trypsin cleavage sites in CHP3 and mCHP3.
(A) Time-dependent (0–60 min) limited proteolysis (trypsin) of CHP3 (top) and the complex of CHP3:CBD (bottom) in the presence of both Mg2+ and Ca2+. Positions of full-length protein (FL) and two major proteolytic fragments (1 and 2) as well as CBD are indicated on the right of the Coomassie-stained SDS–PAGE gel, positions of co-separated molecular mass standards (mass in kDa) – on the left; the sample containing only trypsin was loaded on the first lane (T); Figure 4—source data 1: Full gels of (A). (B) Time-dependent limited proteolysis of CHP3 and mCHP3 in the presence of Mg2+, Ca2+, both ions or in the absence of them. Sections of the gel with bands corresponding to the full-length protein (FL) and two major proteolytic fragments (1 and 2) are shown. Nearly no degradation was observed for CHP3 and mCHP3 in the complex with CBD in all conditions (Mg2+ + Ca2+ condition is presented here, other gels are shown in Figure 4—figure supplement 1B and its source data). (C) Schematic representation of full-length CHP3 with indication of N- and C-lobes, four EF-hand motifs (active EF-3 is highlighted in green). Proteolytic fragments 1 and 2 and trypsin cleavage sites were identified by mass spectrometry. (D) Combined ribbon and surface presentation of the CHP3 AlphaFold2.0 model (Varadi et al., 2022) with N- and C-lobes shown in blue and orange, respectively, and the connecting CHP-loop in cyan; the two major trypsin cleavage sites are highlighted in yellow and Ca2+ ion as a green sphere. The Ca2+ position in EF-3 was modelled by superimposition of the CHP3 model with the CHP1 X-ray structure, pdb ID 2ct9 (Andrade et al., 2004).
Figure 4—figure supplement 1.
Figure 4—figure supplement 1.. Limited trypsinolysis of CHP3 and mCHP3.
(A) Location of potential trypsin cleavage sites (Lys and Arg residues) in the CHP3 sequence. The two major sites, at which the cleavage is effective in the limited proteolysis are highlighted in red. (B) The full-size gels of limited proteolysis in different conditions. Proteins samples are indicated on the left, the ion conditions – on the top, trypsin only (T), or different CHP3 samples (CHP3, mCHP3, CHP3:CBD, or mCHP3:CBD) incubated with trypsin for 0, 5, 15, 30, 45, and 60 min were loaded from the left to the right. For a band annotation, see Figure 4A. Gels of CHP3 (MgCl2+CaCl2) and of CHP3:CBD (MgCl2+CaCl2) from Figure 4A (C) LC–ESI-TOF mass spectrometry analysis of major proteolytic fragments (1 and 2), the detected masses were 17,922 Da for the fragment 1 and 9630 Da for the fragment 2.
Figure 4—figure supplement 2.
Figure 4—figure supplement 2.. Multiple sequence alignment of human CHP1, CHP2, and CHP3.
CHP3 has one active EF-hand only, which is EF-3 (green box). EF-2 and EF-4 of CHP3 have 9-residue insertions, which disrupt the canonical Ca2+-coordinating loop, whereas EF-1 of CHP3 lacks the conservative negatively charged residues important for Ca2+ coordination (positions X, Y and –Z, respective CHP3 residues are S36, G37, and N46). EF-1, EF-2, and EF-4 that do not bind Ca2+ in CHP3 are shown in red rectangles. N-terminal myristoylation site is indicated with an arrow. Sequence alignment was done in BioEdit (Hall, 1999) using ClustalW algorithm.
Figure 5.
Figure 5.. Ca2+ binding and myristoylation independently affect the interaction between CHP3 and MBP-CBD as measured with microscale thermophoresis (MST).
The interaction of CHP3 (A, B) and mCHP3 (C, D) with MBP-CBD was measured with three biological replicates shown in different colours (each with five technical replicates) in the presence of either Ca2+ (A, C) or Mg2+ (B, D). The combined data from individual experiments were fitted with a one-site binding model using global non-linear regression. (E) 95% confidence intervals (Δχ2 of 3.84) of KD’s for CHP3:CBD and mCHP3:CBD calculated with profile likelihood method. Raw MST traces are shown in Figure 5—figure supplement 1.
Figure 5—figure supplement 1.
Figure 5—figure supplement 1.. Normalized microscale thermophoresis (MST) fluorescence timetraces of CHP3 and mCHP3 with MBP-CBD in the presence of either Mg2+ or Ca2+.
Each graph contains measurements of one biological replicate (indicated with label (1), (2), (3)) with five technical replicates.
Figure 6.
Figure 6.. The interaction of CHP3 and mCHP3 with liposomes is regulated by Ca2+ and target peptide binding.
Proteins were co-sedimented with POPC:POPS (3:1 molar ratio) liposomes in the presence of either 2 mM Mg2+ or 2 mM Mg2+ + 2 mM Ca2+ at 24°C. Non-myristoylated and myristoylated recoverin (Rec and mRec, respectively) were used as Ca2+-myristoyl switch control proteins. (A) Amount of proteins co-sedimented with liposomes was analysed with SDS–PAGE (4–12%, Bis-Tris). (B) Quantification of protein-liposome binding based on the densitometry of bands (SDS–PAGE shown in (A)) corresponded to the co-sedimented proteins with three biological (CHP3 and complexes) or technical (recoverin) replicates. Values were normalized to the respective non-myristoylated protein in the Mg2+-bound state. Data are shown as mean ± standard deviation (SD), one-way analysis of variance (ANOVA) with Tukey post-test was performed for mean comparison (statistical significance: n.s. – p > 0.05, **p < 0.01, ***p < 0.001). (C) N-terminal myristoylation of target-associated CHP3 in mouse brain. LC–MS/MS analysis of a trypsin-digested size fraction of solubilized mouse brain membrane containing NHE1-associated CHP3 (see Materials and methods). Upper panel: high coverage of the mouse CHP3 primary sequence by MS/MS-identified peptides (in red; black: sequences not identified, grey: sequences not accessible to our MS analysis) without inclusion of N-myristoyl modification. Lower panel: MS/MS spectrum from the same measurement assigned to the myristoylated tryptic N-terminal peptide of CHP3. Note that no other forms of the N-terminal peptide were detectable in error-tolerant search. Figure 6—source data 1: Full gels for (A) and replicates; raw data of band densitometry and ANOVA test p-values.
Figure 6—figure supplement 1.
Figure 6—figure supplement 1.. Sequence coverage and N-terminal myristoylation of endogenous CHP3.
LC–MS/MS analysis of trypsin-digested total membrane fraction obtained from mouse platelets. Upper panel: coverage of the mouse CHP3 primary sequence by MS-identified peptides (in red; black: sequences not identified, grey: sequences not accessible to our MS analysis) without inclusion of N-myristoyl modification. Lower panel: MS/MS spectrum from the same measurement assigned to the myristoylated tryptic N-terminal peptide of CHP3. No other modifications of the N-terminus were detectable in error-tolerant search.
Figure 7.
Figure 7.. Conformation of CHP3 is controlled by Ca2+ and target peptide (NHE1 CBD) binding.
Ca2+ (magenta) replaces Mg2+ (green) in EF-3 and induces the transition from the closed to the open conformation. Ca2+ binding affects the local flexibility in the N-lobe accelerating the tryptic cleavage and reduces the thermal stability of CHP3. In both, Ca2+- and Mg2+-bound states, CHP3 binds the target peptide CBD with nanomolar affinity (KD values indicated, in brackets for myristoylated CHP3). Complex formation has no effect on the thermal stability of the Mg2+-bound state (closed conformation), whereas it strongly enhances thermal stability of the Ca2+-bound state (open conformation). Independent of the bound ion, both trypsin cleavage sites are protected from proteolysis in the CHP3:CBD complex.
Figure 8.
Figure 8.. Target-myristoyl switch in CHP3.
N-terminal myristoylation of CHP3 by NMT1 increases the local flexibility in the N-lobe, as it accelerated its tryptic cleavage. The myristoyl moiety most likely binds weakly or transiently to the target-binding pocket in both Ca2+- and Mg2+-bound states, as myristoylation reduced twofold the affinity of CHP3 to CBD. CBD binding causes displacement from the hydrophobic pocket and the surface exposure of the myristoyl moiety resulting in enhanced CHP3 binding to lipid membranes in both Ca2+- and Mg2+-bound states.

Update of

  • doi: 10.1101/2022.09.23.509142

Similar articles

References

    1. Ames JB, Ishima R, Tanaka T, Gordon JI, Stryer L, Ikura M. Molecular mechanics of calcium-myristoyl switches. Nature. 1997;389:198–202. doi: 10.1038/38310. - DOI - PubMed
    1. Ammar YB, Takeda S, Hisamitsu T, Mori H, Wakabayashi S. Crystal structure of CHP2 complexed with NHE1-cytosolic region and an implication for pH regulation. The EMBO Journal. 2006;25:2315–2325. doi: 10.1038/sj.emboj.7601145. - DOI - PMC - PubMed
    1. Andrade J, Zhao H, Titus B, Timm Pearce S, Barroso M. The EF-hand Ca2+-binding protein p22 plays a role in microtubule and endoplasmic reticulum organization and dynamics with distinct Ca2+-binding requirements. Molecular Biology of the Cell. 2004;15:481–496. doi: 10.1091/mbc.e03-07-0500. - DOI - PMC - PubMed
    1. Bootman MD, Bultynck G. Fundamentals of cellular calcium signaling: A primer. Cold Spring Harbor Perspectives in Biology. 2020;12:a038802. doi: 10.1101/cshperspect.a038802. - DOI - PMC - PubMed
    1. Braun T, McIlhinney RA, Vergères G. Myristoylation-dependent N-terminal cleavage of the myristoylated alanine-rich C kinase substrate (MARCKS) by cellular extracts. Biochimie. 2000;82:705–715. doi: 10.1016/s0300-9084(00)01154-8. - DOI - PubMed

Publication types