Bidirectional Interactions between Green Tea (GT) Polyphenols and Human Gut Bacteria
- PMID: 37435870
- PMCID: PMC10619559
- DOI: 10.4014/jmb.2306.06014
Bidirectional Interactions between Green Tea (GT) Polyphenols and Human Gut Bacteria
Abstract
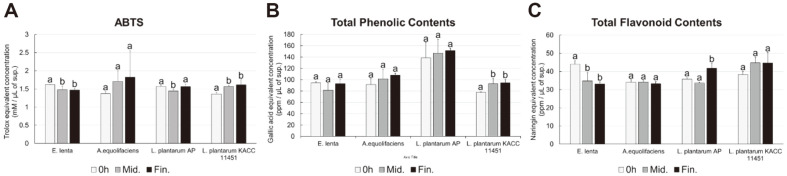
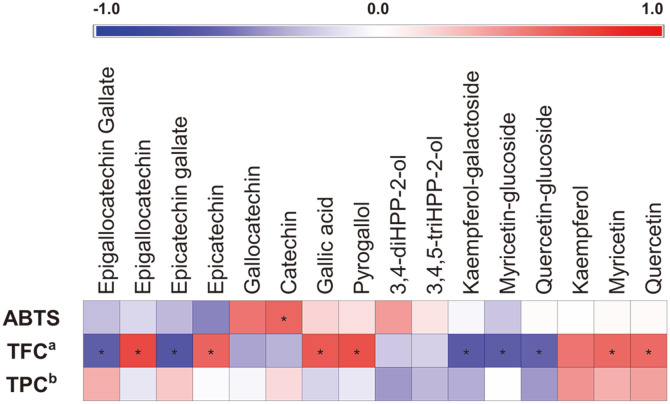
Green tea (GT) polyphenols undergo extensive metabolism within gastrointestinal tract (GIT), where their derivatives compounds potentially modulate the gut microbiome. This biotransformation process involves a cascade of exclusive gut microbial enzymes which chemically modify the GT polyphenols influencing both their bioactivity and bioavailability in host. Herein, we examined the in vitro interactions between 37 different human gut microbiota and the GT polyphenols. UHPLC-LTQ-Orbitrap-MS/MS analysis of the culture broth extracts unravel that genera Adlercreutzia, Eggerthella and Lactiplantibacillus plantarum KACC11451 promoted C-ring opening reaction in GT catechins. In addition, L. plantarum also hydrolyzed catechin galloyl esters to produce gallic acid and pyrogallol, and also converted flavonoid glycosides to their aglycone derivatives. Biotransformation of GT polyphenols into derivative compounds enhanced their antioxidant bioactivities in culture broth extracts. Considering the effects of GT polyphenols on specific growth rates of gut bacteria, we noted that GT polyphenols and their derivate compounds inhibited most species in phylum Actinobacteria, Bacteroides, and Firmicutes except genus Lactobacillus. The present study delineates the likely mechanisms involved in the metabolism and bioavailability of GT polyphenols upon exposure to gut microbiota. Further, widening this workflow to understand the metabolism of various other dietary polyphenols can unravel their biotransformation mechanisms and associated functions in human GIT.
Keywords: Gut microbiota; LC-MS/MS; biotransformation; green tea; polyphenols.
Conflict of interest statement
The authors have no financial conflicts of interest to declare.
Figures


Similar articles
-
Green Tea and Its Relation to Human Gut Microbiome.Molecules. 2021 Jun 26;26(13):3907. doi: 10.3390/molecules26133907. Molecules. 2021. PMID: 34206736 Free PMC article. Review.
-
Metabolites profiling reveals gut microbiome-mediated biotransformation of green tea polyphenols in the presence of N-nitrosamine as pro-oxidant.Food Chem. 2022 Mar 1;371:131147. doi: 10.1016/j.foodchem.2021.131147. Epub 2021 Sep 16. Food Chem. 2022. PMID: 34808759
-
Gut/Oral Bacteria Variability May Explain the High Efficacy of Green Tea in Rodent Tumor Inhibition and Its Absence in Humans.Molecules. 2020 Oct 16;25(20):4753. doi: 10.3390/molecules25204753. Molecules. 2020. PMID: 33081212 Free PMC article. Review.
-
Gut microbiota as a driver of the interindividual variability of cardiometabolic effects from tea polyphenols.Crit Rev Food Sci Nutr. 2023;63(11):1500-1526. doi: 10.1080/10408398.2021.1965536. Epub 2021 Sep 13. Crit Rev Food Sci Nutr. 2023. PMID: 34515591 Review.
-
Biological fates of tea polyphenols and their interactions with microbiota in the gastrointestinal tract: implications on health effects.Crit Rev Food Sci Nutr. 2020;60(16):2691-2709. doi: 10.1080/10408398.2019.1654430. Epub 2019 Aug 26. Crit Rev Food Sci Nutr. 2020. PMID: 31446775 Review.
Cited by
-
Innovative Application of Fermented Red Bean Seeds in Constructing Foods with Increased Biological Activity.Foods. 2025 Jan 1;14(1):88. doi: 10.3390/foods14010088. Foods. 2025. PMID: 39796380 Free PMC article.
-
Effects of Differently Processed Tea on the Gut Microbiota.Molecules. 2024 Aug 25;29(17):4020. doi: 10.3390/molecules29174020. Molecules. 2024. PMID: 39274868 Free PMC article. Review.
-
(Poly)phenol-gut microbiota interactions and their impact on human health.Curr Opin Clin Nutr Metab Care. 2025 Jul 1;28(4):316-322. doi: 10.1097/MCO.0000000000001132. Epub 2025 Apr 28. Curr Opin Clin Nutr Metab Care. 2025. PMID: 40293967 Free PMC article. Review.
-
Comparative studies on the antioxidant, anticancer and anti-inflammatory activities of green tea, orthodox black tea and CTC black tea.J Food Sci Technol. 2024 Jul;61(7):1315-1325. doi: 10.1007/s13197-023-05900-2. Epub 2023 Dec 19. J Food Sci Technol. 2024. PMID: 38910922 Free PMC article.
-
Bacterial Growth Modulatory Effects of Two Branched-Chain Hydroxy Acids and Their Production Level by Gut Microbiota.J Microbiol Biotechnol. 2024 Jun 28;34(6):1314-1321. doi: 10.4014/jmb.2404.04009. Epub 2024 May 10. J Microbiol Biotechnol. 2024. PMID: 38938006 Free PMC article.
References
MeSH terms
Substances
LinkOut - more resources
Full Text Sources
Medical
Molecular Biology Databases
Miscellaneous