Impact of pretransplantation malnutrition risk on the clinical outcome and graft survival of kidney transplant patients
- PMID: 37435886
- PMCID: PMC10726658
- DOI: 10.1590/2175-8239-JBN-2022-0150en
Impact of pretransplantation malnutrition risk on the clinical outcome and graft survival of kidney transplant patients
Erratum in
-
Erratum: Impact of pretransplantation malnutrition risk on the clinical outcome and graft survival of kidney transplant patients.J Bras Nefrol. 2024 Apr-Jun;46(2):e20220150er. doi: 10.1590/2175-8239-JBN-2022-0150eren. J Bras Nefrol. 2024. PMID: 38134297 Free PMC article.
Abstract
Background: The prevalence of malnourished patients before transplantation and the influence of malnutrition on graft and patient outcomes remain underestimated, despite being associated with higher postoperative morbidity and mortality. This study aimed to develop an easy nutritional screening tool and evaluate the impact of nutritional status on clinical outcome, graft survival (GS) and mortality risk in kidney transplant patients (KTP).
Methods: In this retrospective cohort study including 451 KTP, we developed a score by using anthropometric, clinical, and laboratory measures performed in the pretransplant evaluation. The patients were stratified into 3 groups according to the final score: G1 (0 or 1 point)=low risk, G2 (2 to 4 points)=moderate risk, and G3 (>5 points)=high risk of malnutrition. The patients were monitored after transplantation at least 1 to 10 years.
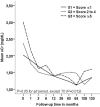
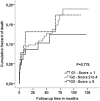
Results: Stratifying the 451 patients based on the pretransplant risk score, G1, G2, and G3 were composed of 90, 292, and 69 patients, respectively. Patients from G1 maintained the lowest serum creatinine levels at hospital discharge when compared with others (p = 0.012). The incidence of infection in the patients from G3 was higher than patients from G1 and G2 (p = 0.030). G3 recipients showed worse GS than G1 patients (p = 0.044). G3 patients showed almost threefold higher risk for graft loss (HR 2.94, 95% CI 1.084-7.996).
Conclusions: KTP with higher malnutrition risk score were associated with worse outcomes and GS. The nutritional screening tool is easy to be used in clinical practice to evaluate the patient in preparation for kidney transplant.
Antecedentes:: A prevalência de pacientes desnutridos antes do transplante e a influência da desnutrição nos desfechos do enxerto e do paciente permanecem subestimadas, embora estejam associadas a maior morbimortalidade pós-operatória. Este estudo buscou desenvolver uma ferramenta simples de triagem nutricional e avaliar o impacto do estado nutricional no desfecho clínico, sobrevida do enxerto (SE) e risco de mortalidade em pacientes transplantados renais (PTR).
Métodos:: Neste estudo de coorte retrospectivo incluindo 451 PTR, desenvolvemos um escore usando medidas antropométricas, clínicas e laboratoriais tomadas na avaliação pré-transplante. Os pacientes foram estratificados em 3 grupos segundo a pontuação final: G1 (0-1 ponto) = baixo risco, G2 (2-4 pontos) = risco moderado e G3 (>5 pontos) = alto risco de desnutrição. Eles foram monitorados por pelo menos 1 a 10 anos após o transplante.
Resultados:: Os 451 pacientes foram estratificados em G1, G2 e G3, que consistiram em 90, 292 e 69 pacientes, respectivamente. Os pacientes do G1 mantiveram os menores níveis de creatinina sérica na alta hospitalar em relação aos demais (p = 0,012). A incidência de infecção nos pacientes do G3 foi maior que nos pacientes do G1 e G2 (p = 0,030). Os pacientes do G3 apresentaram SE pior do que os pacientes do G1 (p = 0,044) e um risco quase três vezes maior de perda do enxerto (HR 2,94; IC 95% 1,084-7,996).
Conclusões:: PTR com maior escore de risco de desnutrição foram associados a piores desfechos e menor SE. A ferramenta de triagem nutricional é fácil de usar na prática clínica para avaliar pacientes em preparação para transplante renal.
Conflict of interest statement
Figures
References
-
- Carrero JJ, Thomas F, Nagy K, Arogundade F, Avesani CM, Chan M, et al. Global prevalence of protein-energy wasting in kidney disease: a meta-analysis of contemporary observational studies from the International Society of Renal Nutrition and Metabolism. J Ren Nutr. 2018;28(6):380–92. doi: 10.1053/j.jrn.2018.08.006. - DOI - PubMed
MeSH terms
LinkOut - more resources
Full Text Sources
Medical


