. 2023 Sep;38(9):1350-1363.
doi: 10.1002/jbmr.4882. Epub 2023 Jul 27.

Single-Cell Transcriptomics of Bone Marrow Stromal Cells in Diversity Outbred Mice: A Model for Population-Level scRNA-Seq Studies

Affiliations

Single-Cell Transcriptomics of Bone Marrow Stromal Cells in Diversity Outbred Mice: A Model for Population-Level scRNA-Seq Studies

Luke J Dillard et al. J Bone Miner Res. 2023 Sep.

Abstract

Genome-wide association studies (GWASs) have advanced our understanding of the genetics of osteoporosis; however, the challenge has been converting associations to causal genes. Studies have utilized transcriptomics data to link disease-associated variants to genes, but few population transcriptomics data sets have been generated on bone at the single-cell level. To address this challenge, we profiled the transcriptomes of bone marrow-derived stromal cells (BMSCs) cultured under osteogenic conditions from five diversity outbred (DO) mice using single-cell RNA-seq (scRNA-seq). The goal of the study was to determine if BMSCs could serve as a model to generate cell type-specific transcriptomic profiles of mesenchymal lineage cells from large populations of mice to inform genetic studies. By enriching for mesenchymal lineage cells in vitro, coupled with pooling of multiple samples and downstream genotype deconvolution, we demonstrate the scalability of this model for population-level studies. We demonstrate that dissociation of BMSCs from a heavily mineralized matrix had little effect on viability or their transcriptomic signatures. Furthermore, we show that BMSCs cultured under osteogenic conditions are diverse and consist of cells with characteristics of mesenchymal progenitors, marrow adipogenic lineage precursors (MALPs), osteoblasts, osteocyte-like cells, and immune cells. Importantly, all cells were similar from a transcriptomic perspective to cells isolated in vivo. We employed scRNA-seq analytical tools to confirm the biological identity of profiled cell types. SCENIC was used to reconstruct gene regulatory networks (GRNs), and we observed that cell types show GRNs expected of osteogenic and pre-adipogenic lineage cells. Further, CELLECT analysis showed that osteoblasts, osteocyte-like cells, and MALPs captured a significant component of bone mineral density (BMD) heritability. Together, these data suggest that BMSCs cultured under osteogenic conditions coupled with scRNA-seq can be used as a scalable and biologically informative model to generate cell type-specific transcriptomic profiles of mesenchymal lineage cells in large populations. © 2023 The Authors. Journal of Bone and Mineral Research published by Wiley Periodicals LLC on behalf of American Society for Bone and Mineral Research (ASBMR).

Keywords: OSTEOBLASTS; OSTEOCYTES; OSTEOPOROSIS; STROMAL/STEM CELLS; SYSTEMS BIOLOGY - OTHER.


Conflict of interest statement

Disclosure Statement / Conflict of Interest

The authors declare that they have no conflicts of interest with the contents of this article.

Figures

Figure 1:
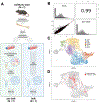
Figure 1:. ScRNA-seq of BMSC-OBs identifies multiple cell-types.
A) Uniform Manifold Approximation and Projection (UMAP) cell clusters of 7357 single BMSC-OBs isolated from five Diversity Outbred (DO) mice. Cell numbers and corresponding percentages are listed in parenthesis to the right of the annotated cluster name. LMP: late mesenchymal progenitor cells; MALP: marrow adipogenic lineage precursors; OBP: osteoblast progenitor cells; OB: osteoblasts; Ocy: osteocyte-like cells; Hem: Hematopoietic lineage cells. B) Dot plot(54) of some of the most highly expressed genes for all annotated cell clusters. The size of the dots are proportional to the percentage of cells of a given cluster that express a given gene while the color of the dot corresponds to the scaled average gene expression. C) Feature plots portraying the normalized expression of select marker genes associated with each cell cluster.
Figure 2:
Figure 2:. Liberation of single cells from a heavily mineralized matrix in vitro has minimal impact on transcriptomic signatures of BMSC-OBs.
A) Flow chart diagram portraying the design of the bulk vs. pooled single cell-bulk (psc-bulk) experiment in C57BL/6J mice (N=7). Cultured BMSC-OBs were harvested and underwent either immediate RNA extraction (bulk) or the single-cell isolation procedure, pooled, and then subsequent RNA extraction (psc-bulk). Extracted RNA from both conditions was sequenced via traditional RNA-seq. Created with BioRender.com. B) RNA read counts for the bulk and psc-bulk gene expression profiles were converted to counts per million (CPM) values, log2-transformed, and the average for each gene was calculated across all samples within each group (bulk and psc-bulk). Correlation (R=0.99, P<2.2 × 10⁻¹⁶) was performed using the subset of genes shared between the two profiles (N = 17,924). C) ScRNA-seq UMAP clusters of BMSC-OBs derived from the five DO mice after removal of differentially expressed genes (identified from the psc-bulk vs. bulk experiment, 684 total genes) from the scRNA-seq count matrix. D) Cells highlighted in red represent those that changed from their original cell cluster annotation as a result of removal of DEGs (8.1% of cells).
Figure 3:
Figure 3:. ScRNA-seq of BMSC-OB and scRNA-seq data derived from cells harvested in vivo cluster together and have few transcriptomic differences.
A) Overlap of 13,310 single cells in UMAP space after integration of both the BMSC-OBs and Zhong et al. (2020) scRNA-seq datasets. Integration was performed using Canonical Correlation Analysis (CCA) and using only the osteogenic and adipogenic lineage cells from each dataset as input. The integrated data was processed in the same fashion as the BMSC-OBs scRNA-seq data (Methods) and clustered at a resolution of 0.22 (Supplemental Figure 5). B) UMAPs of the integrated data and split based on dataset origin (BMSC-OBs or Zhong et al. (2020)). Cells are labeled with their original cell annotations from either BMSC-OBs or Zhong et al. (2020) datasets. C) Bar chart representing the proportion of each annotated cell cluster in the integrated data based on dataset origin (BMSC-OBs or Zhong et al. (2020).
Figure 4:
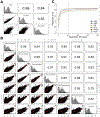
Figure 4:. Transcriptomic profiles of individual cell-types from scRNA-seq of BMSC-OBs are robust and representative of bulk RNA-seq data.
A) Correlations between the bulk, pooled single cell-bulk (psc-bulk), and pseudobulk gene expression profiles. A pseudobulk (PB) profile was generated from the entire BMSC-OB scRNA-seq dataset by aggregating Unique Molecular Identifier (UMI) counts, converting to counts per million (CPM), and log2-transforming the counts. Counts for the PB, bulk, psc-bulk gene expression profiles were performed using the subset of genes shared between all three profiles (N = 13,920). B) Correlations between the psc-bulk and cell-type specific PB gene expression profiles. Cell-type specific PB profiles were generated for individual cell clusters in the same fashion described above. C) Correlations between psc-bulk and cell-type specific PB profiles generated using different numbers of sampled cells. Cell-type specific PB profiles were generated from random sampling of cells from the cell-type cluster. Eight samples were taken, ranging in size from 2 to 400 cells, and profiles were correlated to the psc-bulk profile.
Figure 5:
Figure 5:. Cell-type frequencies captured by scRNA-seq are highly variable across individual DO mice.
A) Uniform Manifold Approximation and Projection (UMAP) of cell clusters of the BMSC-OB scRNA-seq dataset split based on the five Diversity Outbred (DO) mice (12, 45, 48, 50, 84). B) Stacked bar chart representing the proportion of each cell-type derived from each mouse.
Figure 6:
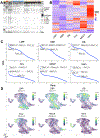
Figure 6:. SCENIC gene regulatory network (GRN) analysis reveals expected transcriptomic activity and validates the identities of cell-types in BMSC-OBs.
A) Binarized heatmap SCENIC regulon activity results, where “1” indicates active regulons; “0” indicates inactive regulons. B) Heatmap of SCENIC results portraying the scaled average for regulon activity in each annotated cell cluster, where the color key from blue to red indicates activity levels from low to high, respectively. C) Plots of the top five regulons with the highest specificity score (RSS) for each cell cluster. RSS is quantified from 0 to 1, where “1” indicates the activity of a regulon is exclusively specific to one cell-type, while “0” indicates the lowest level of exclusivity. D) Cell density plots portraying the regulon-weighted kernel density of select regulons for each cell cluster. Cell density is weighted by the activity of a given regulon in the single cells. Plots represent regulon activity by leveraging signal from cells that are more likely to have a given regulon active in their neighboring cells.(55)

References

    1. Lin JT, Lane JM. Osteoporosis: a review. Clin Orthop Relat Res. 2004. Aug;(425):126–34. - PubMed
    1. Peacock M, Turner CH, Econs MJ, Foroud T. Genetics of osteoporosis. Endocr Rev. 2002. Jun;23(3):303–26. - PubMed
    1. Morris JA, Kemp JP, Youlten SE, Laurent L, Logan JG, Chai RC, et al. An atlas of genetic influences on osteoporosis in humans and mice. Nat Genet. 2019. Feb;51(2):258–66. - PMC - PubMed
    1. Zhu X, Bai W, Zheng H. Twelve years of GWAS discoveries for osteoporosis and related traits: advances, challenges and applications. Bone Res. 2021. Apr 29;9(1):23. - PMC - PubMed
    1. Tam V, Patel N, Turcotte M, Bossé Y, Paré G, Meyre D. Benefits and limitations of genome-wide association studies. Nat Rev Genet. 2019. Aug;20(8):467–84. - PubMed

Publication types