. 2023 Aug 31;14(4):e0100823.
doi: 10.1128/mbio.01008-23. Epub 2023 Jul 12.

Hepatitis delta virus RNA decline post-inoculation in human NTCP transgenic mice is biphasic

Affiliations

Hepatitis delta virus RNA decline post-inoculation in human NTCP transgenic mice is biphasic

Stephanie Maya et al. mBio. .

Abstract

Chronic infection with hepatitis B and delta viruses (HDV) is the most serious form of viral hepatitis due to more severe manifestations of an accelerated progression to liver fibrosis, cirrhosis, and hepatocellular carcinoma. We characterized early HDV kinetics post-inoculation and incorporated mathematical modeling to provide insights into host-HDV dynamics. We analyzed HDV RNA serum viremia in 192 immunocompetent (C57BL/6) and immunodeficient (NRG) mice that did or did not transgenically express the HDV receptor-human sodium taurocholate co-transporting polypeptide (hNTCP). Kinetic analysis indicates an unanticipated biphasic decline consisting of a sharp first-phase and slower second-phase decline regardless of immunocompetence. HDV decline after re-inoculation again followed a biphasic decline; however, a steeper second-phase HDV decline was observed in NRG-hNTCP mice compared to NRG mice. HDV-entry inhibitor bulevirtide administration and HDV re-inoculation indicated that viral entry and receptor saturation are not major contributors to clearance, respectively. The biphasic kinetics can be mathematically modeled by assuming the existence of a non-specific-binding compartment with a constant on/off-rate and the steeper second-phase decline by a loss of bound virus that cannot be returned as free virus to circulation. The model predicts that free HDV is cleared with a half-life of 35 minutes (standard error, SE: 6.3), binds to non-specific cells with a rate of 0.05 per hour (SE: 0.01), and returns as free virus with a rate of 0.11 per hour (SE: 0.02). Characterizing early HDV-host kinetics elucidates how quickly HDV is either cleared or bound depending on the immunological background and hNTCP presence. IMPORTANCE The persistence phase of HDV infection has been studied in some animal models; however, the early kinetics of HDV in vivo is incompletely understood. In this study, we characterize an unexpectedly HDV biphasic decline post-inoculation in immunocompetent and immunodeficient mouse models and use mathematical modeling to provide insights into HDV-host dynamics.

Keywords: animal model; hepatitis B virus; hepatitis delta virus; mathematical modeling; viral hepatitis.


Conflict of interest statement

The authors declare no conflict of interest.

Figures

Fig 1
Fig 1
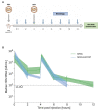
Single injection of HDV in C57BL/6-hNTCP or non-hNTCP mice and NRG-hNTCP or non-hNTCP mice. (A) Schematic of C57BL/6 and NRG non-hNTCP or hNTCP mice infected with HDV and bled every 2 hours for the first 24 hours. Viral RNA was quantified from the serum by RT-qPCR. The schematic was created with Biorender.com. (B) Serum HDV RNA quantification over the first 12 hours of infection in C57BL/6 and NRG non-hNTCP or hNTCP mice. (C) Median serum HDV RNA for all HDV-naive (first inoculation if applicable, including mice that were re-inoculated at 4 and 12 hours, but their data are cut off before second inoculation) NRG and NRG-hNTCP mice, along with linear regressions and shaded 95% confidence intervals. LLoQ indicates the lower limit of quantification (1,000 GE/mL). The second-phase decline is significantly steeper in NRG-hNTCP mice than in NRG mice [P = 0.05, analysis of covariance (ANCOVA) test]. All data points are represented as medians, with error bars representing interquartile range (IQR). The number of mice summarized by each point for NRG mice is shown in (C) green above the lines, and the number for NRG-hNTCP mice is shown in blue below the lines. Each timepoint for both C57BL/6 and C57BL/6-hNTCP represents the median of six mice, except for hour 12 which represents three mice.
Fig 2
Fig 2
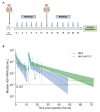
Bulevirtide (BLV) treatment 1 hour prior to single injection of HDV in NRG-hNTCP or non-hNTCP mice. (A) Schematic of NRG non-hNTCP or hNTCP mice pre-treated with bulevirtide and subsequently injected with HDV, followed by bleedings every 2 hours for the first 24 hours. Viral RNA was quantified from the serum by RT-qPCR. The schematic was created with Biorender.com. (B) Serum HDV RNA quantification over the first 12 hours of infection in HDV-infected NRG, NRG-hNTCP, or bulevirtide-treated NRG-hNTCP (NRG-hNTCP + BLV) mice. Linear regression confidences are displayed as shaded 95% confidence intervals. LLoQ indicates the lower limit of quantification (1,000 GE/mL). All data points are represented as medians, with error bars representing IQR. Each timepoint for each of the NRG, NRG-hNTCP, and NRG-hNTCP + BLV series is the median of three mice.
Fig 3
Fig 3
Re-injection of HDV in NRG-hNTCP mice 4 hours post-initial infection. (A) Schematic of NRG and NRG-hNTCP mice injected with HDV at time zero and 4 hpi and bled every 2 hours for the first 24 hours. Viral RNA was quantified from the serum by RT-qPCR. The schematic was created with Biorender.com. (B) Median serum HDV RNA quantification over the first 12 hours of infection in NRG and NRG-hNTCP mice, along with linear regressions and shaded 95% confidence intervals. LLoQ indicates the lower limit of quantification (1,000 GE/mL). All data points are represented as medians, with error bars representing IQR. Each timepoint in both the NRG and NRG-hNTCP time series represents the median value of three mice.
Fig 4
Fig 4
Re-injection of HDV in NRG and NRG-hNTCP mice 12 hours post-initial infection. (A) Schematic of NRG and NRG-hNTCP mice injected with HDV at time zero and 12 hpi and bled every 2 hours for the first 24 hours. Viral RNA was quantified from the serum by RT-qPCR. A schematic was created with Biorender.com. (B) Serum HDV RNA quantification over all 72 hours of infection in NRG and NRG-hNTCP mice and linear regressions with shaded 95% confidence intervals. LLoQ indicates the lower limit of quantification (1,000 GE/mL). The second-phase decline after the second inoculation is significantly steeper in NRG-hNTCP mice than in NRG mice (P = 0.02, ANCOVA test). Slope comparisons for the first inoculation are presented in Fig. 1. All data points are represented as medians, with error bars representing IQR. Each timepoint is representative of three mice.
Fig 5
Fig 5
Binding compartment mathematical modeling. (A) Schematic of mathematical model: Vf is the free-roaming virions and Vb is the cell-bound HDV. Free virus enters circulation by being released from a non-specific binding cell with rate constant koff and is removed from circulation at a general clearance rate c , as well as by being bound to a cell at rate constant kon . The cell-bound Vb shrinks as it is released from the binding cell at rate constant koff or as it is lost with rate kl only in the transgenic NRG-hNTCP mice. (B) Model equation. Here, Rt is a pulse function with the form R(t)={10r,tin<t<tin+0.10,otherwise , with tin the time of inoculation or re-inoculation of HDV (0, 4, or/and 12 hours) and r the orders of magnitude by which cell-free HDV increases during the inoculation or re-inoculation of the virus. (C) Model simulations indicate that the speed and time of the first phase of decline are primarily affected by the HDV clearance rate (top-left) and the binding on-rate (top-right). The second phase of decline is primarily affected by the binding off-rate (bottom-left) and internalization rate parameters (bottom-right). Model parameters in each graph are fixed at: kon = 0.07 per day, koff = 0.22 per day, kl = 0.1 per day, c = 3.71 per day (black curve). Adjustments made to each parameter are shown in red (underestimate) and blue (overestimate), for illustrative purposes.
Fig 6
Fig 6
Best mathematical model fits of NRG mice using the maximum likelihood estimates (MLEs) of the population parameter distributions. Best model fits for some of the HDV concentrations (GE/mL) from the NRG mice in the presence or absence of HDV re-inoculation at 12 hours after infection. Dotted horizontal line is the lower limit of quantification (LLoQ). Dark blue circles are data from NRG mice, filled circles are data above LLoQ and empty circles are data below the LLoQ, respectively. Individual parameter estimates are given in Table. S1. See Materials and Methods in the supplementary information for details of the assumptions for population distributions.
Fig 7
Fig 7
Best mathematical model fits of NRG-hNTCP mice using the maximum likelihood estimates (MLEs) of the population parameter distributions. Best model fits for the HDV concentrations (GE/mL) from NRG-hNTCP mice in the presence or absence of HDV re-inoculation at 12 hours after infection. Dotted horizontal line is the lower limit of quantification (LLoQ). Light blue circles are data from NRG-hNTCP mice, filled circles are data above LLoQ and empty circles are data below the LLoQ, respectively. Individual parameter estimates are in Table S2. See Materials and Methods in the supplementary information for details of the assumptions for population distributions.

Update of

References

    1. Lempp FA, Schlund F, Rieble L, Nussbaum L, Link C, Zhang Z, Ni Y, Urban S. 2019. Recapitulation of HDV infection in a fully permissive hepatoma cell line allows efficient drug evaluation. Nat Commun 10:2265. doi:10.1038/s41467-019-10211-2 - DOI - PMC - PubMed
    1. Abou-Jaoudé G, Sureau C. 2007. Entry of hepatitis delta virus requires the conserved cysteine residues of the hepatitis B virus envelope protein antigenic loop and is blocked by inhibitors of thiol-disulfide exchange. J Virol 81:13057–13066. doi:10.1128/JVI.01495-07 - DOI - PMC - PubMed
    1. Chen HY, Shen DT, Ji DZ, Han PC, Zhang WM, Ma JF, Chen WS, Goyal H, Pan S, Xu HG. 2019. Prevalence and burden of hepatitis D virus infection in the global population: a systematic review and meta-analysis. Gut 68:512–521. doi:10.1136/gutjnl-2018-316601 - DOI - PubMed
    1. Rizzetto M, Canese MG, Aricò S, Crivelli O, Trepo C, Bonino F, Verme G. 1977. Immunofluorescence detection of new antigen-antibody system (delta/anti-delta) associated to hepatitis B virus in liver and in serum of HBsAg carriers. Gut 18:997–1003. doi:10.1136/gut.18.12.997 - DOI - PMC - PubMed
    1. Ni Y, Lempp FA, Mehrle S, Nkongolo S, Kaufman C, Fälth M, Stindt J, Königer C, Nassal M, Kubitz R, Sültmann H, Urban S. 2014. Hepatitis B and D viruses exploit sodium taurocholate co-transporting polypeptide for species-specific entry into hepatocytes. Gastroenterology 146:1070–1083. doi:10.1053/j.gastro.2013.12.024 - DOI - PubMed

Publication types