. 2023 Aug 17;11(4):e0101723.
doi: 10.1128/spectrum.01017-23. Epub 2023 Jul 12.

Selective Pressure by Rifampicin Modulates Mutation Rates and Evolutionary Trajectories of Mycobacterial Genomes

Affiliations

Selective Pressure by Rifampicin Modulates Mutation Rates and Evolutionary Trajectories of Mycobacterial Genomes

E Cebrián-Sastre et al. Microbiol Spectr. .

Abstract

Resistance to the frontline antibiotic rifampicin constitutes a challenge to the treatment and control of tuberculosis. Here, we analyzed the mutational landscape of Mycobacterium smegmatis during long-term evolution with increasing concentrations of rifampicin, using a mutation accumulation assay combined with whole-genome sequencing. Antibiotic treatment enhanced the acquisition of mutations, doubling the genome-wide mutation rate of the wild-type cells. While antibiotic exposure led to extinction of almost all wild-type lines, the hypermutable phenotype of the ΔnucS mutant strain (noncanonical mismatch repair deficient) provided an efficient response to the antibiotic, leading to high rates of survival. This adaptative advantage resulted in the emergence of higher levels of rifampicin resistance, an accelerated acquisition of drug resistance mutations in rpoB (β RNA polymerase), and a wider diversity of evolutionary pathways that led to drug resistance. Finally, this approach revealed a subset of adaptive genes under positive selection with rifampicin that could be associated with the development of antibiotic resistance. IMPORTANCE Rifampicin is the most important first-line antibiotic against mycobacterial infections, including tuberculosis, one of the top causes of death worldwide. Acquisition of rifampicin resistance constitutes a major global public health problem that makes the control of the disease challenging. Here, we performed an experimental evolution assay under antibiotic selection to analyze the response and adaptation of mycobacteria, leading to the acquisition of rifampicin resistance. This approach explored the total number of mutations that arose in the mycobacterial genomes under long-term rifampicin exposure, using whole-genome sequencing. Our results revealed the effect of rifampicin at a genomic level, identifying different mechanisms and multiple pathways leading to rifampicin resistance in mycobacteria. Moreover, this study detected that an increase in the rate of mutations led to enhanced levels of drug resistance and survival. In summary, all of these results could be useful to understand and prevent the emergence of drug-resistant isolates in mycobacterial infections.

Keywords: DNA repair; Mycobacterium; Mycobacterium smegmatis; antibiotic resistance; drug resistance evolution; evolution; experimental evolution; mutation; mutation accumulation; rifampicin.


Conflict of interest statement

The authors declare no conflict of interest.

Figures
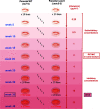
FIG 1
FIG 1
MA experimental evolution with increasing concentrations of rifampicin. The MA assay comprised 40 independent lines, generated from the M. smegmatis wild type and its nucS-null (ΔnucS) mutant derivative (20 each) and evolved in parallel with increasing antibiotic concentrations. The experimental evolution was carried out for 40 weeks, from 0.25 μg mL−1 rifampicin (subinhibitory concentration) until 32 μg mL−1 rifampicin (inhibitory concentration), doubling the concentration every 5 weeks. MA lines able to grow at week 35 with 16 μg mL−1 rifampicin (18 wild type-derived and 20 ΔnucS mutant-derived) were sequenced by WGS. The figure also shows the number of lines that survived at each rifampicin concentration (below the plates) and the number of passages (black arrows). Created with BioRender.com.
FIG 2
FIG 2
Mutational signature of the MA lines evolved with rifampicin. (A) Proportion of BPSs, deletions, and insertions in the MA lines (wild type and ΔnucS mutant). Percentages were calculated with respect to the total number of mutations obtained by WGS. The Mann-Whitney U test was used to compare the percentages of each mutation type between strains for BPSs (P < 0.001) and indels (P < 0.001). (B) Relative proportion of the six types of BPSs in the MA lines (wild type and ΔnucS mutant). Percentages were calculated with respect to the total number of BPSs obtained by WGS. The Mann-Whitney U test was used to compare the percentages of each mutation type between strains for transitions (P < 0.001) and transversions (P < 0.001). Bars are divided in portions with different colors according to the type of mutation, as follows: BPSs in yellow, indels in purple, transitions in greeny blue, and transversions in orange.
FIG 3
FIG 3
Mutation rates (total mutations, BPSs, and indels) in the presence and absence of rifampicin. Box plots show the comparison between mutation rates of MA lines evolved with rifampicin (+Rif) (this study) and without antibiotic (−Rif) (17). The rates of total mutations, BPSs, and indels are shown for the wild-type (A to C) (−Rif, light blue; +Rif, dark blue) and ΔnucS mutant (D to F) (−Rif, light orange; +Rif, dark orange) strains, respectively. Dots represent the mutation rate of each independent MA line. The mean of each mutation rate is indicated with a white diamond. P values (t test) are shown for each graph. t tests were complemented with Mann-Whitney U tests (see Table S5), as data for some types of mutations are nonparametric, although they are close to normality.
FIG 4
FIG 4
Comparison of the mutational spectra of the MA lines evolved in the presence and absence of rifampicin. (A) Mutational spectra for M. smegmatis wild-type lines evolved with rifampicin (dark blue) and without antibiotic (light blue); (B) mutational spectra for M. smegmatis ΔnucS lines evolved in the presence (dark orange) and absence of rifampicin (light orange). Bars represent the mutation rate per nucleotide per generation for each type of DNA mutation obtained by WGS data of MA experiments from this study and our previous work (17). Error bars indicate 95% confidence intervals (CIs). *, P < 0.05 (t test). t tests were complemented with Mann-Whitney U tests (see Table S5), as data for some types of mutations are nonparametric, although they are close to normality.
FIG 5
FIG 5
Levels of resistance to rifampicin in the MA lines during experimental evolution under antibiotic selection. The frequency (percentage) of wild-type (left) and ΔnucS mutant (right) lines with different levels of resistance to rifampicin through the time (in weeks) is shown. Percentages were calculated with respect to the total number of surviving lines in each week (n). The MIC values used to define the levels of rifampicin resistance were as follows: no resistance, 1 to 2 μg mL−1 (gray); low resistance, 4 to 16 μg mL−1 (light red); intermediate resistance, 32 to 128 μg mL−1 (medium red); and high resistance, 256 to 1,024 μg mL−1 (dark red). The numbers shown in red below the graphs indicate the rifampicin concentration used at the corresponding week. Statistically significant differences were observed in the distribution of resistance levels between strains (P < 0.001; Pearson’s χ2).
FIG 6
FIG 6
Acquisition of rpoB mutations in the MA lines evolved with rifampicin. (A) Dynamics of the total number of rpoB mutations in the MA experiment. Bars show the total number of rpoB mutations that accumulated all of the MA lines through the time. (B) Dynamics of the total number of lines with rpoB mutations in the MA experiment. Bars represent the number of lines containing rpoB mutations though the time (in weeks). Dots of the line plot represent the number of surviving lines (wild type, blue; ΔnucS mutant, orange). The numbers shown in red below the graphs indicate the rifampicin concentration used at the corresponding week. Statistically significant differences were observed in the distribution of lines with rpoB mutations between strains (P < 0.001; Pearson’s χ2).
FIG 7
FIG 7
Mutations in rpoB in the MA lines: identification and effect on antibiotic resistance. (A) Types of RNAP β substitutions generated by rpoB mutations. M. smegmatis RNAP β is represented with amino acid numbering. Gray regions indicate the rifampicin resistance clusters described in E. coli (20, 23). Amino acid substitutions generated by rpoB mutations in the MA lines are shown in blue (wild-type lines) and orange (ΔnucS mutant lines). Mutations associated with resistance in M. tuberculosis by the WHO catalogue (26) are marked with asterisks. Below are shown protein alignments of RNAP β of M. smegmatis (Msm), M. tuberculosis (Mtb), and E. coli, with the amino acid positions where mutations were detected (red). (B) Effect of RNAP β substitutions on rifampicin resistance. Bars show the rifampicin MIC of the MA lines before (light purple) and after (dark purple) the acquisition of each rpoB mutation. When the rpoB mutation was present in more than one line (H442R and G450D), a representative example is shown. *, S438L substitution appeared together with V167M at the same week of the evolution.
FIG 8
FIG 8
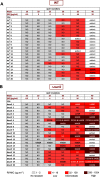
Evolutionary trajectories of the MA lines. (A) Pathways to acquire rifampicin resistance in the MA wild-type lines; (B) pathways to acquire rifampicin resistance in the MA ΔnucS mutant lines. The tables show the emergence of rpoB mutations in each MA line during the experimental evolution (in weeks). Levels of rifampicin resistance of the evolved lines are indicated according to their MIC values, with the following color code: no resistance, 1 to 2 μg mL−1 (gray); low resistance, 4 to 16 μg mL−1 (light red); intermediate resistance, 32 to 128 μg mL−1 (medium red); and high resistance, 256 to 1,024 μg mL−1 (dark red).

Similar articles

Cited by

References

    1. O’Neill J. 2014. Antimicrobial resistance: tackling a crisis for the health and wealth of nations. Review on antimicrobial resistance. https://amr-review.org/sites/default/files/AMR%20Review%20Paper%20-%20Ta....
    1. Davies J. 1994. Inactivation of antibiotics and the dissemination of resistance genes. Science 264:375–382. doi: 10.1126/science.8153624. - DOI - PubMed
    1. Blázquez J. 2003. Hypermutation as a factor contributing to the acquisition of antimicrobial resistance. Clin Infect Dis 37:1201–1209. doi: 10.1086/378810. - DOI - PubMed
    1. Rosenberg SM. 2001. Evolving responsively: adaptive mutation. Nat Rev Genet 2:504–515. doi: 10.1038/35080556. - DOI - PubMed
    1. Kohanski MA, DePristo MA, Collins JJ. 2010. Sublethal antibiotic treatment leads to multidrug resistance via radical-induced mutagenesis. Mol Cell 37:311–320. doi: 10.1016/j.molcel.2010.01.003. - DOI - PMC - PubMed

Publication types