. 2023 Jul 25;42(7):112785.
doi: 10.1016/j.celrep.2023.112785. Epub 2023 Jul 11.

Multi-transcriptomics reveals brain cellular responses to peripheral infection in Alzheimer's disease model mice

Affiliations

Multi-transcriptomics reveals brain cellular responses to peripheral infection in Alzheimer's disease model mice

Yi Lu et al. Cell Rep. .

Abstract

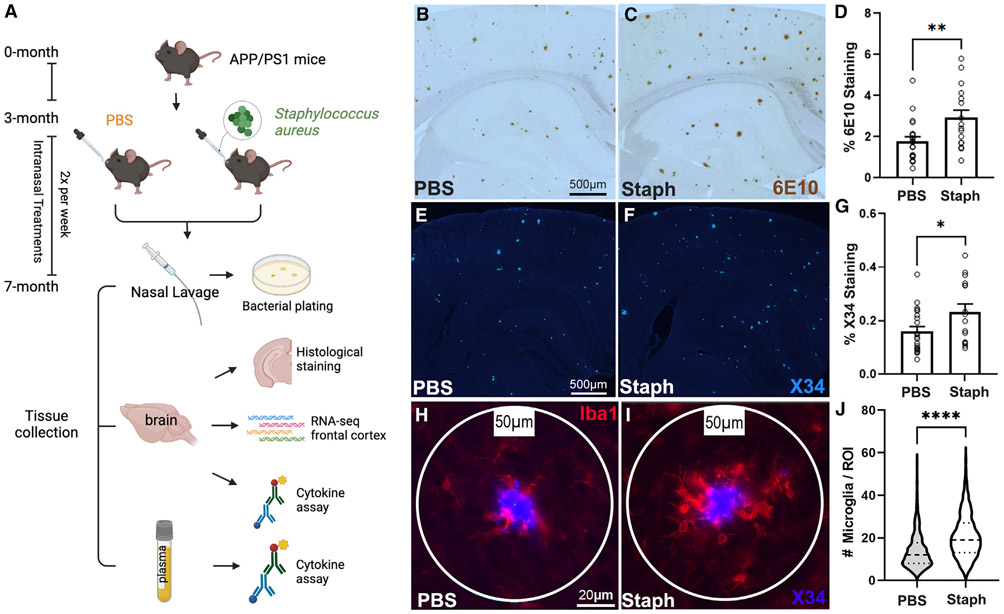
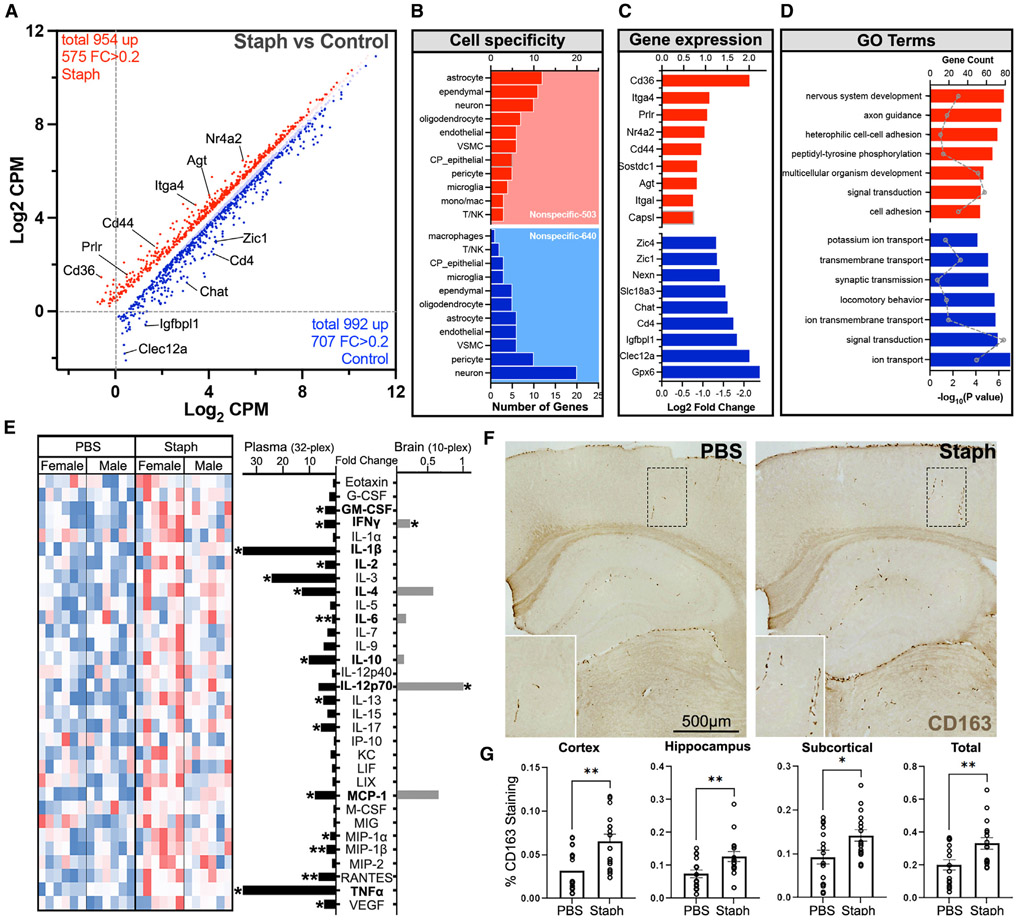
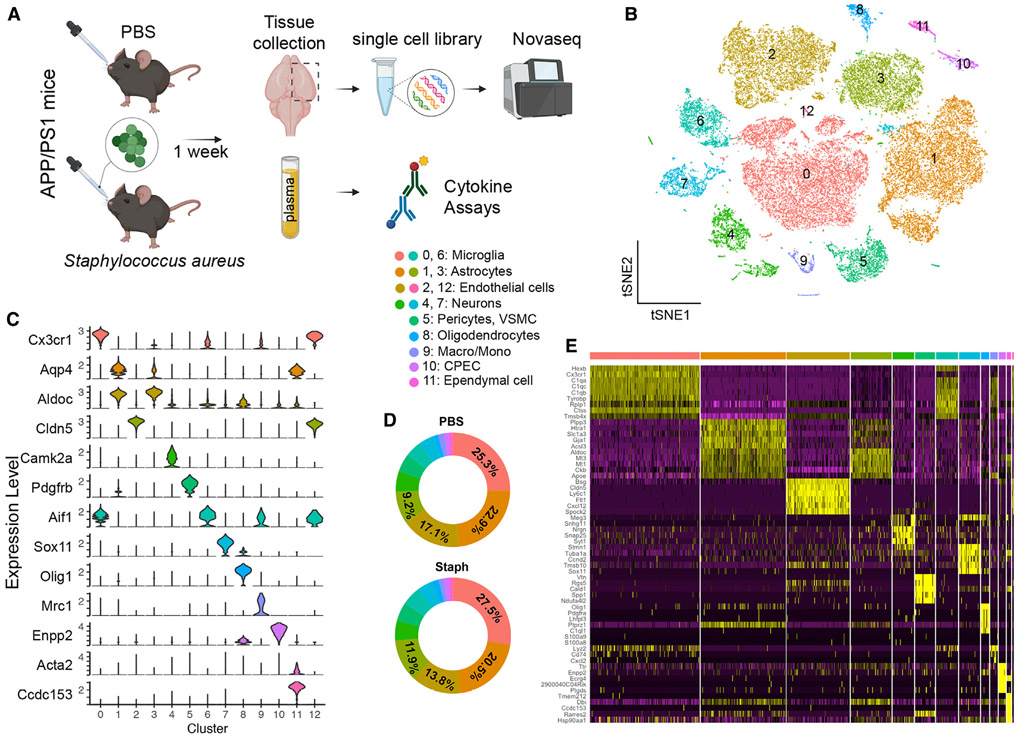
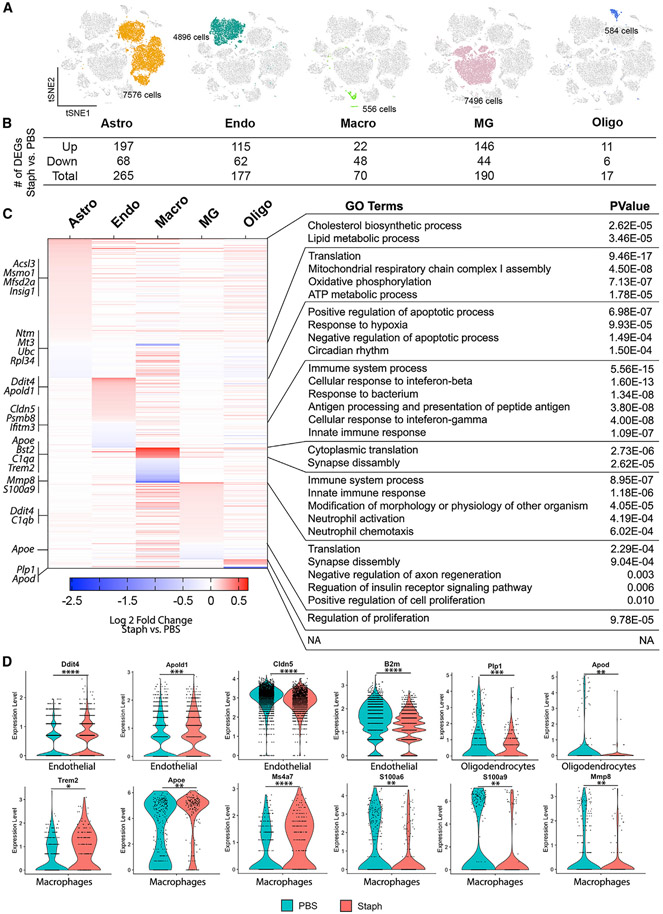
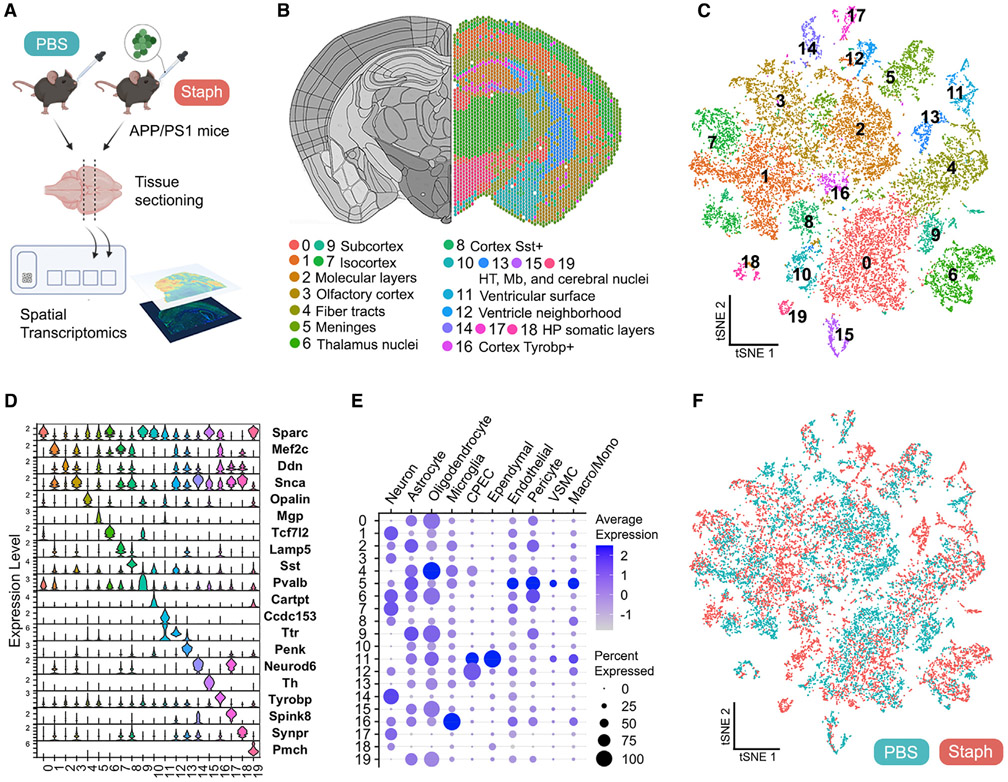
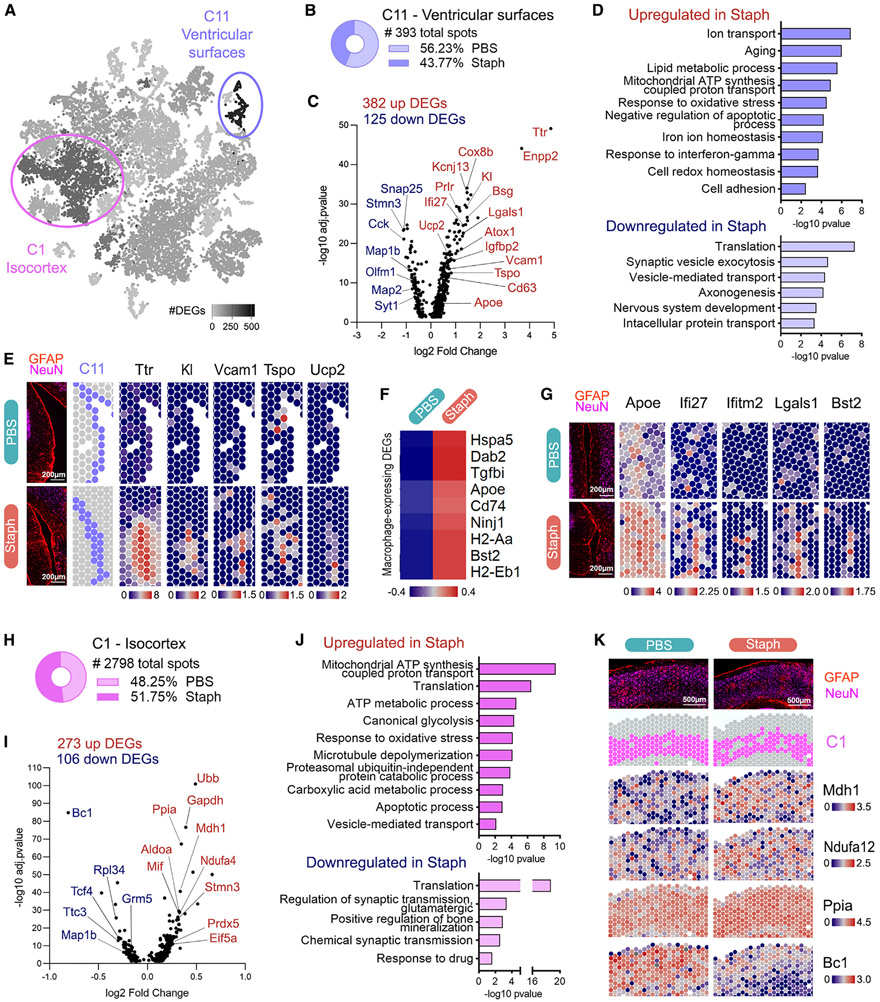
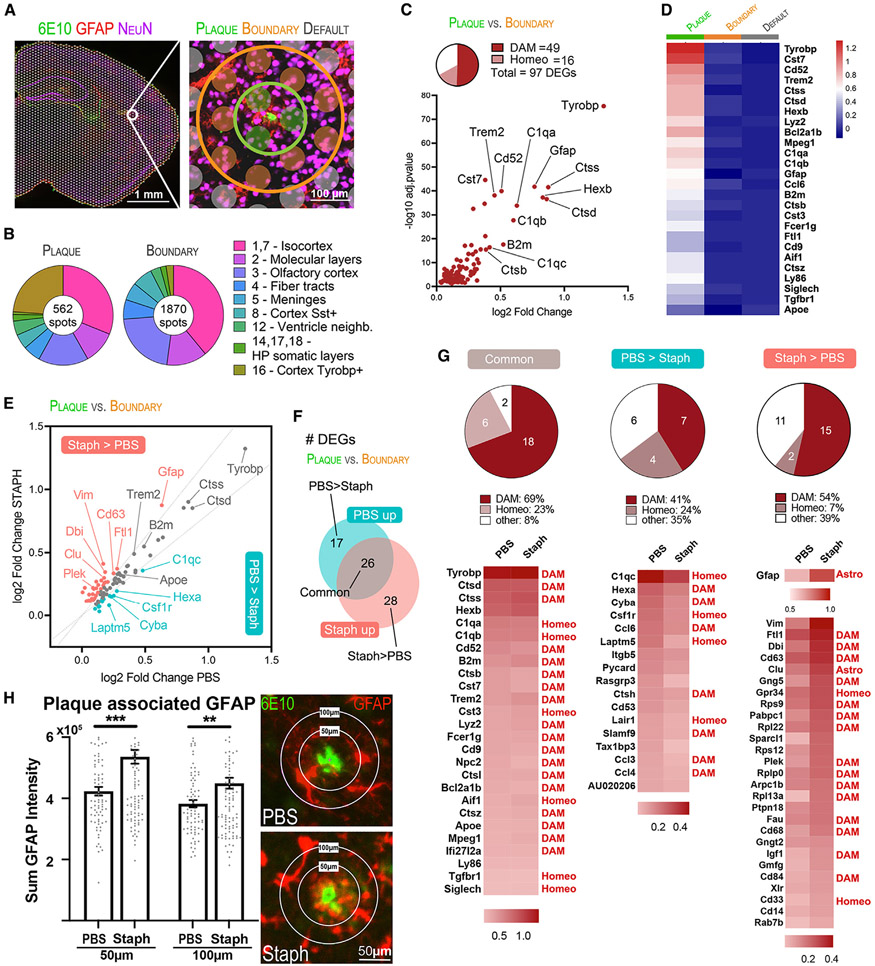
Peripheral inflammation has been linked to various neurodegenerative disorders, including Alzheimer's disease (AD). Here we perform bulk, single-cell, and spatial transcriptomics in APP/PS1 mice intranasally exposed to Staphylococcus aureus to determine how low-grade peripheral infection affects brain transcriptomics and AD-like pathology. Chronic exposure led to increased amyloid plaque burden and plaque-associated microglia, significantly affecting the transcription of brain barrier-associated cells, which resulted in barrier leakage. We reveal cell-type- and spatial-specific transcriptional changes related to brain barrier function and neuroinflammation during the acute infection. Both acute and chronic exposure led to brain macrophage-associated responses and detrimental effects in neuronal transcriptomics. Finally, we identify unique transcriptional responses at the amyloid plaque niches following acute infection characterized by higher disease-associated microglia gene expression and a larger effect on astrocytic or macrophage-associated genes, which could facilitate amyloid and related pathologies. Our findings provide important insights into the mechanisms linking peripheral inflammation to AD pathology.

Keywords: Alzheimer’s disease; CP: Immunology; CP: Neuroscience; amyloid plaques; blood-brain barrier; blood-cerebrospinal fluid barrier; microglia barrier; peripheral inflammation.


Conflict of interest statement

Declaration of interests C.S.-G. has an additional affiliation at Biotechnology Center, Federal University of Rio Grande do Sul, Porto Alegre, RS 91501-970, Brazil.

Figures

Figure 1.
Figure 1.. Nasal inoculation of APP/PS1 mice with Staph shows increased amyloid pathology
(A–C) Study outline (A). Representative images of 6E10 staining in the PBS (B) and the Staph group (C). (D–F) Percentage coverage of 6E10 staining in Staph and PBS groups (D). Representative images of X34 staining show compact plaques in the PBS (E) and the Staph group (F). Scale bars in (B), (C), (E), and (F), 500 μm. (G–I) Percentage coverage of X34 staining in Staph and PBS groups (G). For X34 and 6E10, Staph n = 16, 8 females and 8 males, and PBS n = 21, 11 females and 10 males, with 6 sections/mouse. Representative images of Iba1 and X34 staining in the PBS (H, n = 6, 6 sections/mouse, 352 plaques) and the Staph group (I, n = 8, 6 sections/mouse, 441 plaques). Scale bars, 20 μm. (J) Number of microglia per region of interest (ROI). Statistical analysis was performed with unpaired t test. Bar plots are means ± SEM. ****p < 0.0001, **p < 0.01, *p < 0.05.
Figure 2.
Figure 2.. Chronic Staph infection significantly affects brain transcriptome of AD model mice
Gene expression profiling was performed by RNA-seq on the frontal cortex of mice shown in Figure 1A. (A) Scatterplot depicts differentially expressed genes between the Staph and the PBS group, with bright red/blue indicating FC (fold change) > 0.2. (B) Bar plot showing number of different cell-type-specific genes: Staph (red) and PBS (blue). (C) Bar plot showing the FC of the top differentially expressed genes in each treatment group: Staph (red) and PBS (blue). (D) GO terms associated with the genes upregulated in Staph (red) or PBS (blue) group. Bars show −log10(p) and dots the count of genes. (A), (B), (C), and (D): Staph n = 16 and PBS n = 20. (E) Heatmap (left) of plasma cytokine levels in PBS or Staph group, and bar plots (right) presenting the FC in terms of Staph versus PBS (n = 12 for both groups) in plasma (black) and brain tissue (gray). Cytokines in bold were assessed in both plasma and brain. (F) Representative images of CD163-positive immunostaining. Scale bar, 500 μm. (G) Bar plots showing the percentage of CD163 staining in different brain regions and total (n = 16 for both groups). Statistical analysis for cytokines and CD163 staining was performed with unpaired t test. *p < 0.05, **p < 0.01.
Figure 3.
Figure 3.. scRNA-seq distinguishes major brain cell types in APP/PS1 brains
(A) Acute scRNA-seq study outline. (B) t-SNE plot showing 13 distinguished clusters of 35,698 cells after filtering and pre-processing using Seurat. (C) Violin plots of marker gene expression, identifying cell types for each cluster (one representative marker gene shown for each cell type). (D) Donut plots showing proportion of cells in each cluster from PBS and Staph groups. (E) Heatmap showing top 5 differentially expressed genes for each cluster. PBS n = 4 and Staph n = 3.
Figure 4.
Figure 4.. Staph treatment triggers transcriptional changes in endothelial cells, microglia, macrophages, astrocytes, and oligodendrocytes
(A) t-SNE plots with each cell cluster and cell numbers labeled. (B) Table showing the number of differentially up- or downregulated genes in each cell type. (C) Heatmap (left) showing expression changes of DEGs in all five cell types in terms of Staph versus PBS and the GO terms (right) associated with them. (D) Violin plots showing expression levels of example DEGs in the five cell types. The p value was determined by generalized linear model with Bonferroni correction. *adj. p < 0.05, **adj. p < 0.01, ***adj. p < 0.001, ****adj. p < 0.0001. PBS n = 4 and Staph n = 3.
Figure 5.
Figure 5.. Spatial transcriptomics identifies discrete brain regions in APP/PS1 mice
(A) Acute (1 week) spatial transcriptomics study outline. Two animals/group and two sections/mouse from a single hemisphere were used. (B) Representative spatial plot of the 20 clusters identified (0–19) relative to the mouse brain atlas. HT, hypothalamus; Mb, midbrain; HP, hippocampus. (C) t-SNE dimensional reduction of 20,800 spots labeled according to cluster identity. (D) Expression levels (SCT normalized counts) of marker genes identified for each cluster. (E) Presence of cell-type-specific gene set expression across clusters, showing gene set average expression (color intensity of dot) and percentage of spots where the gene set was detected (dot size). (F) t-SNE plot showing 10,280 spots from the PBS (green) and 10,520 spots from the Staph (red) group.
Figure 6.
Figure 6.. Molecular responses to Staph peripheral inflammation in ventricular surroundings and cortical areas of APP/PS1 mouse brains
(A) t-SNE dimensional reduction of spatial dataset representing the number of DEGs per cluster in Staph versus PBS. The two most affected compartments are highlighted: cluster 11 (507 DEGs) and cluster 1 (379 DEGs). (B) Number of spots in cluster 11 and distribution (%) of spots between groups. (C) Staph versus PBS differential expression in ventricular surfaces (cluster 11). (D) GO terms associated with DEGs in Staph versus PBS ventricular surfaces (cluster 11). (E) Spatial expression plots of Ttr and aging-associated genes upregulated in ventricular surfaces. Tissue immunofluorescence (GFAP/NeuN) and cluster 11 (C11) spot location are shown for comparison. Scale bars, 200 μm. (F) Heatmap showing expression levels of macrophage specific DEGs in cluster 11. (G) Spatial expression plots of macrophage/monocyte-associated genes in ventricular surfaces compared with tissue image (GFAP/NeuN). Scale bars, 200 μm. (H) Number of spots and distribution (%) between groups of cluster 1 relative to the inner layers of isocortex. (I) Staph versus PBS local differential expression in isocortex (cluster 1). (J) GO terms associated with DEGs in Staph versus PBS isocortex (cluster 1). (K) Spatial expression plots of cluster 1 DEGs compared with tissue image (GFAP/NeuN) and with cluster 1 (C1) spot location. Scale bars, 500 μm. Volcano plots for cluster-specific DEGs adj. p < 0.05. GO terms are shown with −log10 p value for each term (bars). Spatial plots and heatmap depict SCTransform-corrected and gene-level-scaled expression values, with scales indicated.
Figure 7.
Figure 7.. Amyloid plaques promote a regional upregulation of disease-associated genes in Staph and PBS APP/PS1 mouse brains
(A) On the left, immunostaining for Aβ (6E10, green), astrocytes (GFAP, red), and neurons (NeuN, purple). On the right, representative selection of plaque microenvironment (green), plaque boundaries (orange), and plaque-independent default spots (gray). Scale bar, 100 μm. (B) Proportion of spots from each cluster for plaque and boundary selections. (C) Scatterplot of plaque versus boundary independent of treatment DEGs. (D) Expression levels of top plaque versus boundary DEGs in plaques, boundaries, and default spots. The heatmap depicts SCTransform-corrected and gene-level-scaled expression values, with scales indicated. (E) Scatterplot showing plaque-associated DEGs in Staph and PBS groups. DEGs were categorized as higher in Staph than in PBS plaques (Staph/PBS log2FC ratio ≥ 1.20, shown in red), higher in PBS than in Staph plaques (Staph/PBS log2FC ratio ≤ 0.80, shown in green), or commonly affected in Staph and PBS (shown in gray). (F) Venn diagram showing number of plaque-associated DEGs (plaque versus boundary) that are common in both groups, higher in PBS, or higher in Staph. (G) Pie charts (top) and heatmaps (bottom) showing log2FC (plaque versus boundary) of DEGs categorized as common, higher in PBS, or higher in Staph. (H) GFAP immunostaining in the brains of the PBS compared with the Staph group. Scale bars, 50 μm. Bar plots show the sum of GFAP intensity in 50 and 100 μm radii around plaques (n = 4 section/group). Statistical analysis was performed with unpaired t test. **p < 0.01, ***p < 0.001.

Similar articles

Cited by

References

    1. Knopman DS, Amieva H, Petersen RC, Chételat G, Holtzman DM, Hyman BT, Nixon RA, and Jones DT (2021). Alzheimer disease. Nat. Rev. Dis. Prim 7, 33. 10.1038/s41572-021-00269-y. - DOI - PMC - PubMed
    1. Bettcher BM, Tansey MG, Dorothée G, and Heneka MT (2021). Peripheral and central immune system crosstalk in Alzheimer disease - a research prospectus. Nat. Rev. Neurol 17, 689–701. 10.1038/s41582-021-00549-x. - DOI - PMC - PubMed
    1. Xie J, Van Hoecke L, and Vandenbroucke RE (2021). The Impact of Systemic Inflammation on Alzheimer’s Disease Pathology. Front. Immunol 12, 796867. 10.3389/fimmu.2021.796867. - DOI - PMC - PubMed
    1. Lai KSP, Liu CS, Rau A, Lanctôt KL, Köhler CA, Pakosh M, Carvalho AF, and Herrmann N (2017). Peripheral inflammatory markers in Alzheimer’s disease: a systematic review and meta-analysis of 175 studies. J. Neurol. Neurosurg. Psychiatry 88, 876–882. 10.1136/jnnp-2017-316201. - DOI - PubMed
    1. Wendeln AC, Degenhardt K, Kaurani L, Gertig M, Ulas T, Jain G, Wagner J, Häsler LM, Wild K, Skodras A, et al. (2018). Innate immune memory in the brain shapes neurological disease hallmarks. Nature 556, 332–338. 10.1038/s41586-018-0023-4. - DOI - PMC - PubMed

Publication types

Substances