

Unemployment and underemployment are causes of suicide
- PMID: 37436996
- PMCID: PMC10337900
- DOI: 10.1126/sciadv.adg3758
Unemployment and underemployment are causes of suicide
Erratum in
-
Editor's note and erratum for the Research Article: "Unemployment and underemployment are causes of suicide".Sci Adv. 2023 Aug 18;9(33):eadj9995. doi: 10.1126/sciadv.adj9995. Epub 2023 Aug 18. Sci Adv. 2023. PMID: 37595019 Free PMC article. No abstract available.
Expression of concern in
-
Editorial Expression of Concern.Sci Adv. 2023 Jul 21;9(29):eabh0587. doi: 10.1126/sciadv.adj8941. Epub 2023 Jul 21. Sci Adv. 2023. PMID: 37478466 Free PMC article. No abstract available.
Abstract
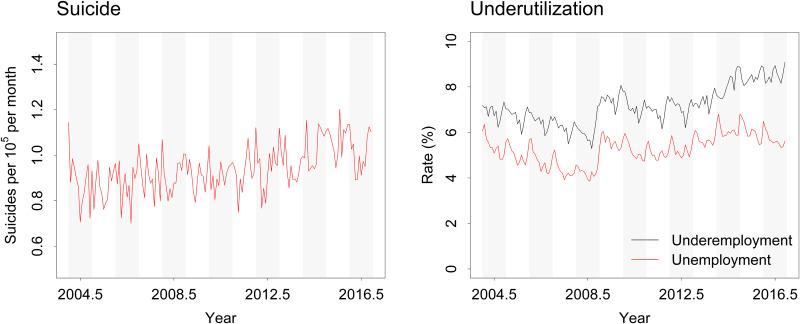
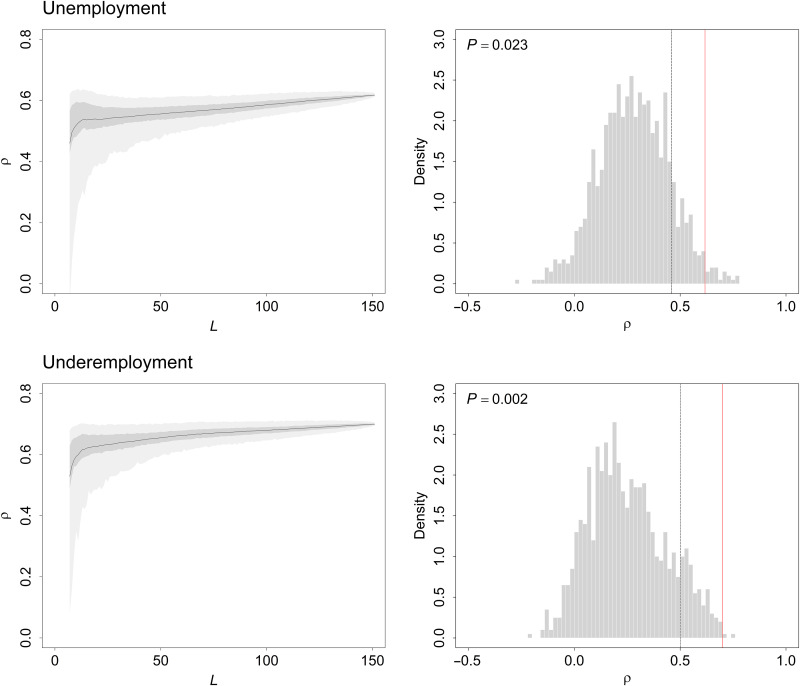
Epidemiological studies indicate that labor underutilization and suicide are associated, yet it remains unclear whether this association is causal. We applied convergent cross mapping to test for causal effects of unemployment and underemployment on suicidal behavior, using monthly data on labor underutilization and suicide rates in Australia for the period 2004-2016. Our analyses provide evidence that rates of unemployment and underemployment were significant drivers of suicide mortality in Australia over the 13-year study period. Predictive modeling indicates that 9.5% of the ~32,000 suicides reported between 2004 and 2016 resulted directly from labor underutilization, including 1575 suicides attributable to unemployment and 1496 suicides attributable to underemployment. We conclude that economic policies prioritizing full employment should be considered integral to any comprehensive national suicide prevention strategy.
Figures

Similar articles
-
Public Health Impacts of Underemployment and Unemployment in the United States: Exploring Perceptions, Gaps and Opportunities.Int J Environ Res Public Health. 2021 Sep 23;18(19):10021. doi: 10.3390/ijerph181910021. Int J Environ Res Public Health. 2021. PMID: 34639322 Free PMC article. Review.
-
Employment and suicidal rates during economic recession: A country-targeted integrative review.Int J Soc Psychiatry. 2021 Sep;67(6):801-815. doi: 10.1177/0020764020969740. Epub 2020 Nov 2. Int J Soc Psychiatry. 2021. PMID: 33135535 Review.
-
The role of financial hardship, mastery and social support in the association between employment status and depression: results from an Australian longitudinal cohort study.BMJ Open. 2016 May 27;6(5):e009834. doi: 10.1136/bmjopen-2015-009834. BMJ Open. 2016. PMID: 27235296 Free PMC article.
-
Prevention of suicide and attempted suicide in Denmark. Epidemiological studies of suicide and intervention studies in selected risk groups.Dan Med Bull. 2007 Nov;54(4):306-69. Dan Med Bull. 2007. PMID: 18208680 Review.
-
Economically inactive, unemployed and employed suicides in Australia by age and sex over a 10-year period: what was the impact of the 2007 economic recession?Int J Epidemiol. 2014 Oct;43(5):1500-7. doi: 10.1093/ije/dyu148. Epub 2014 Jul 26. Int J Epidemiol. 2014. PMID: 25064642
Cited by
-
The rise in mortality due to intentional self-poisoning by medicines in Brazil between 2003 and 2022: relationship with regional and global crises.Front Public Health. 2024 Jul 11;12:1428674. doi: 10.3389/fpubh.2024.1428674. eCollection 2024. Front Public Health. 2024. PMID: 39056078 Free PMC article.
-
Dynamic learning of individual-level suicidal ideation trajectories to enhance mental health care.Npj Ment Health Res. 2024 Jun 7;3(1):26. doi: 10.1038/s44184-024-00071-0. Npj Ment Health Res. 2024. PMID: 38849429 Free PMC article.
-
Short working hours and perceived stress: Findings from a population-based nationwide study.Heliyon. 2023 Nov 1;9(11):e21919. doi: 10.1016/j.heliyon.2023.e21919. eCollection 2023 Nov. Heliyon. 2023. PMID: 38028004 Free PMC article.
-
Generative AI may create a socioeconomic tipping point through labour displacement.Sci Rep. 2025 Jul 18;15(1):26050. doi: 10.1038/s41598-025-08498-x. Sci Rep. 2025. PMID: 40681611 Free PMC article.
-
Mental health impacts of COVID-19: A retrospective analysis of dynamic modelling projections for Australia.Heliyon. 2024 Mar 16;10(7):e28250. doi: 10.1016/j.heliyon.2024.e28250. eCollection 2024 Apr 15. Heliyon. 2024. PMID: 38586382 Free PMC article.
References
-
- World Health Organization, Global health estimates 2016: Deaths by cause, age, sex, by country and by region, 2000–2016 (World Health Organization, Geneva, 2018).
-
- C. Nordt, I. Warnke, E. Seifritz, W. Kawohl, Modelling suicide and unemployment: a longitudinal analysis covering 63 countries, 2000−11. Lancet Psychiatry 2, 239–245 (2015). - PubMed
-
- P. B. Mortensen, E. Agerbo, T. Erikson, P. Qin, N. Westergaard-Nielsen, Psychiatric illness and risk factors for suicide in Denmark. Lancet 355, 9–12 (2000). - PubMed
-
- C. Hakulinen, M. Elovainio, M. Arffman, S. Lumme, S. Pirkola, I. Keskimäki, K. Manderbacka, P. Böckerman, Mental disorders and long-term labour market outcomes: Nationwide cohort study of 2 055 720 individuals. Acta Psychiatr. Scand. 140, 371–381 (2019). - PubMed
MeSH terms
LinkOut - more resources
Full Text Sources
Medical
