. 2023 Jul 12;18(7):e0287776.
doi: 10.1371/journal.pone.0287776. eCollection 2023.

Modelling underreported spatio-temporal crime events

Affiliations

Modelling underreported spatio-temporal crime events

Álvaro J Riascos Villegas et al. PLoS One. .

Abstract

Crime observations are one of the principal inputs used by governments for designing citizens' security strategies. However, crime measurements are obscured by underreporting biases, resulting in the so-called "dark figure of crime". This work studies the possibility of recovering "true" crime and underreported incident rates over time using sequentially available daily data. For this, a novel underreporting model of spatiotemporal events based on the combinatorial multi-armed bandit framework was proposed. Through extensive simulations, the proposed methodology was validated for identifying the fundamental parameters of the proposed model: the "true" rates of incidence and underreporting of events. Once the proposed model was validated, crime data from a large city, Bogotá (Colombia), was used to estimate the "true" crime and underreporting rates. Our results suggest that this methodology could be used to rapidly estimate the underreporting rates of spatiotemporal events, which is a critical problem in public policy design.


Conflict of interest statement

NO authors have competing interests.

Figures
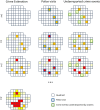
Fig 1
Fig 1. The dark figure of crime estimation.
Daily gathering crime observations obtain a daily update for the crime estimation (filled-in colors of small squares). Information coming from police visits (blue border squares), which decision planners can control, updates these estimations. Simultaneously, the information provided by crime events reported by citizens (green border squares) is also integrated. The decision planner may account for exploration-exploitation strategies by dynamically locating police visits.
Fig 2
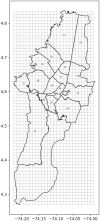
Fig 2. Bogotá, capital city of Colombia.
Figure shows the 19 jurisdictions in which the city is divided and our grid of 1 km2 cells. This figure was created by the authors using a shapefile of the administrative division of Bogotá, which is publicly available on the government’s “Datos abiertos” (Open data in Spanish) web page at https://datosabiertos.bogota.gov.co/dataset/localidad-bogota-d-c.
Fig 3
Fig 3. Crimes by source of information: SIEDCO is the official source of information of crimes in Bogotá.
NUSE is the security and emergency call center of the city. Total is the sum of both sources eliminating double counting as explained in the main body of the text.
Fig 4
Fig 4. CUCB Convergence.
Panel (a), CUCB Convergence to true arms mean. Panel (b), CUCB Convergence to true arms underreporting parameters.
Fig 5
Fig 5. Algorithms convergence error and number of visits.
Panel (a), convergence error of true arms mean for each algorithm. The error is measured as the Euclidean distance between the true mean vector and the estimated mean vector per round. Panel (b), number of visits (i.e., fired arms) of algorithms to each arm.
Fig 6
Fig 6. Convergence error of true arms mean for each algorithm.
The error is measured as the Euclidean distance between the true mean vector and estimated mean vector per round.
Fig 7
Fig 7
Panel (a), convergence of the vector of incidence rates μ to the mean of all crimes per cell across time. The error is measured as the Euclidean distance between vectors with 415 components. Panel (b), convergence of estimated vector q per round to the empirical mean of the underreporting rate for the whole sample. The error is measured as the Euclidean distance between vectors with 415 components.
Fig 8
Fig 8. Histogram of convergence of estimated error of q in the last round to the empirical mean of the underreporting rate for the whole sample.
Absolute values reported.
Fig 9
Fig 9
Panel (a), convergence of the estimated total number of crimes to the observed number of crimes in the city. Panel (b), convergence of the estimated total (aggregate across cells) of the number of underreported crimes implied by the model.
Fig 10
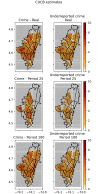
Fig 10. Heat map illustrating the convergence, using the CUCB algorithm, of the estimated crime and underreporting of events in the city, to the real values.
The first column, second and third rows show the heat maps of the estimated crime incidence rates after 25 and 100 iterations, respectively. The second column, first row shows real underreporting as measured by NUSE dataset. The second column, second and third rows show the heat maps of the estimated underreporting crime after 25 iterations and 100 iterations, respectively. This figure was created by the authors using a shapefile of the administrative division of Bogotá, which is publicly available on the government’s “Datos abiertos” (Open data in Spanish) web page at https://datosabiertos.bogota.gov.co/dataset/localidad-bogota-d-c.
Fig 11
Fig 11
Panel (a), results for second application simulating data with standard crime Poisson model. Panel shows the convergence of the vector true incidence rates μ to the true values. Error measured as Euclidean distance between vectors. Panel (b), results for second application simulating data with a standard crime Poisson model. Figure shows the convergence of the vector parameters q to the true values. Error measured as the Euclidean distance between vectors. UCB1 not reported because it is outperformed by the other two algorithms.

References

    1. Perry WL. Predictive policing: The role of crime forecasting in law enforcement operations. Rand Corporation; 2013.
    1. Grana G, Windell J. Crime and intelligence analysis: an integrated real-time approach. Routledge; 2021.
    1. Hart TC, Rennison CM. Reporting crime to the police, 1992–2000. US Department of Justice, Office of Justice Programs; Washington, DC; 2003.
    1. Xie M, Lauritsen JL. Racial context and crime reporting: A test of Black’s stratification hypothesis. Journal of quantitative criminology. 2012;28:265–293. doi: 10.1007/s10940-011-9140-z - DOI
    1. Xie M, Baumer EP. Neighborhood immigrant concentration and violent crime reporting to the police: A multilevel analysis of data from the National Crime Victimization Survey. Criminology. 2019;57(2):237–267. doi: 10.1111/1745-9125.12204 - DOI

Publication types