. 2023 Nov 2;146(11):4766-4783.
doi: 10.1093/brain/awad231.

Models of KPTN-related disorder implicate mTOR signalling in cognitive and overgrowth phenotypes

Affiliations

Models of KPTN-related disorder implicate mTOR signalling in cognitive and overgrowth phenotypes

Maria O Levitin et al. Brain. .

Abstract

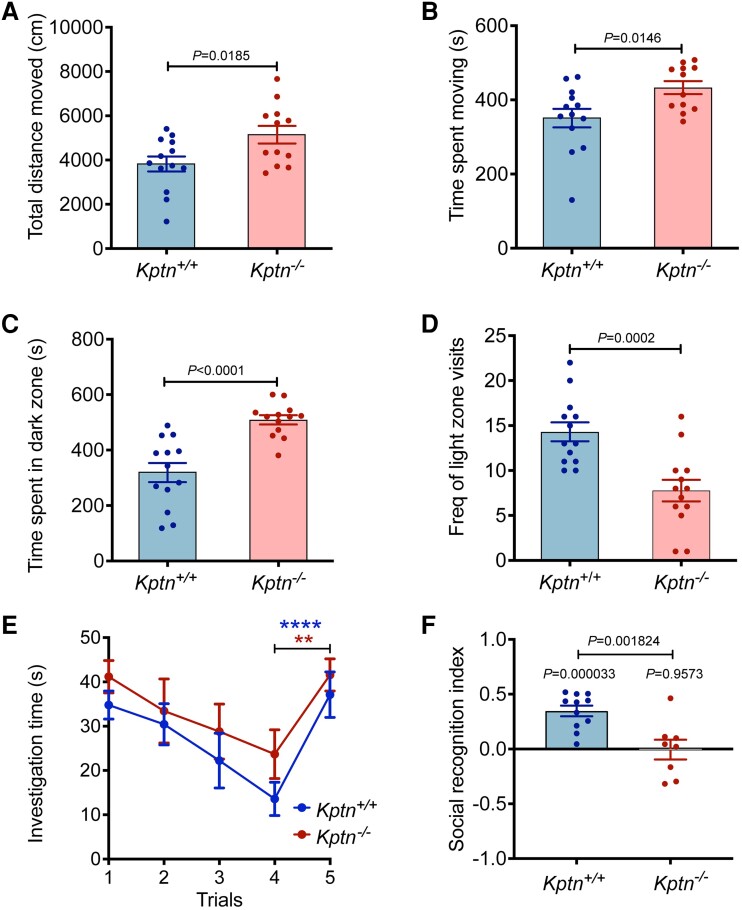
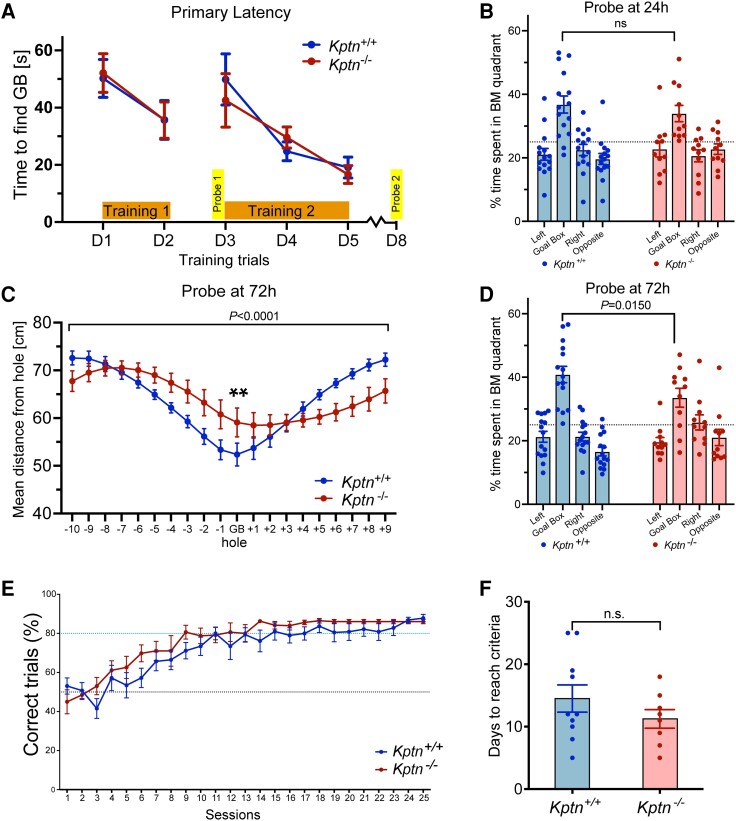
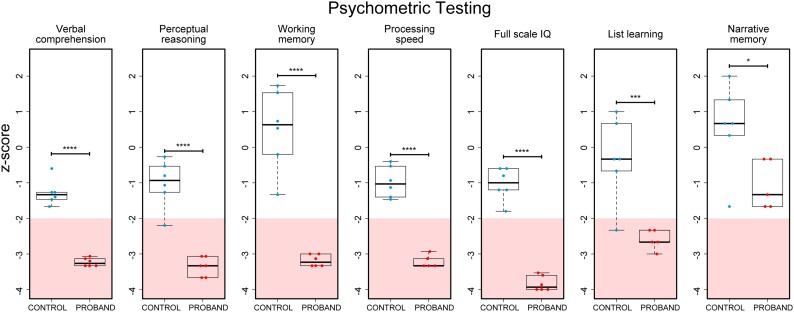
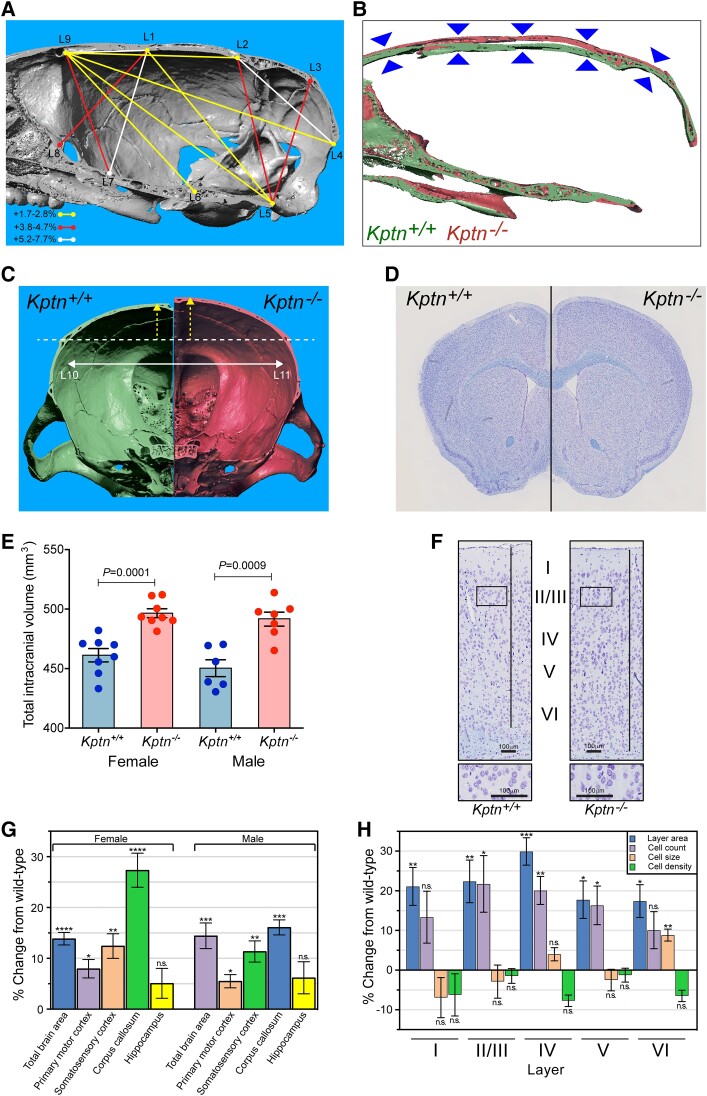
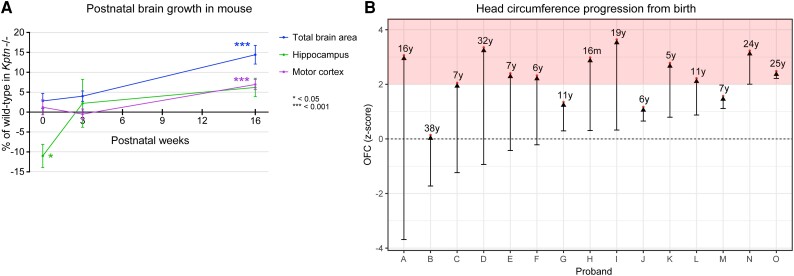
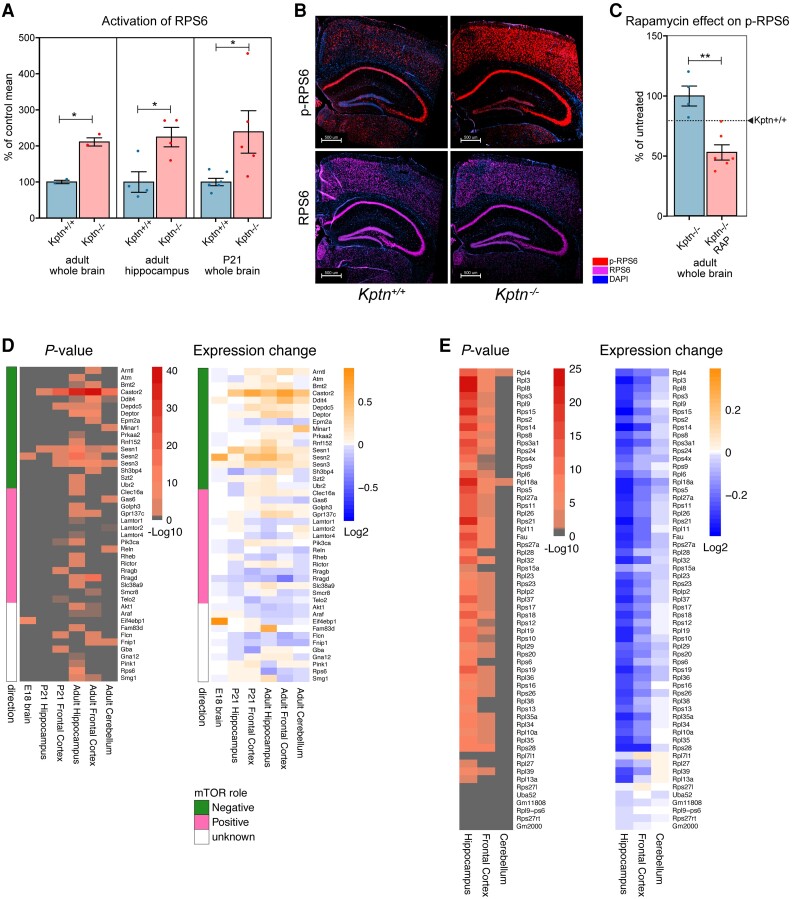
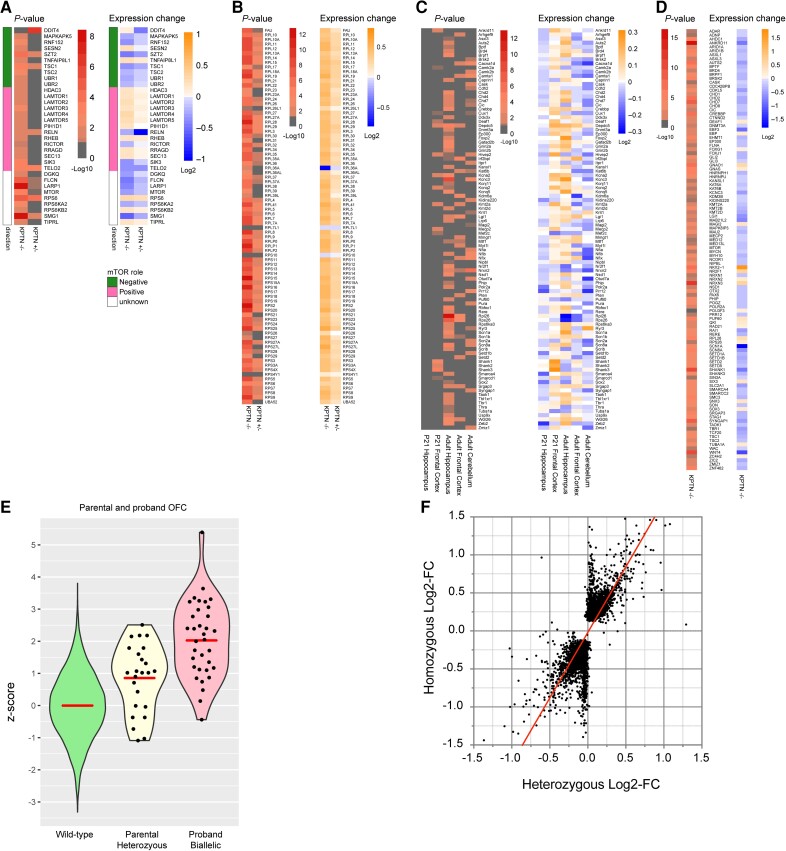
KPTN-related disorder is an autosomal recessive disorder associated with germline variants in KPTN (previously known as kaptin), a component of the mTOR regulatory complex KICSTOR. To gain further insights into the pathogenesis of KPTN-related disorder, we analysed mouse knockout and human stem cell KPTN loss-of-function models. Kptn -/- mice display many of the key KPTN-related disorder phenotypes, including brain overgrowth, behavioural abnormalities, and cognitive deficits. By assessment of affected individuals, we have identified widespread cognitive deficits (n = 6) and postnatal onset of brain overgrowth (n = 19). By analysing head size data from their parents (n = 24), we have identified a previously unrecognized KPTN dosage-sensitivity, resulting in increased head circumference in heterozygous carriers of pathogenic KPTN variants. Molecular and structural analysis of Kptn-/- mice revealed pathological changes, including differences in brain size, shape and cell numbers primarily due to abnormal postnatal brain development. Both the mouse and differentiated induced pluripotent stem cell models of the disorder display transcriptional and biochemical evidence for altered mTOR pathway signalling, supporting the role of KPTN in regulating mTORC1. By treatment in our KPTN mouse model, we found that the increased mTOR signalling downstream of KPTN is rapamycin sensitive, highlighting possible therapeutic avenues with currently available mTOR inhibitors. These findings place KPTN-related disorder in the broader group of mTORC1-related disorders affecting brain structure, cognitive function and network integrity.

Keywords: animal model; iPSC; mTOR; macrocephaly; neurodevelopmental disorders; recessive.


Conflict of interest statement

M.E.H. is a co-founder, shareholder, non-executive director of Congenica, and an advisor to Astra-Zeneca.

Figures

Figure 1
Figure 1
Assessing Kptn −/− mice for changes in activity, anxiety and memory. Kptn−/− mice were tested for locomotor activity (A and B) altered anxiety-like behaviour (C and D) and memory retention (E and F). (A and B) Changes in behaviour in the open field assay of Kptn−/− mice (n = 12) compared to wild-type controls (Kptn+/+, n = 13). (A) Distance covered (P = 0.0185, t = 2.534 df = 23, two-tailed Student’s t-test); (B) time spent moving (P = 0.0146, t = 2.64 df = 23, two-tailed Student’s t-test). (C and D) Results of anxiety testing using a light/dark box, comparing Kptn−/− mice (n = 13) and wild-type controls (Kptn+/+, n = 13). (C) Time spent in the dark zone (P < 0.0001; t = 4.946 df = 24, two-tailed Student’s t-test) and (D) frequency of visits to light zone (P = 0.0002, t = 4.326 df = 25, two-tailed Student’s t-test). (E) Memory testing using social recognition assay, measuring investigation time on Day 1 by wild-type controls (Kptn+/+n = 11) and Kptn mutant mice (Kptn−/−, n = 8) of a stimulus animal repeatedly presented to them over the course of four trials. To assess the ability to discriminate novel from familiar mice, in Trial 5 all animals are presented with a novel stimulus animal (change in investigation Trials 1–4 versus Trial 5, two-way ANOVA, interaction Trial × Genotype F(4,68) = 0.3852, P = 0.8185; Trial F(4,68) = 16.26, P < 0.0001; post hoc analysis of Trial 4 versus Trial 5, Kptn+/+P < 0.0001****, Kptn−/−P = 0.0023**). (F) Assessment of 24 h social recognition memory using the social recognition index, which indicates the difference in investigation of unfamiliar stimulus versus the familiar stimulus mouse (from Day 1) as a fraction of total investigation time (see ‘Materials and methods’ section) for wild-type Kptn+/+ controls (n = 11), and Kptn−/− mice (n = 8) (between genotypes, two-tailed Student’s t-test; within genotypes, one sample two-tailed Student’s t-tests against mean of zero).Values are plotted as mean ± standard error of the mean (SEM).
Figure 2
Figure 2
Performance of Kptn−/− mice in memory assays. (AD) Barnes maze applied to KRD mouse model to assess spatial memory. (A) Time taken to find the escape box (primary latency) across all days of training (Training 1, D1–D2; Training 2, D3–D5), comparing Kptn+/+ (n = 15) and Kptn−/− (n = 11) mice [two-way ANOVA, interaction Genotype × Zone F(4,120) = 0.2577, P = 0.9044]. (B) The percentage of time Kptn+/+ (blue, n = 15) and Kptn−/− (red, n = 11) mice spent around the target hole quadrant (Goal Box) and non-target quadrants of the Barnes maze during a probe trial 24 h after Training 1 [two-way ANOVA, interaction Genotype × Zone F(3,96) = 0.8544, P = 0.4676]. Both genotypes spent significantly more time near the target versus all other holes (post hoc FDR q < 0.0003. P ≤ 0.001). (C) The mean distance from each hole during probe trial, 72 h after Training 2, comparing Kptn−/− and Kptn+/+ mice [two-way ANOVA, interaction Genotype × Hole F(19,500) = 5.351, P = <0.0001; post hoc on GB, FDR q = 0.0045, P = 0.0014**]. (D) The percentage of time Kptn+/+ (blue, n = 15) and Kptn−/− (red, n = 11) mice spent in the target hole quadrant (Goal Box) and non-target quadrants of the Barnes maze during the probe trial, 72 h after Training 2, comparing time in the target hole quadrant between Kptn−/− and Kptn+/+ mice [two-way ANOVA, interaction Genotype × Zone F(3,96) = 3.667, P = 0.0150; post hoc FDR q = 0.0632, P = 0.0150] (E and F) Assessment of Kptn−/− mice in hippocampus-independent pairwise discrimination task (Bussey-Saksida chamber). (E) Percentage of correct trials (when CS+ image was nose-poked) out of the total trials completed per session for Kptn−/− (n = 8) and Kptn+/+ (n = 10) mice [two-way ANOVA, interaction Genotype × Session F(1,16) = 1.144, P = 0.3007]. (F) Number of days to reach criteria comparing Kptn−/− and Kptn+/+ mice (P = 0.2093, t = 1.162 df = 16, two-tailed Student's t-test). Values are plotted as mean ± standard error of the mean (SEM).
Figure 3
Figure 3
Psychometric testing of Amish individuals with KRD reveals widespread cognitive deficits. Six Amish individuals between the ages of 11 and 29 with KRD (three female, three male) and age-matched population controls were psychometrically assessed (see ‘Materials and methods’ section) to measure cognitive performance in four domains including verbal comprehension, perceptual reasoning, processing speed and working memory indices, that can be combined to generate a full-scale intelligence quotient score. Auditory-verbal recall performance was also assessed by list learning and story memory tests. The impaired range is indicated by pink shading, z-score <2. Scores from KRD individuals were found to be significantly lower than control individuals in all tests administered (P < 0.05, two-tailed Student's t-tests). *P < 0.05; ***P < 0.001; ****P < 0.0001.
Figure 4
Figure 4
Assessing Kptn−/− mouse model skull and brain morphology. Micro-computed X-ray tomography reconstructions were collected and analysed on male Kptn−/− mice and Kptn+/+ controls (n = 5 each). (A) Significant changes in inter-landmark distances are indicated with lines (colours represent bins of % change from wild-type) for height, length and width of the brain cavity of Kptn−/− animals (P < 0.05, two-tailed Student's t-test, Supplementary Table 1). (B) Sagittal sections of 3D reconstructions comparing skull height along the rostro-caudal extent of the brain cavity (arrowheads). (C) Anterior-facing coronal sections from representative individual 3D reconstructions to highlight changes in the dorsal curvature (yellow arrows) of frontal and parietal bones in Kptn−/− mice (left, green = Kptn+/+, right, red = Kptn−/−), and the width of the brain cavity (white arrow, +2.56%, P = 0.0356). (D) Representative hemisections of male Kptn+/+ control (left) and Kptn−/− mutant brains (right). (E) Volumetric measurements from MRI of female and male Kptn−/− mutants and Kptn+/+ controls comparing total intracranial volume at 16 weeks of age (n = 8 per group, two-tailed Student's t-tests). Values are plotted as mean ± standard error of the mean (SEM). (F) Representative sections from Kptn+/+ and Kptn−/− cortices stained with cresyl violet. (G) Morphometric analyses of histological sections (as in D and F) of Kptn−/− mutant brains plotted as percentage difference of Kptn−/− from wild-type mean, to identify significant changes in total brain area (shown for Section 1), cortical (shown for Section 1) and corpus callosum thicknesses (Section 2) (P-values as described below, two-tailed Student's t-tests, further details in Supplementary Fig. 5 and Supplementary material, File 1). (H) Cellular features for each cortical layer (layer I to layer VI) in Kptn−/− mutant mice (cell count, cell size, cell density) as well as the corresponding layer area (Supplementary material, File 1) at position Bregma −1.34 mm in male mice, shown as a percentage difference of Kptn−/− from wild-type mean. n.s. = no significant change (P > 0.05); *P < 0.05; **P < 0.01; ***P < 0.001; ****P < 0.0001.
Figure 5
Figure 5
Assessment of postnatal brain overgrowth in mouse KRD model and human KRD probands. (A) Percentage change in mean of total brain area, motor cortex and hippocampus in Kptn−/− mutant mice compared to wild-types at birth, 3 weeks and 16 weeks postnatally, with significance level indicated by asterisks in graph. Points without asterisks are not significantly different (P > 0.05, two-tailed Student's t-test). (B) Occipital frontal circumference (OFC) measurements from 15 individuals with KRD from birth (lower bars) to age at last assessment (red dots). Pink shading in B indicates the macrocephalic range, with SD >2.
Figure 6
Figure 6
Assessing Kptn loss-of-function effects on mTOR signalling. (A) Quantification of the phosphorylation of ribosomal protein S6 (RPS6) in wild-type controls (Kptn+/+) and mutant animals (Kptn−/−) to test for alterations in mTOR signalling in adult whole brain (P = 0.0119, n = 2 per genotype), hippocampus (P = 0.0189, n = 4 per genotype), and in whole brains of juvenile mice at P21 (P = 0.0308, Kptn+/+, n = 6; Kptn−/−, n = 5), measured as the ratio of phosphorylated RPS6 (p-RPS6) to total RPS6 signal (units as % of control mean). All P-values are from two-tailed Student's t-tests. (B) Immunostaining for RPS6 (purple) and its phosphorylated form (p-RPS6, red) to reveal changes in cortical and hippocampal activation of the mTOR pathway in Kptn−/− mice (nuclei stained with DAPI, blue). (C) Quantification of the phosphorylation of RPS6 in Kptn−/− animals after 3 days of treatment with vehicle (Kptn−/−) or rapamycin (Kptn−/− RAP) to detect changes in p-RPS6 levels upon treatment (P = 0.00188, Kptn+/+n = 4; Kptn−/−n = 6, two-tailed Student's t-test). Values are plotted as mean ± SEM, as a percentage of vehicle treated Kptn−/− mice. Wild-type levels are indicated by the dashed line and arrowhead (Kptn+/+). (D and E) Bulk RNA-Seq reveals transcriptional changes to mTOR pathway components (D) and downstream ribosomal gene network (E) in Kptn−/− mice at embryonic and postnatal stages as indicated, compared to Kptn+/+ controls. Statistically significant (α < 0.05) Log2-fold changes in expression are indicated by non-grey adjusted P-value heat map cells. Role in mTOR pathway is indicated as green/pink/white colour scheme in D. All western blot images can be found in Supplementary material, File 5.
Figure 7
Figure 7
Assessing transcriptional changes in mTOR pathway and developmental disorder genes in human neural stem cell model of KRD, and morphological correlates of KPTN dosage sensitivity. (A and B) Transcriptional changes in mTOR pathway components (A) and downstream ribosomal gene network (B) in KPTN LoF NPC models compared to wild-type controls. Heterozygous KPTN LoF cells (KPTN+/−) were included to look for the presence of any intermediate mTOR pathway phenotypes consistent with dosage sensitivity to loss of KPTN expression. (C and D) Dysregulation of dominant haploinsufficient developmental disorder associated genes in mouse brain (C) and human neural cell models of KRD (D). Statistically significant Log2-fold changes in expression are indicated by non-grey adjusted P-value heat map cells. (E) Occipitofrontal circumference (OFC) measurements in heterozygous parents (Parental Heterozygous) of KRD probands (mean z-score = 0.856, P = 0.000028, one sample, two-sided z-test against wild-type distribution, n = 24) alongside the wild-type OFC distribution (Wild-type) and that of affected individuals with biallelic KPTN variants (Proband Biallelic, as detailed in Supplementary material, File 2; Proband, mean z-score = 2.027, P < 0.00001, one sample, two-sided z-test against wild-type distribution, n = 35). (F) Comparison of normalized read counts from RNA-Seq on KPTN LoF NPC models to examine correlation between the gene dysregulation in homozygous and heterozygous KPTN LoF cell lines (Pearson r = 0.759, P < 0.0001).

Comment in

References

    1. Azevedo FAC, Carvalho LRB, Grinberg LT, et al. Equal numbers of neuronal and nonneuronal cells make the human brain an isometrically scaled-up primate brain. J Comp Neurol. 2009;513:532–541. - PubMed
    1. Walsh CA, Engle EC. Allelic diversity in human developmental neurogenetics: Insights into biology and disease. Neuron. 2010;68:245–253. - PMC - PubMed
    1. Zoghbi HY. Postnatal neurodevelopmental disorders: Meeting at the synapse? Science. 2003;302:826–830. - PubMed
    1. Rubenstein JLR. Annual research review: Development of the cerebral cortex: Implications for neurodevelopmental disorders. J Child Psychol Psychiatry. 2011;52:339–355. - PMC - PubMed
    1. Wright CF, Fitzgerald TW, Jones WD, et al. Genetic diagnosis of developmental disorders in the DDD study: A scalable analysis of genome-wide research data. Lancet. 2015;385:1305–1314. - PMC - PubMed

Publication types

Substances

LinkOut - more resources