

Hypoadiponectinemia-induced upregulation of microRNA449b downregulating Nrf-1 aggravates cardiac ischemia-reperfusion injury in diabetic mice
- PMID: 37437402
- PMCID: PMC10566306
- DOI: 10.1016/j.yjmcc.2023.06.004
Hypoadiponectinemia-induced upregulation of microRNA449b downregulating Nrf-1 aggravates cardiac ischemia-reperfusion injury in diabetic mice
Abstract
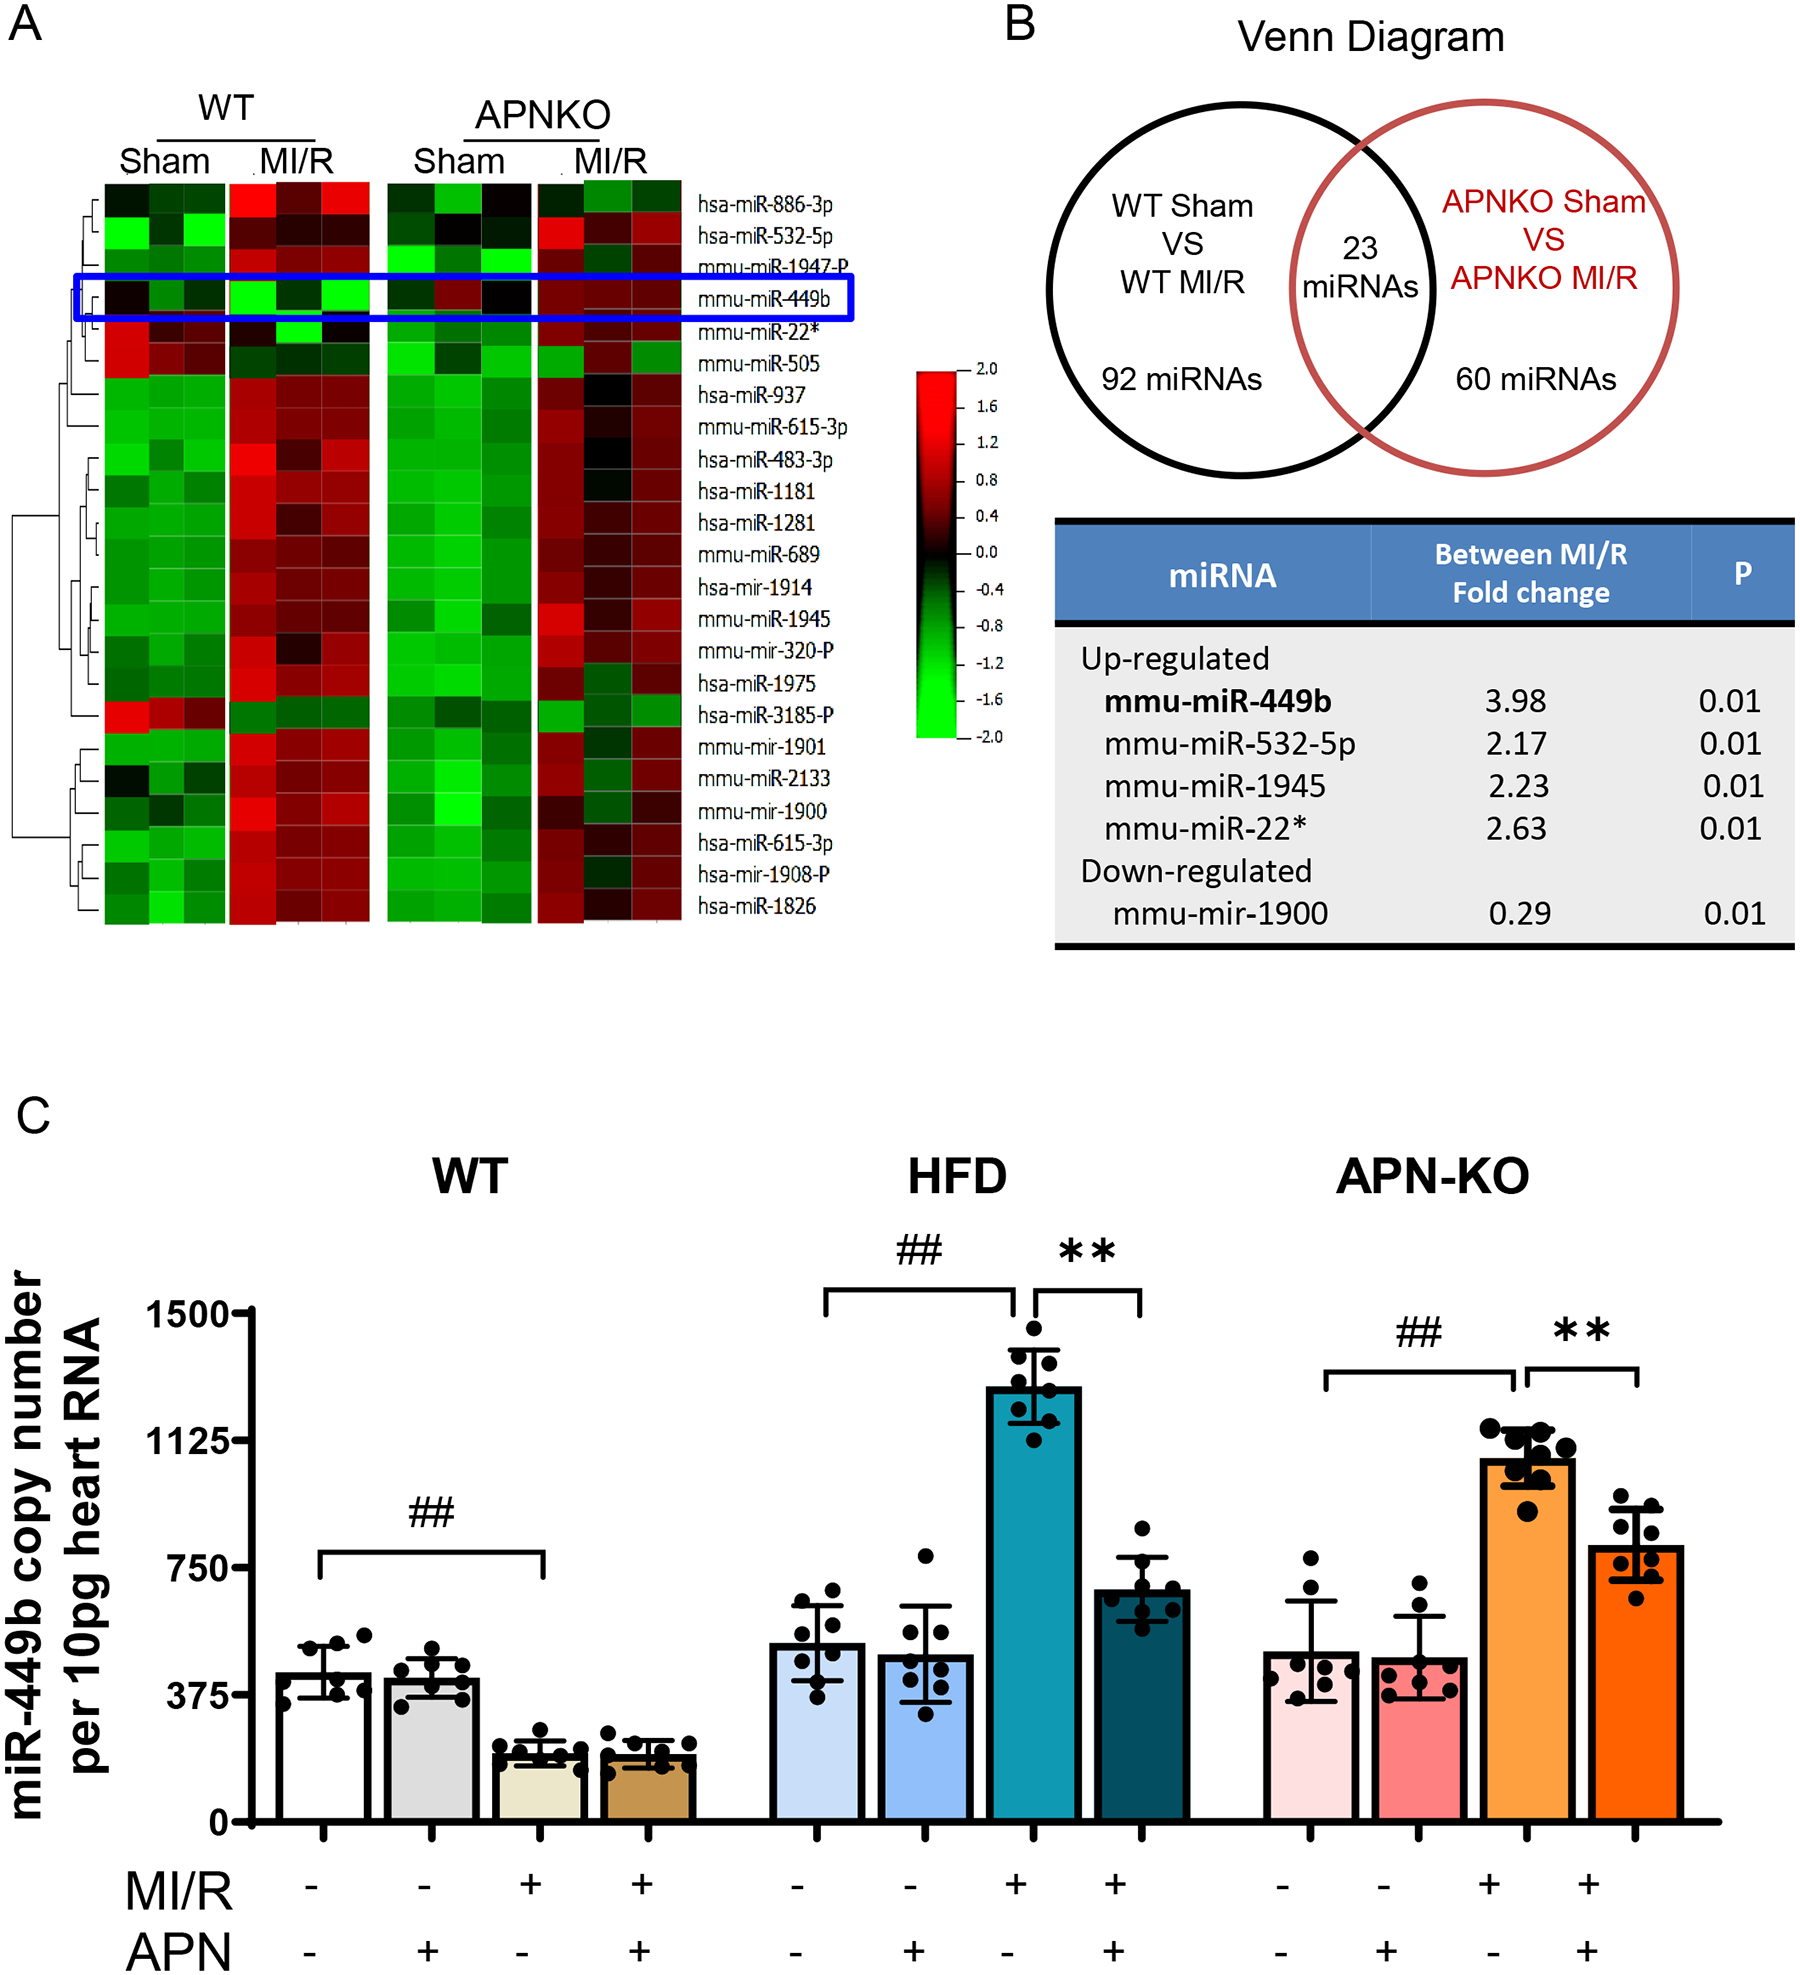
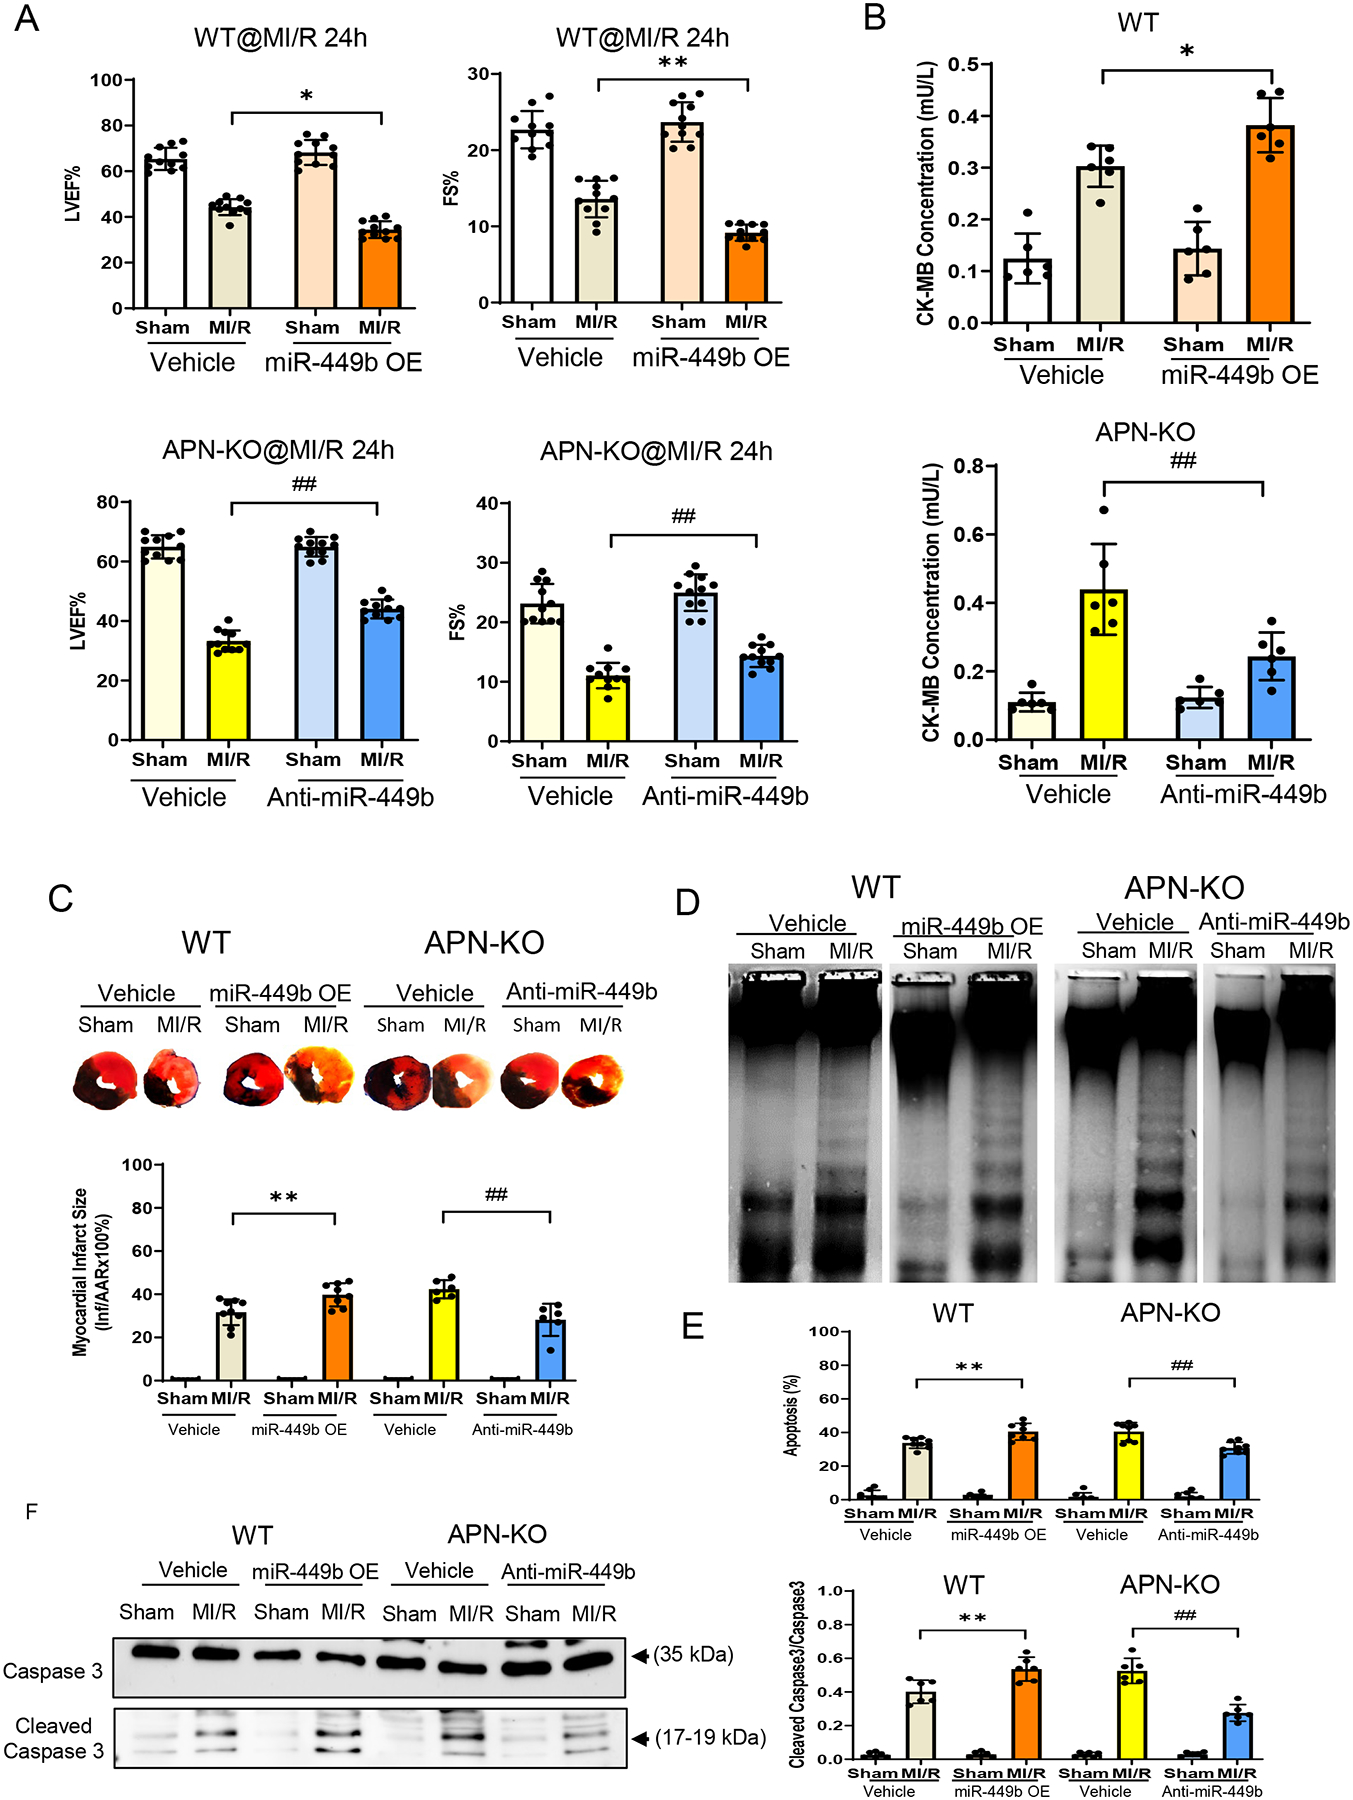
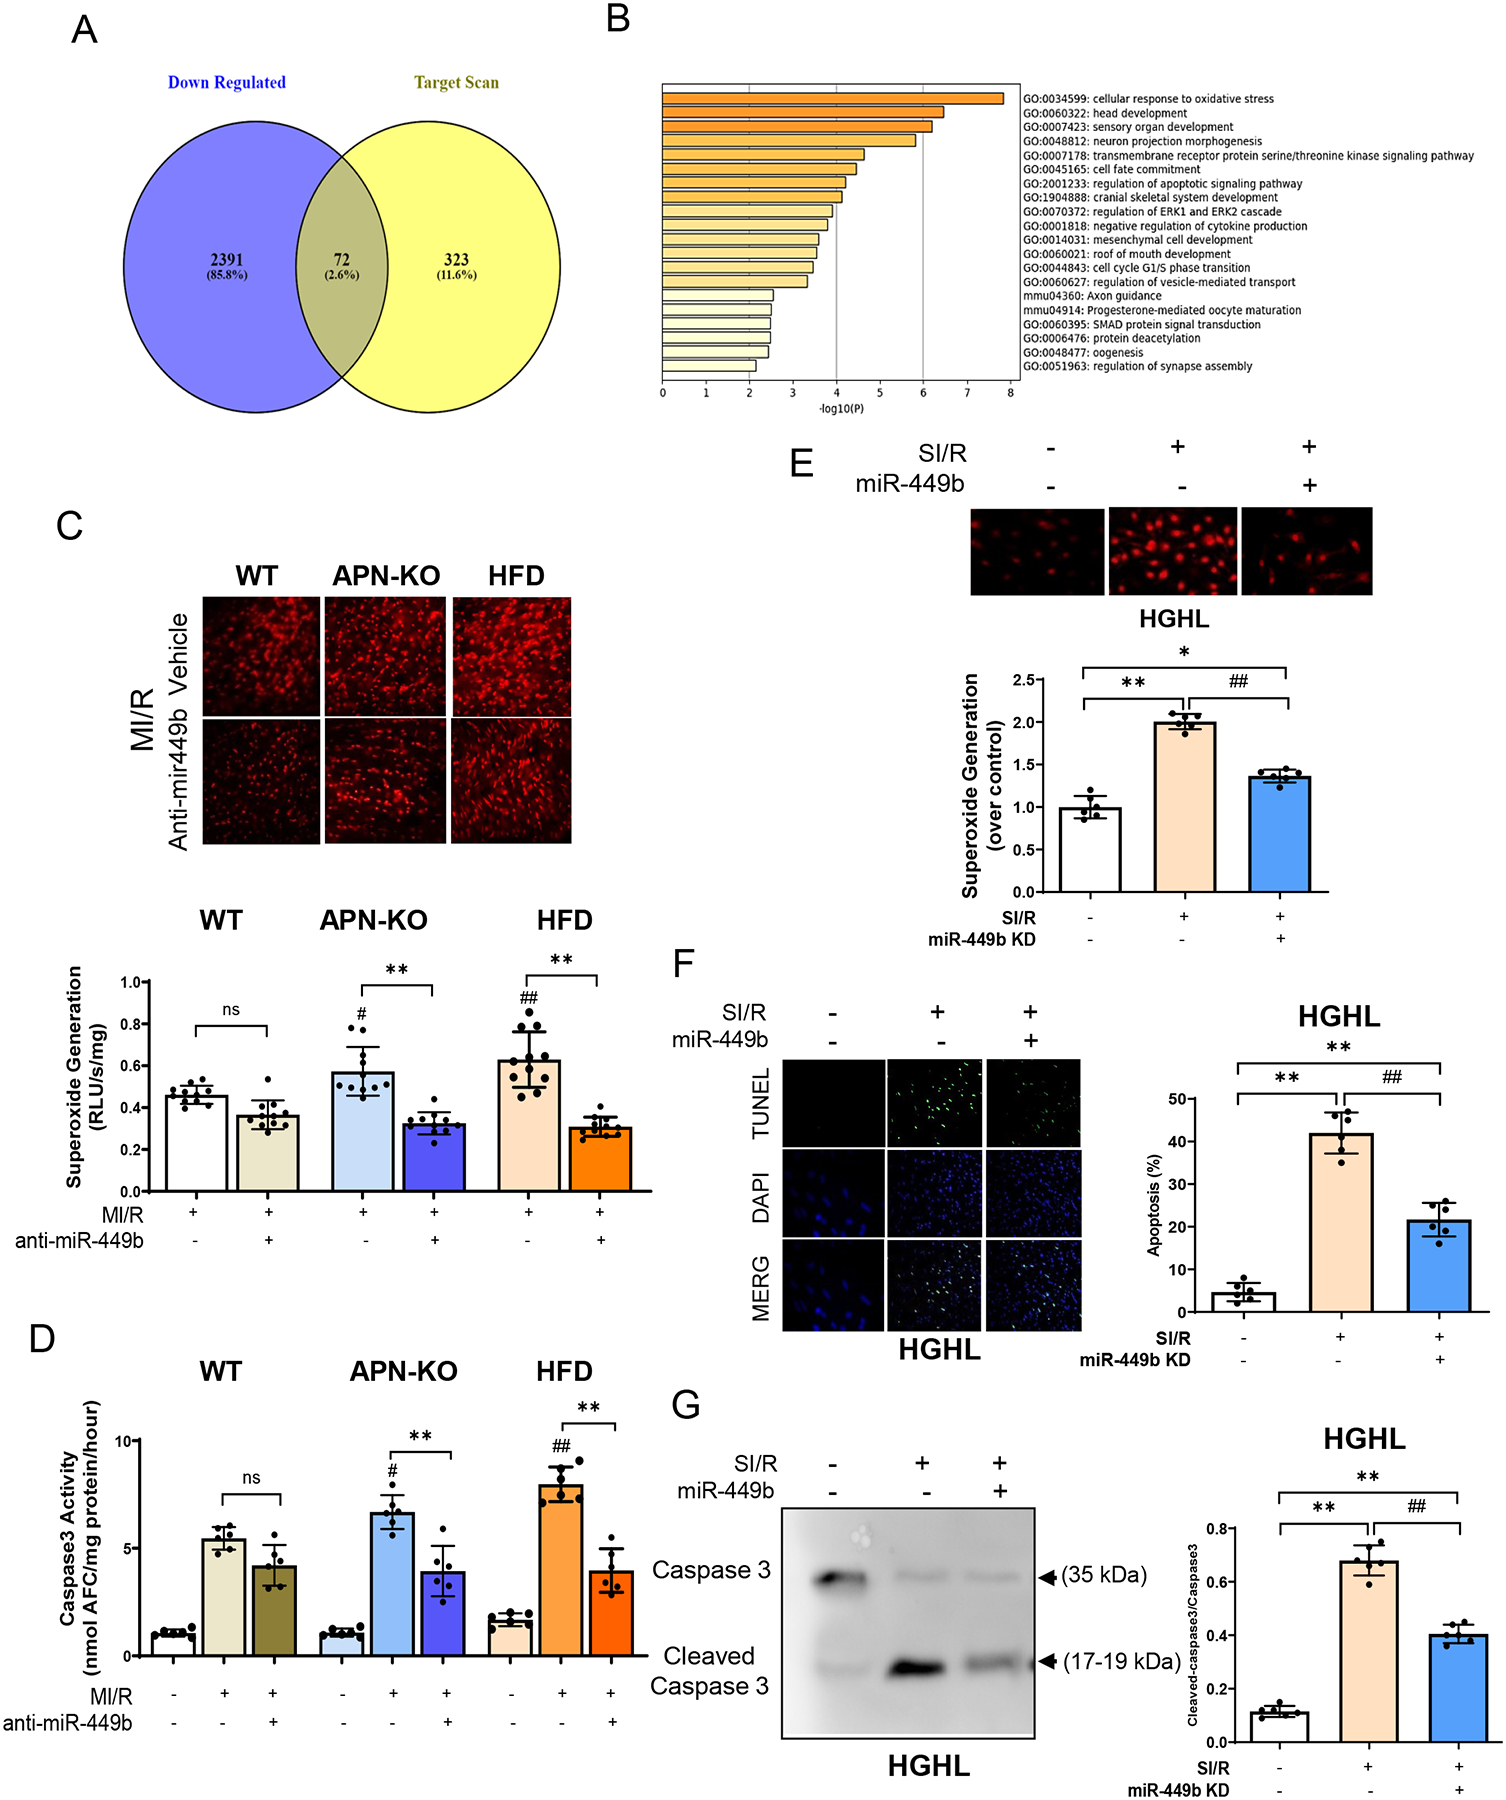
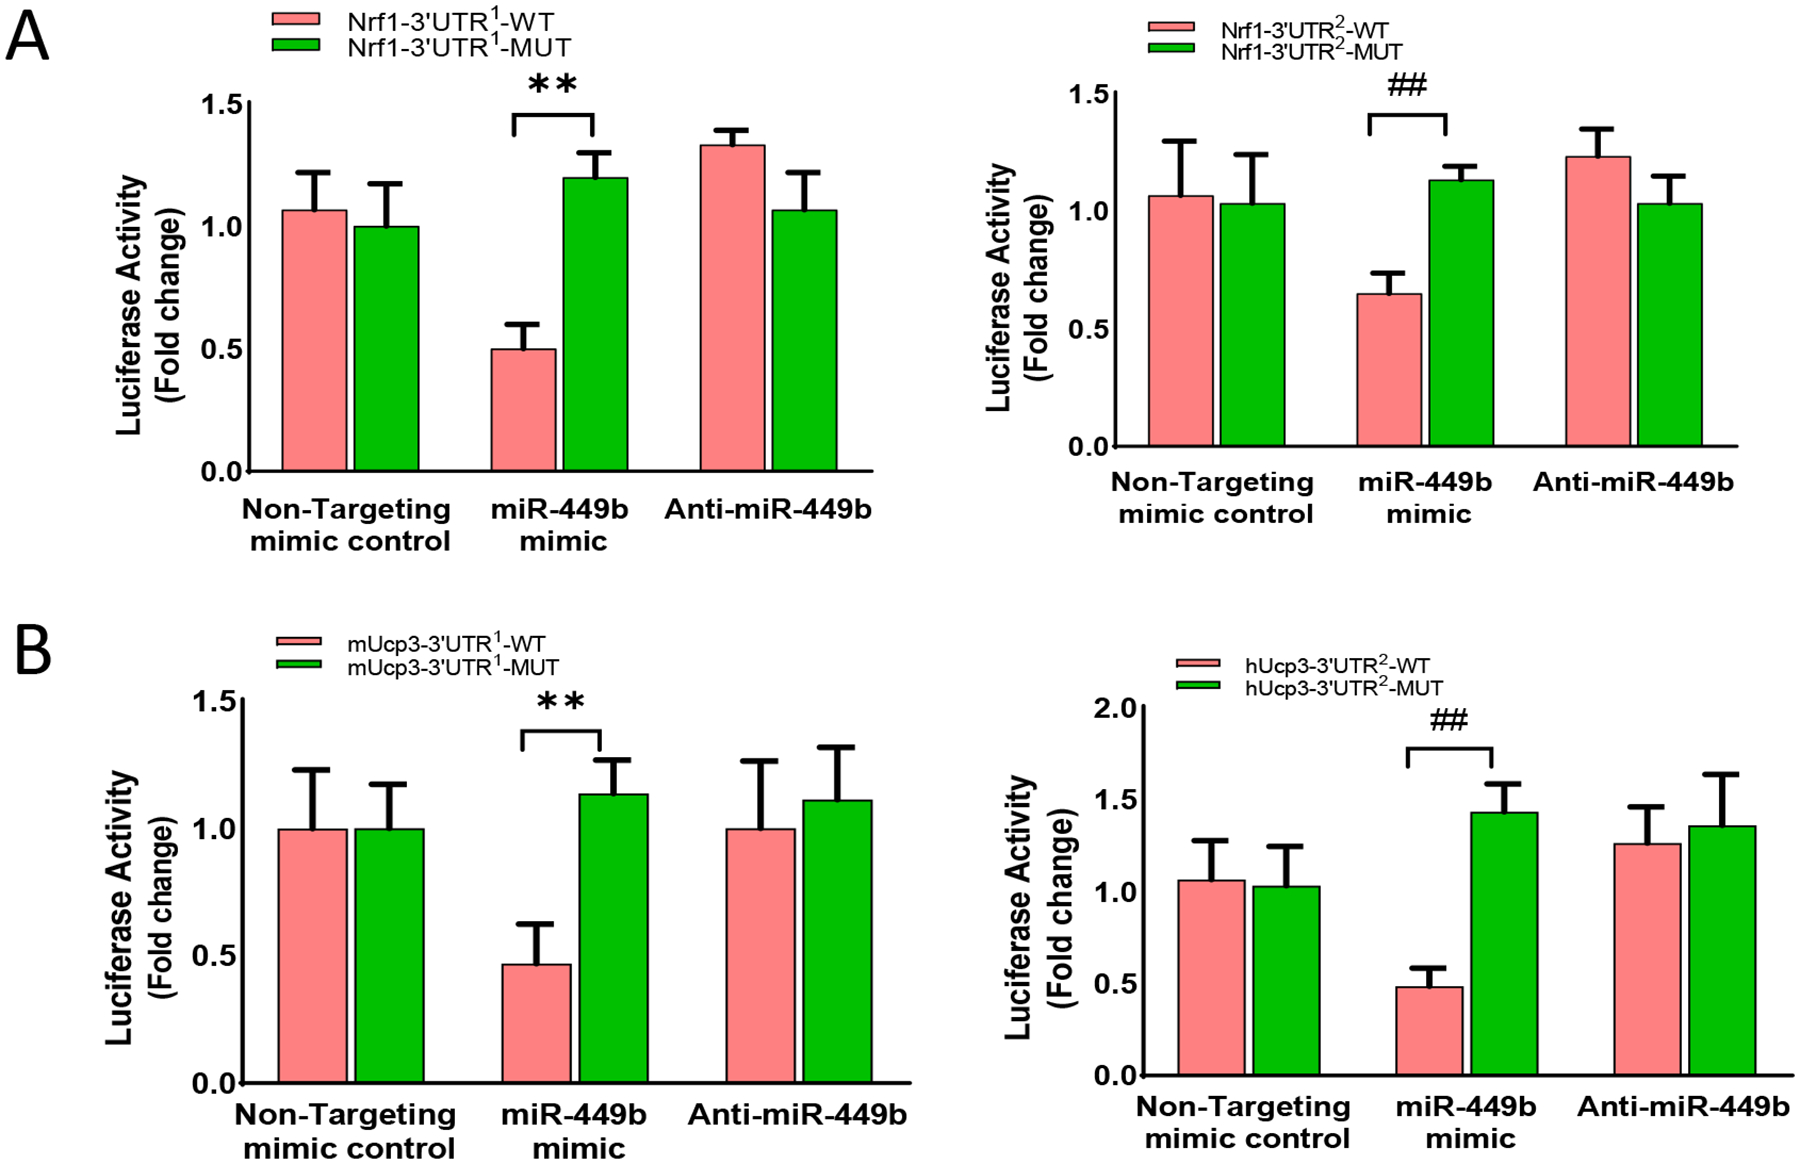
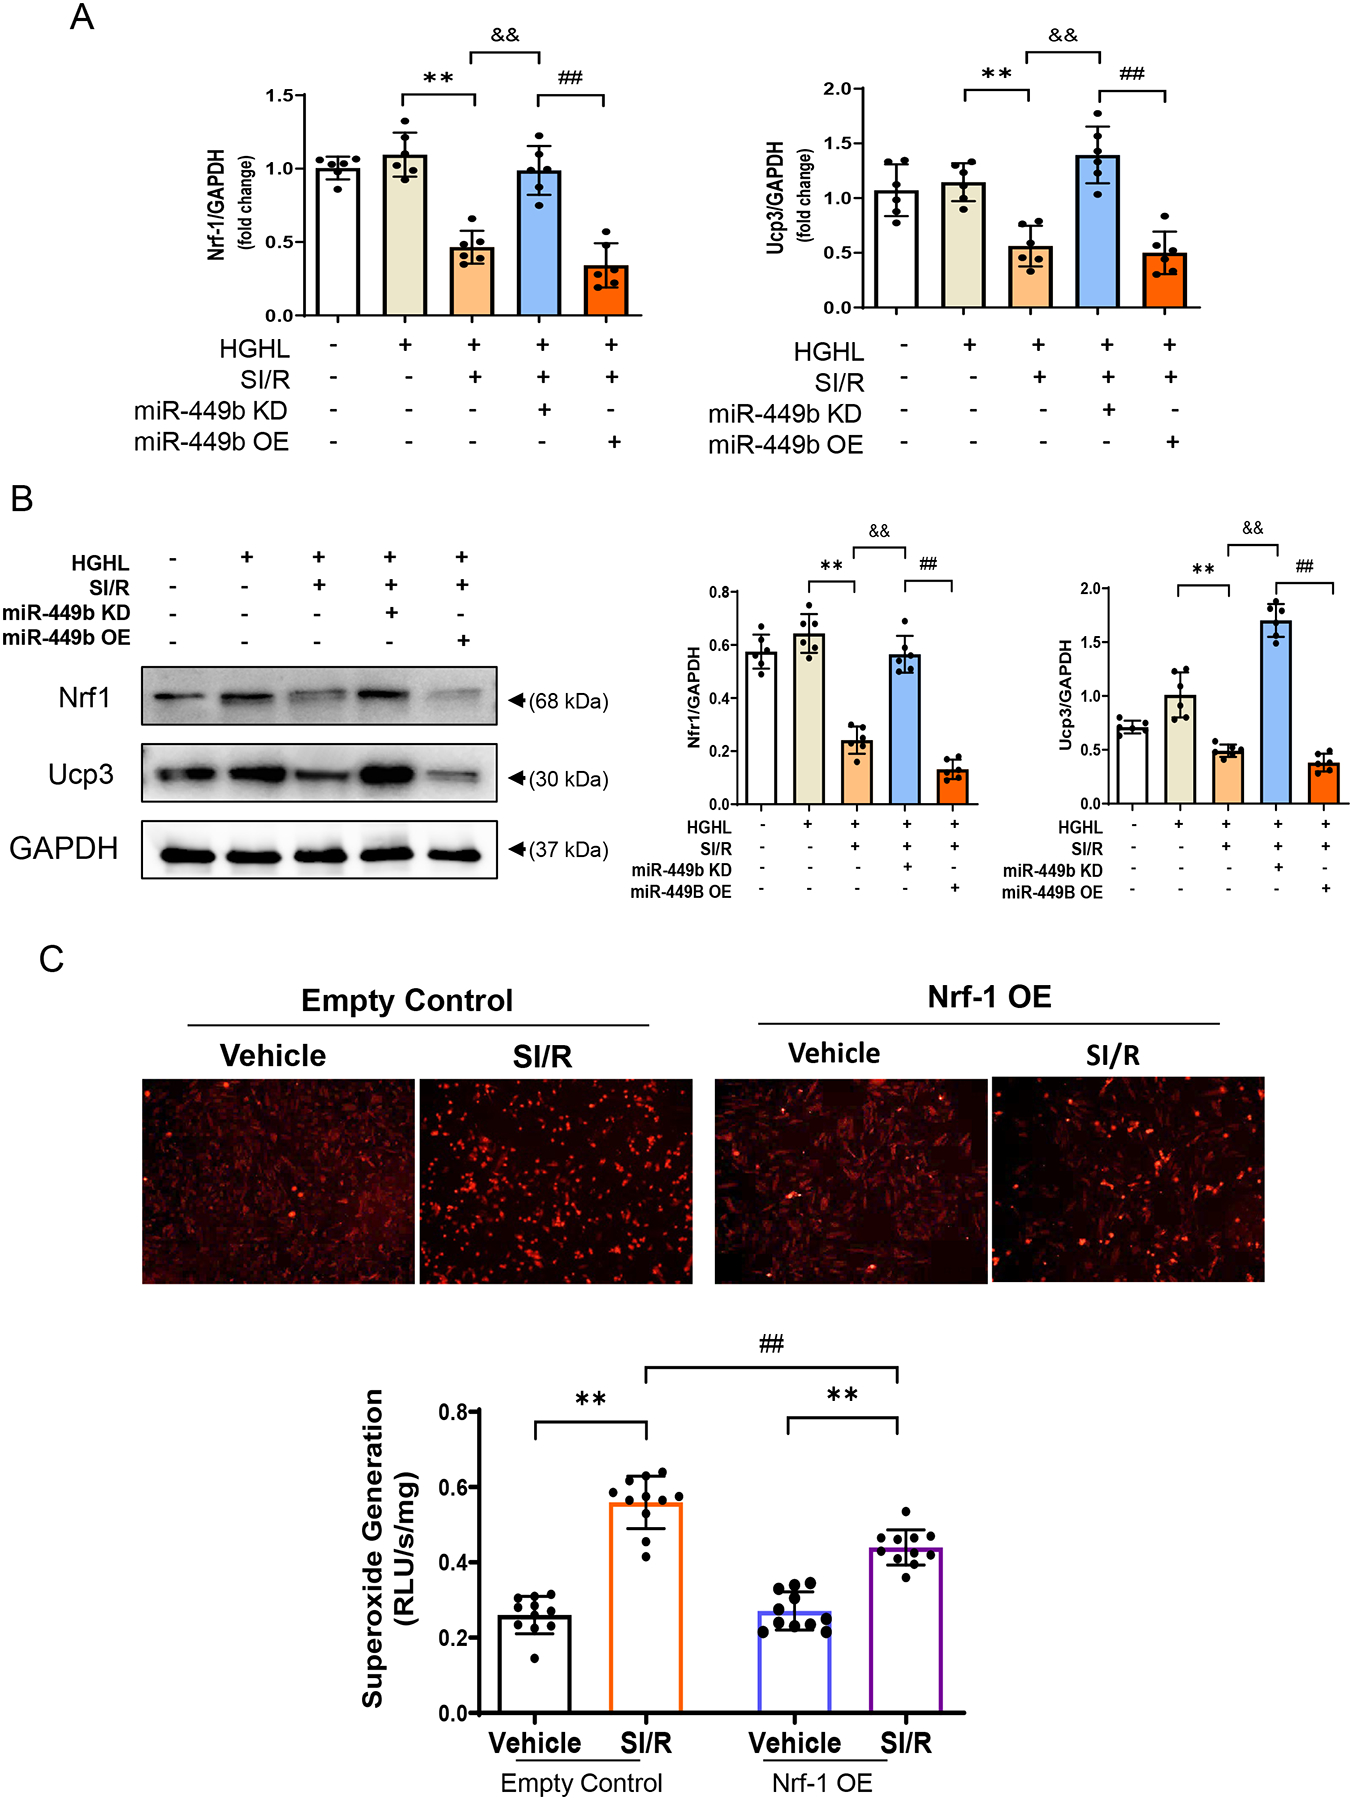
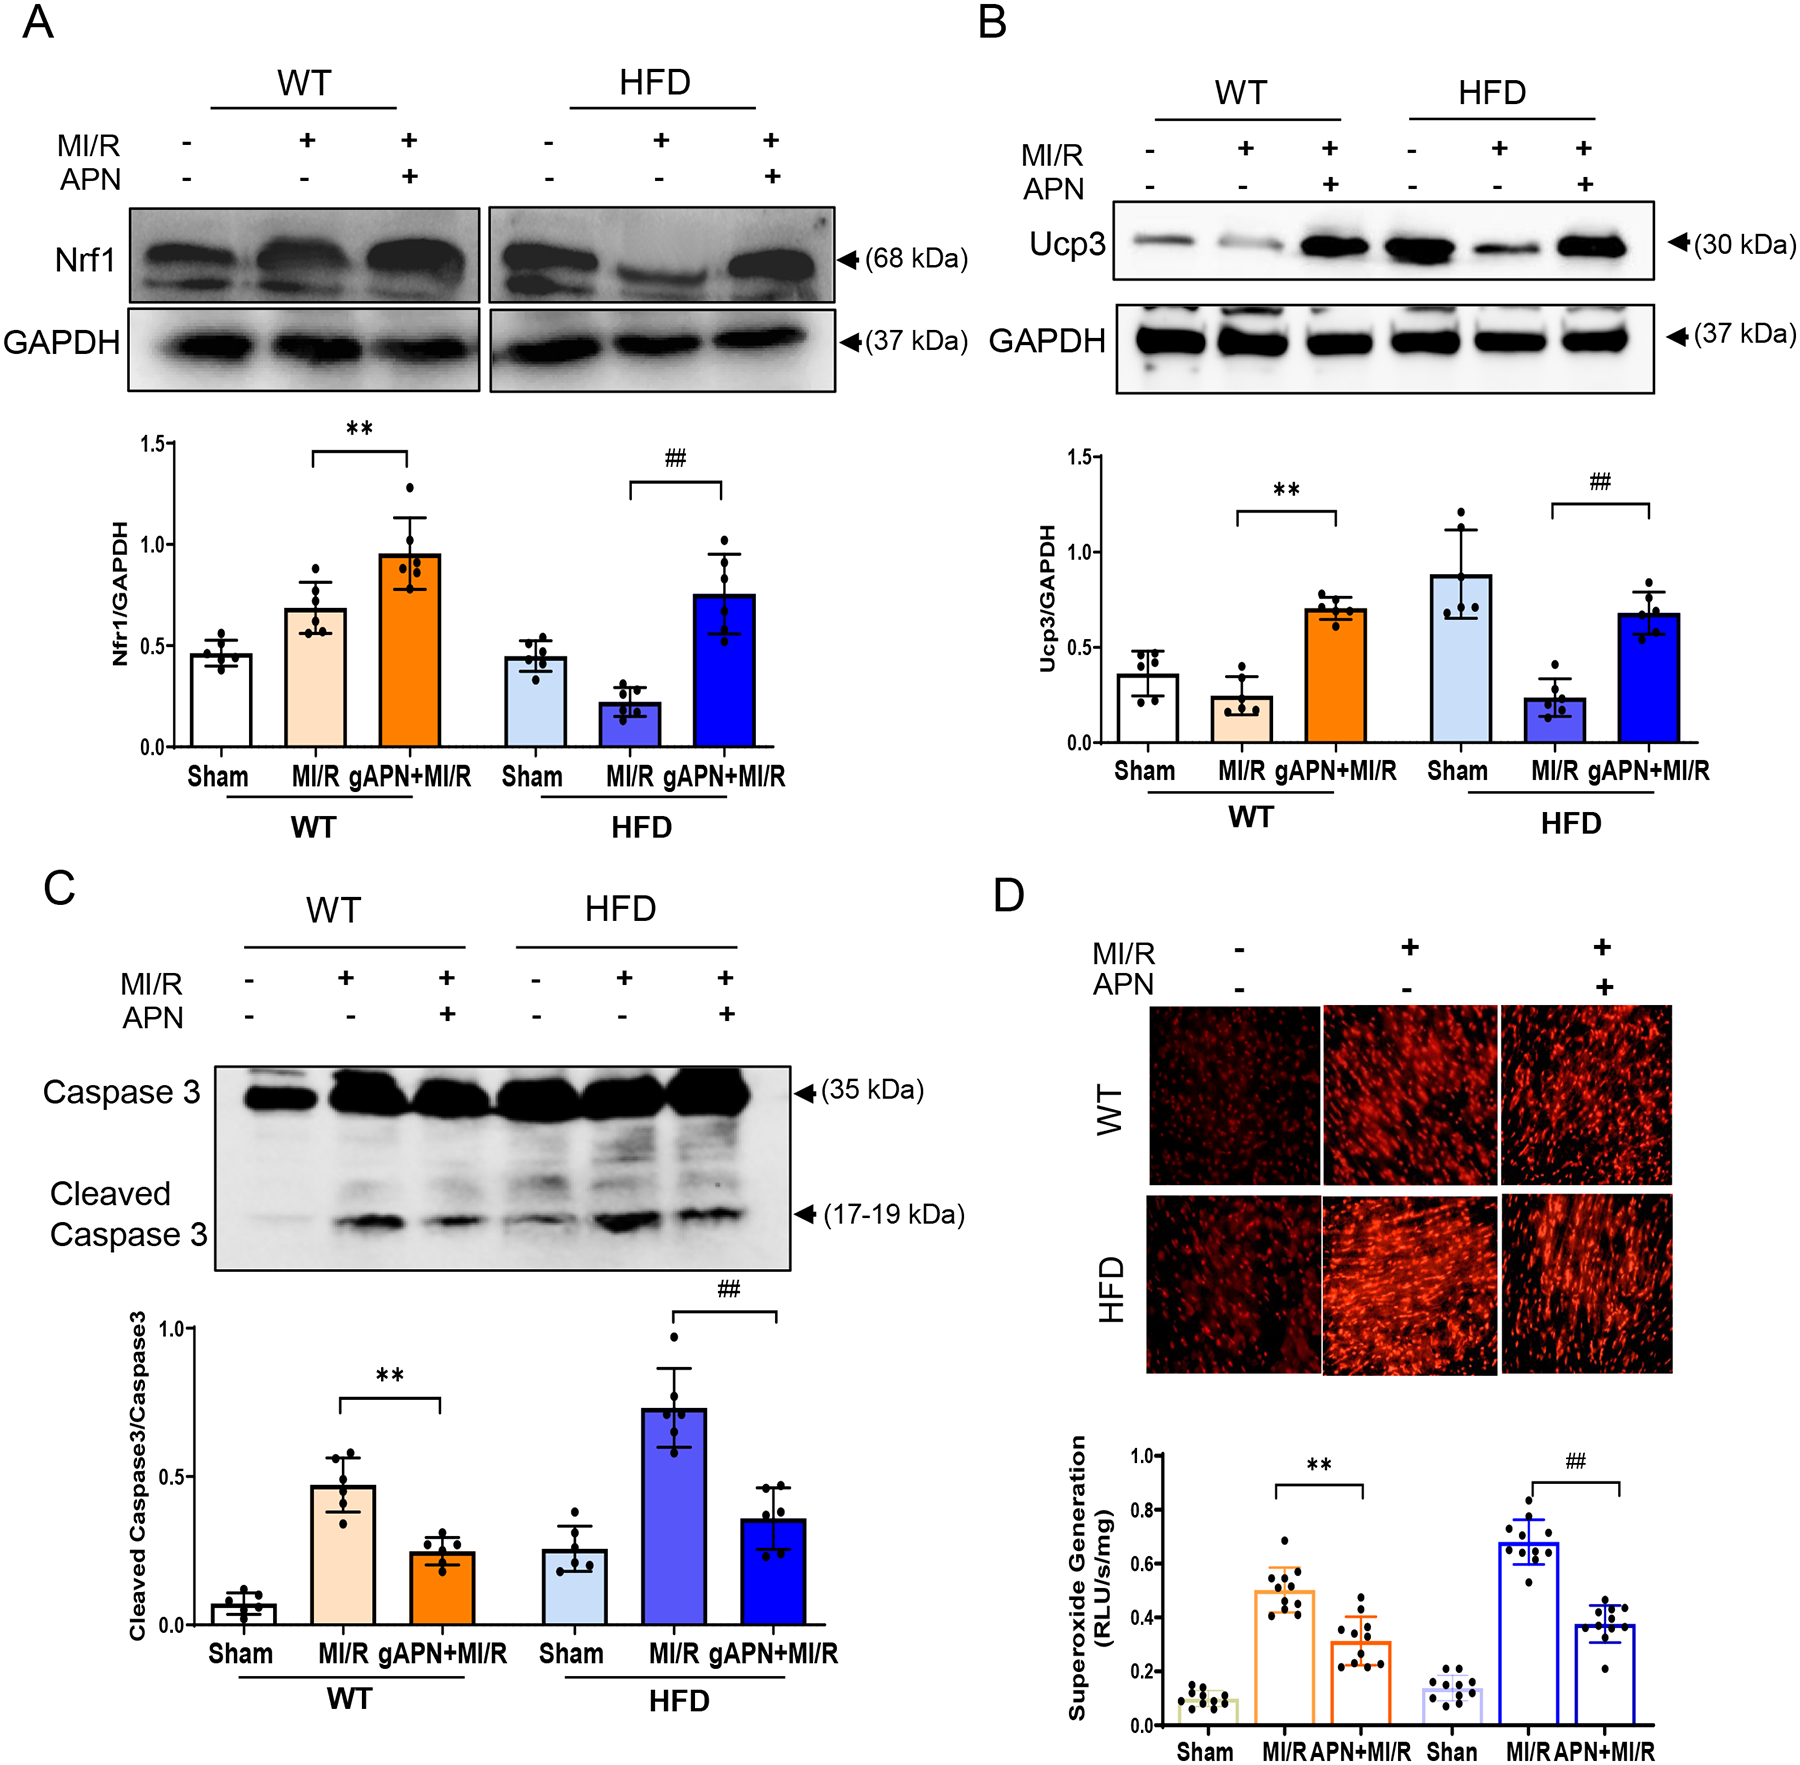
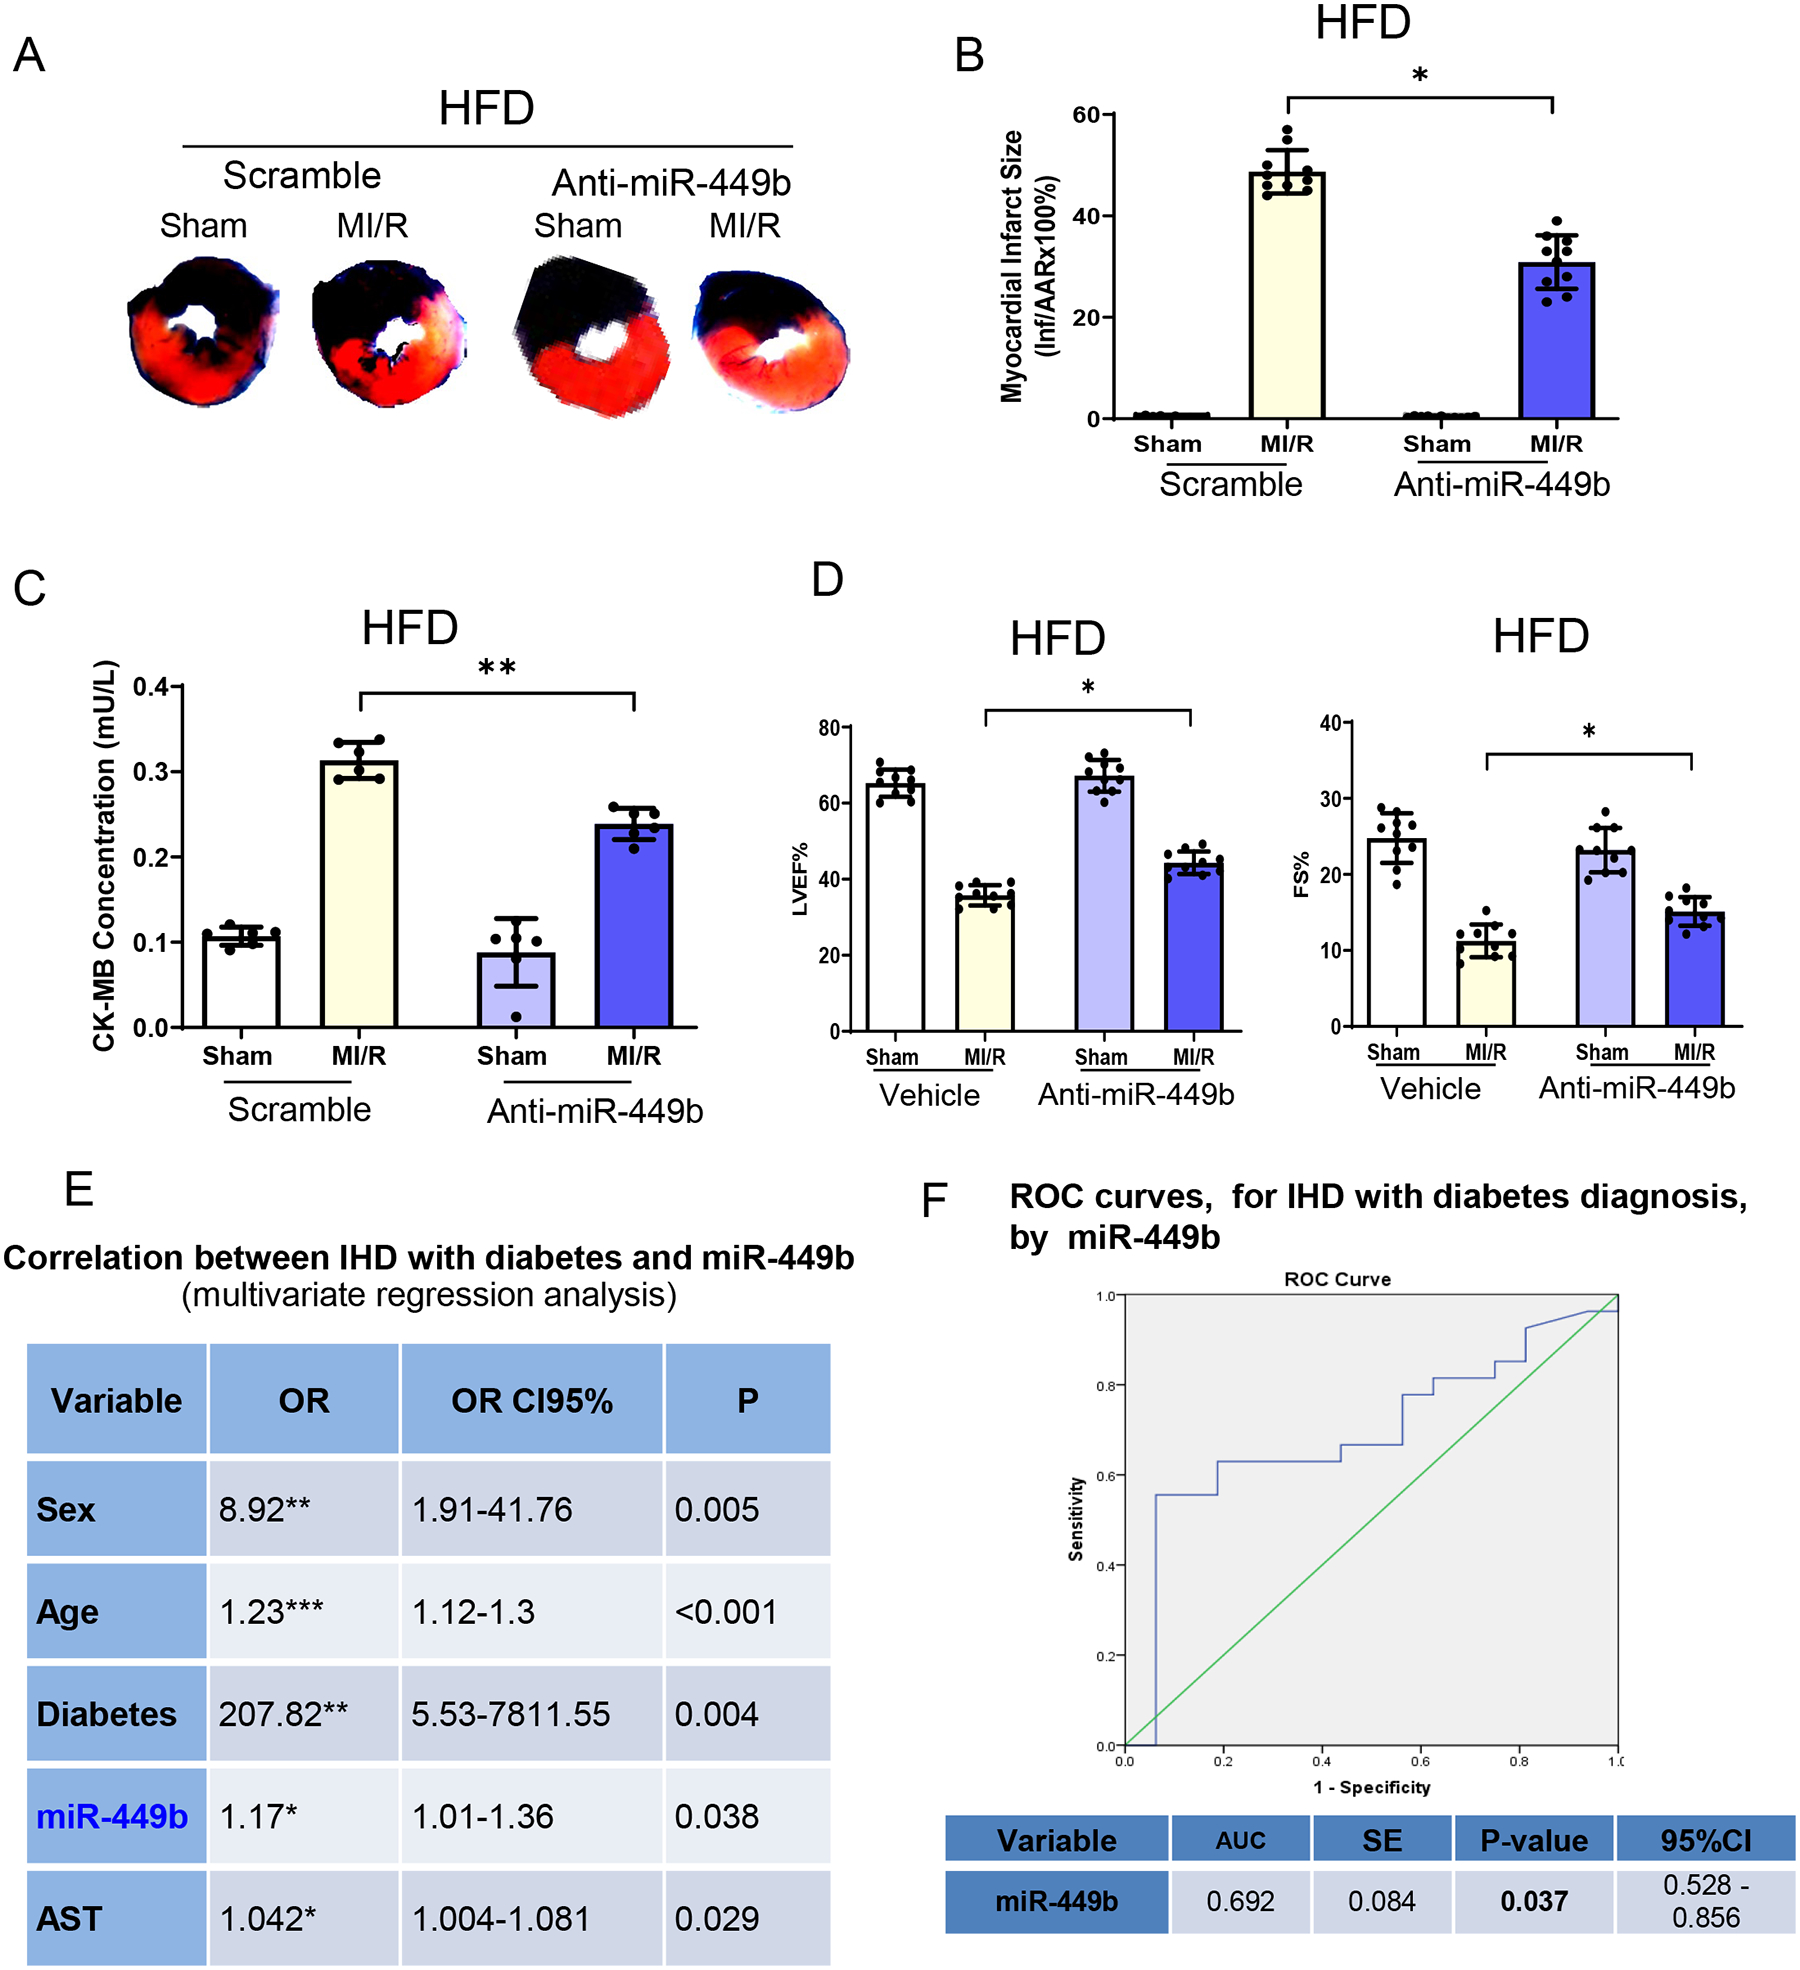
Diabetes enhances myocardial ischemic/reperfusion (MI/R) injury via an incompletely understood mechanism. Adiponectin (APN) is a cardioprotective adipokine suppressed by diabetes. However, how hypoadiponectinemia exacerbates cardiac injury remains incompletely understood. Dysregulation of miRNAs plays a significant role in disease development. However, whether hypoadiponectinemia alters cardiac miRNA profile, contributing to diabetic heart injury, remains unclear. Methods and Results: Wild-type (WT) and APN knockout (APN-KO) mice were subjected to MI/R. A cardiac microRNA profile was determined. Among 23 miRNAs increased in APN-KO mice following MI/R, miR-449b was most significantly upregulated (3.98-fold over WT mice). Administrating miR-449b mimic increased apoptosis, enlarged infarct size, and impaired cardiac function in WT mice. In contrast, anti-miR-449b decreased apoptosis, reduced infarct size, and improved cardiac function in APN-KO mice. Bioinformatic analysis predicted 73 miR-449b targeting genes, and GO analysis revealed oxidative stress as the top pathway regulated by these genes. Venn analysis followed by luciferase assay identified Nrf-1 and Ucp3 as the two most important miR-449b targets. In vivo administration of anti-miR-449b in APN-KO mice attenuated MI/R-stimulated superoxide overproduction. In vitro experiments demonstrated that high glucose/high lipid and simulated ischemia/reperfusion upregulated miR-449b and inhibited Nrf-1 and Ucp3 expression. These pathological effects were attenuated by anti-miR-449b or Nrf-1 overexpression. In a final attempt to validate our finding in a clinically relevant model, high-fat diet (HFD)-induced diabetic mice were subjected to MI/R and treated with anti-miR-449b or APN. Diabetes significantly increased miR-449b expression and downregulated Nrf-1 and Ucp3 expression. Administration of anti-miR-449b or APN preserved cardiac Nrf-1 expression, reduced cardiac oxidative stress, decreased apoptosis and infarct size, and improved cardiac function. Conclusion: We demonstrated for the first time that hypoadiponectinemia upregulates miR-449b and suppresses Nrf-1/Ucp3 expression, promoting oxidative stress and exacerbating MI/R injury in this population. Dysregulated APN/miR-449b/oxidative stress pathway is a potential therapeutic target against diabetic MI/R injury.
Keywords: Adiponectin; Antioxidant; Diabetes; Ischemia/reperfusion; microRNA.
Copyright © 2023 Elsevier Ltd. All rights reserved.
Conflict of interest statement
Declaration of Competing Interest The authors declare that there are no conflicts of interest.
Figures
Similar articles
-
Dynamic alteration of adiponectin/adiponectin receptor expression and its impact on myocardial ischemia/reperfusion in type 1 diabetic mice.Am J Physiol Endocrinol Metab. 2011 Sep;301(3):E447-55. doi: 10.1152/ajpendo.00687.2010. Epub 2011 May 17. Am J Physiol Endocrinol Metab. 2011. PMID: 21586697
-
TNF-α antagonism ameliorates myocardial ischemia-reperfusion injury in mice by upregulating adiponectin.Am J Physiol Heart Circ Physiol. 2015 Jun 15;308(12):H1583-91. doi: 10.1152/ajpheart.00346.2014. Epub 2015 Apr 17. Am J Physiol Heart Circ Physiol. 2015. PMID: 25888509
-
Small Extracellular Microvesicles Mediated Pathological Communications Between Dysfunctional Adipocytes and Cardiomyocytes as a Novel Mechanism Exacerbating Ischemia/Reperfusion Injury in Diabetic Mice.Circulation. 2020 Mar 24;141(12):968-983. doi: 10.1161/CIRCULATIONAHA.119.042640. Epub 2020 Jan 10. Circulation. 2020. PMID: 31918577 Free PMC article.
-
Adiponectin: its role in diabetic and pancreatic cancer.Mol Aspects Med. 2025 Jun;103:101370. doi: 10.1016/j.mam.2025.101370. Epub 2025 May 21. Mol Aspects Med. 2025. PMID: 40403652 Review.
-
Cardioprotection by adiponectin.Trends Cardiovasc Med. 2006 Jul;16(5):141-6. doi: 10.1016/j.tcm.2006.03.001. Trends Cardiovasc Med. 2006. PMID: 16781946 Free PMC article. Review.
Cited by
-
Adipokines and their potential impacts on susceptibility to myocardial ischemia/reperfusion injury in diabetes.Lipids Health Dis. 2024 Nov 13;23(1):372. doi: 10.1186/s12944-024-02357-w. Lipids Health Dis. 2024. PMID: 39538244 Free PMC article. Review.
-
Association of MiRNA Polymorphisms Involved in the PI3K/ATK/GSK3β Pathway with T2DM in a Chinese Population.Pharmgenomics Pers Med. 2025 Feb 14;18:71-84. doi: 10.2147/PGPM.S487873. eCollection 2025. Pharmgenomics Pers Med. 2025. PMID: 39974346 Free PMC article.
-
Research progress of non-coding RNA regulating the role of PANoptosis in diabetes mellitus and its complications.Apoptosis. 2025 Apr;30(3-4):516-536. doi: 10.1007/s10495-024-02066-w. Epub 2025 Jan 4. Apoptosis. 2025. PMID: 39755822 Review.
-
MiR-449b-5p Ameliorates Hypoxia-induced Cardiomyocyte Injury through Activating PI3K/AKT Pathway by Targeting BCL2L13.Appl Biochem Biotechnol. 2024 Apr 6. doi: 10.1007/s12010-024-04931-5. Online ahead of print. Appl Biochem Biotechnol. 2024. PMID: 38581629
References
-
- McGovern PG, Pankow JS, Shahar E, Doliszny KM, Folsom AR, Blackburn H, Luepker RV, Recent trends in acute coronary heart disease--mortality, morbidity, medical care, and risk factors. The Minnesota Heart Survey Investigators, N Engl J Med 334(14) (1996) 884–90. - PubMed
-
- Crowley A, Menon V, Lessard D, Yarzebski J, Jackson E, Gore JM, Goldberg RJ, Sex differences in survival after acute myocardial infarction in patients with diabetes mellitus (Worcester Heart Attack Study), Am Heart J 146(5) (2003) 824–31. - PubMed
-
- Marso SP, Miller T, Rutherford BD, Gibbons RJ, Qureshi M, Kalynych A, Turco M, Schultheiss HP, Mehran R, Krucoff MW, Lansky AJ, Stone GW, Comparison of myocardial reperfusion in patients undergoing percutaneous coronary intervention in ST-segment elevation acute myocardial infarction with versus without diabetes mellitus (from the EMERALD Trial), Am J Cardiol 100(2) (2007) 206–10. - PubMed
-
- Lau WB, Ohashi K, Wang Y, Ogawa H, Murohara T, Ma XL, Ouchi N, Role of Adipokines in Cardiovascular Disease, Circ J 81(7) (2017) 920–928. - PubMed
Publication types
MeSH terms
Substances
Supplementary concepts
Grants and funding
LinkOut - more resources
Full Text Sources
Molecular Biology Databases
Research Materials
Miscellaneous
