. 2023 Jul 11;35(7):1179-1194.e5.
doi: 10.1016/j.cmet.2023.05.003.

Prolonged fasting times reap greater geroprotective effects when combined with caloric restriction in adult female mice

Affiliations

Prolonged fasting times reap greater geroprotective effects when combined with caloric restriction in adult female mice

Eleonora Duregon et al. Cell Metab. .

Abstract

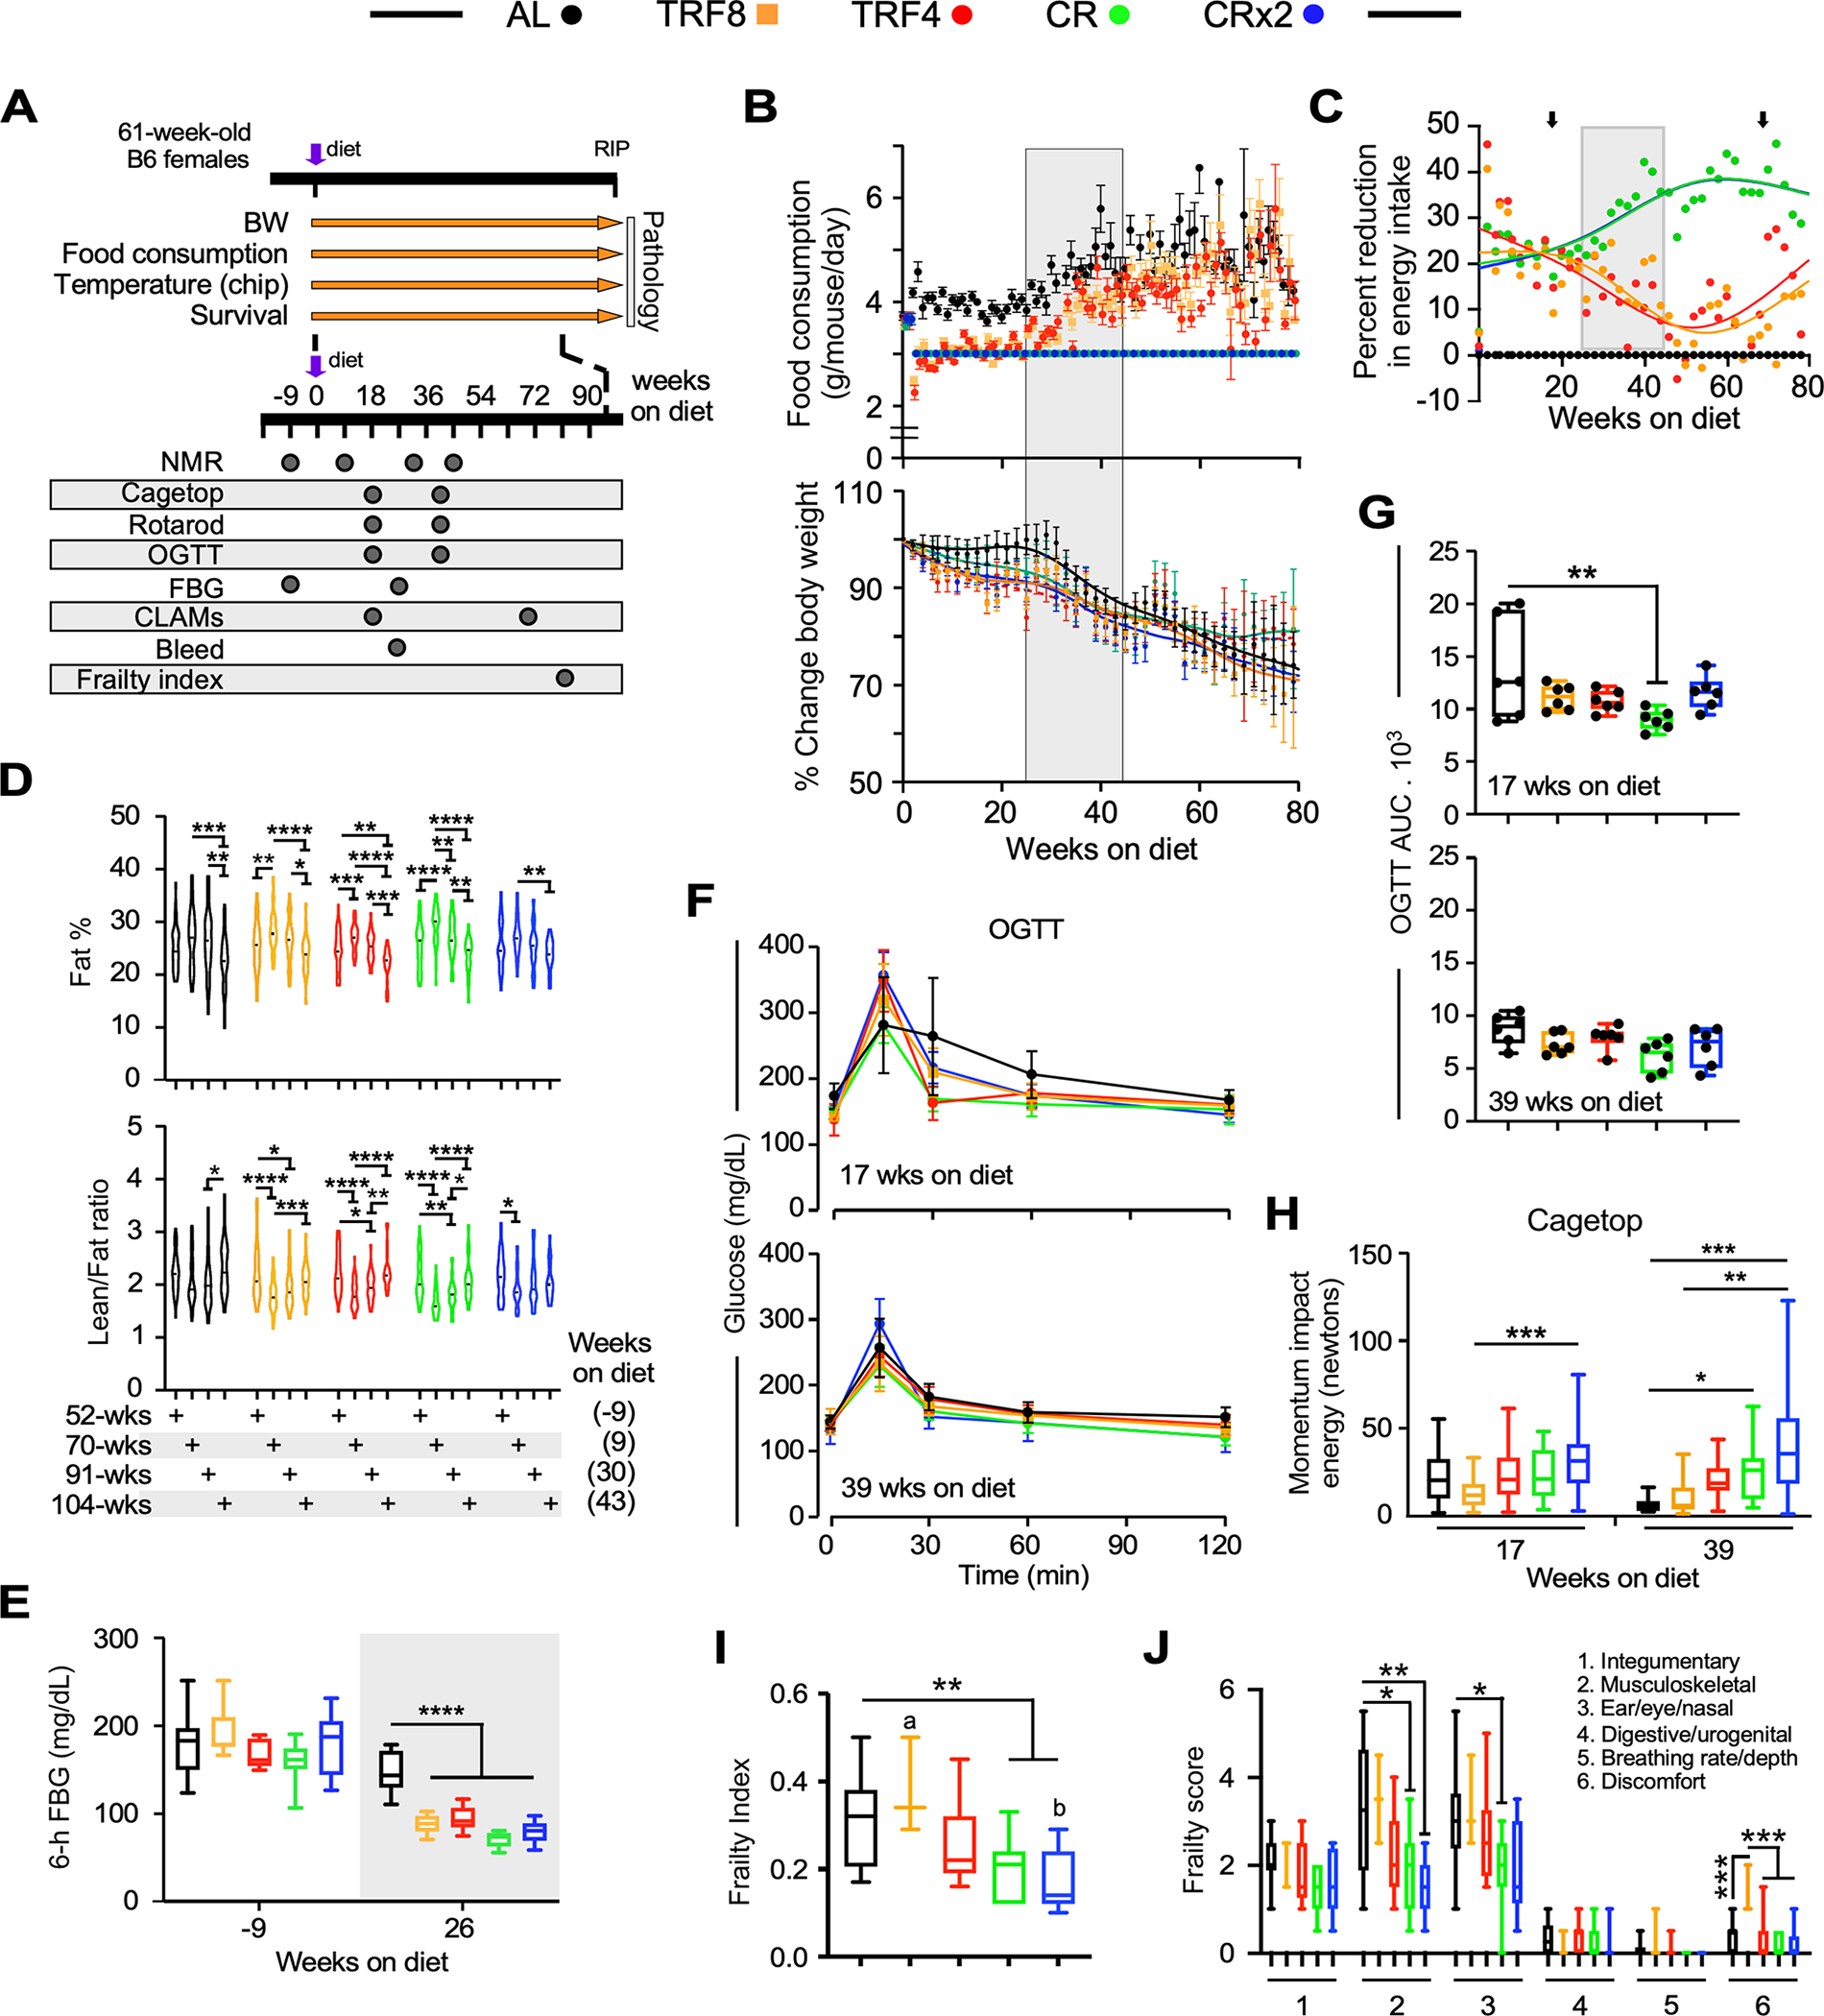
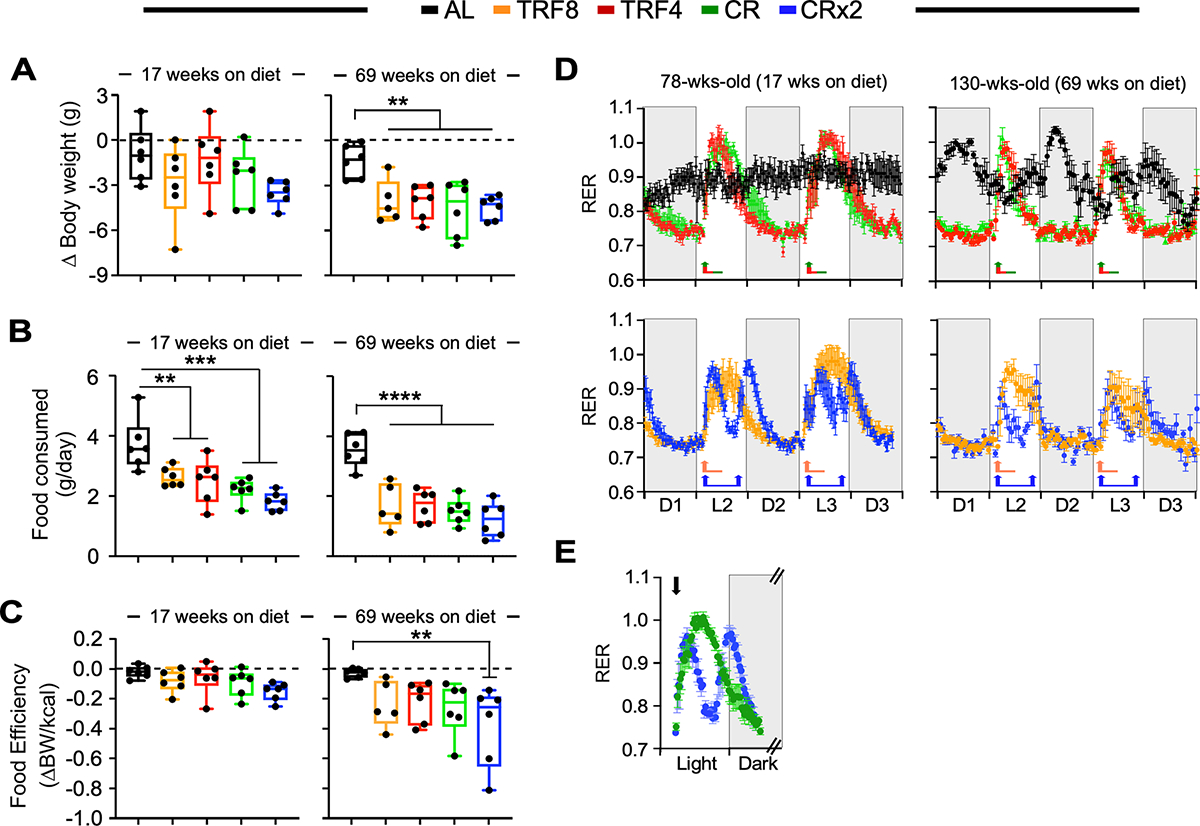
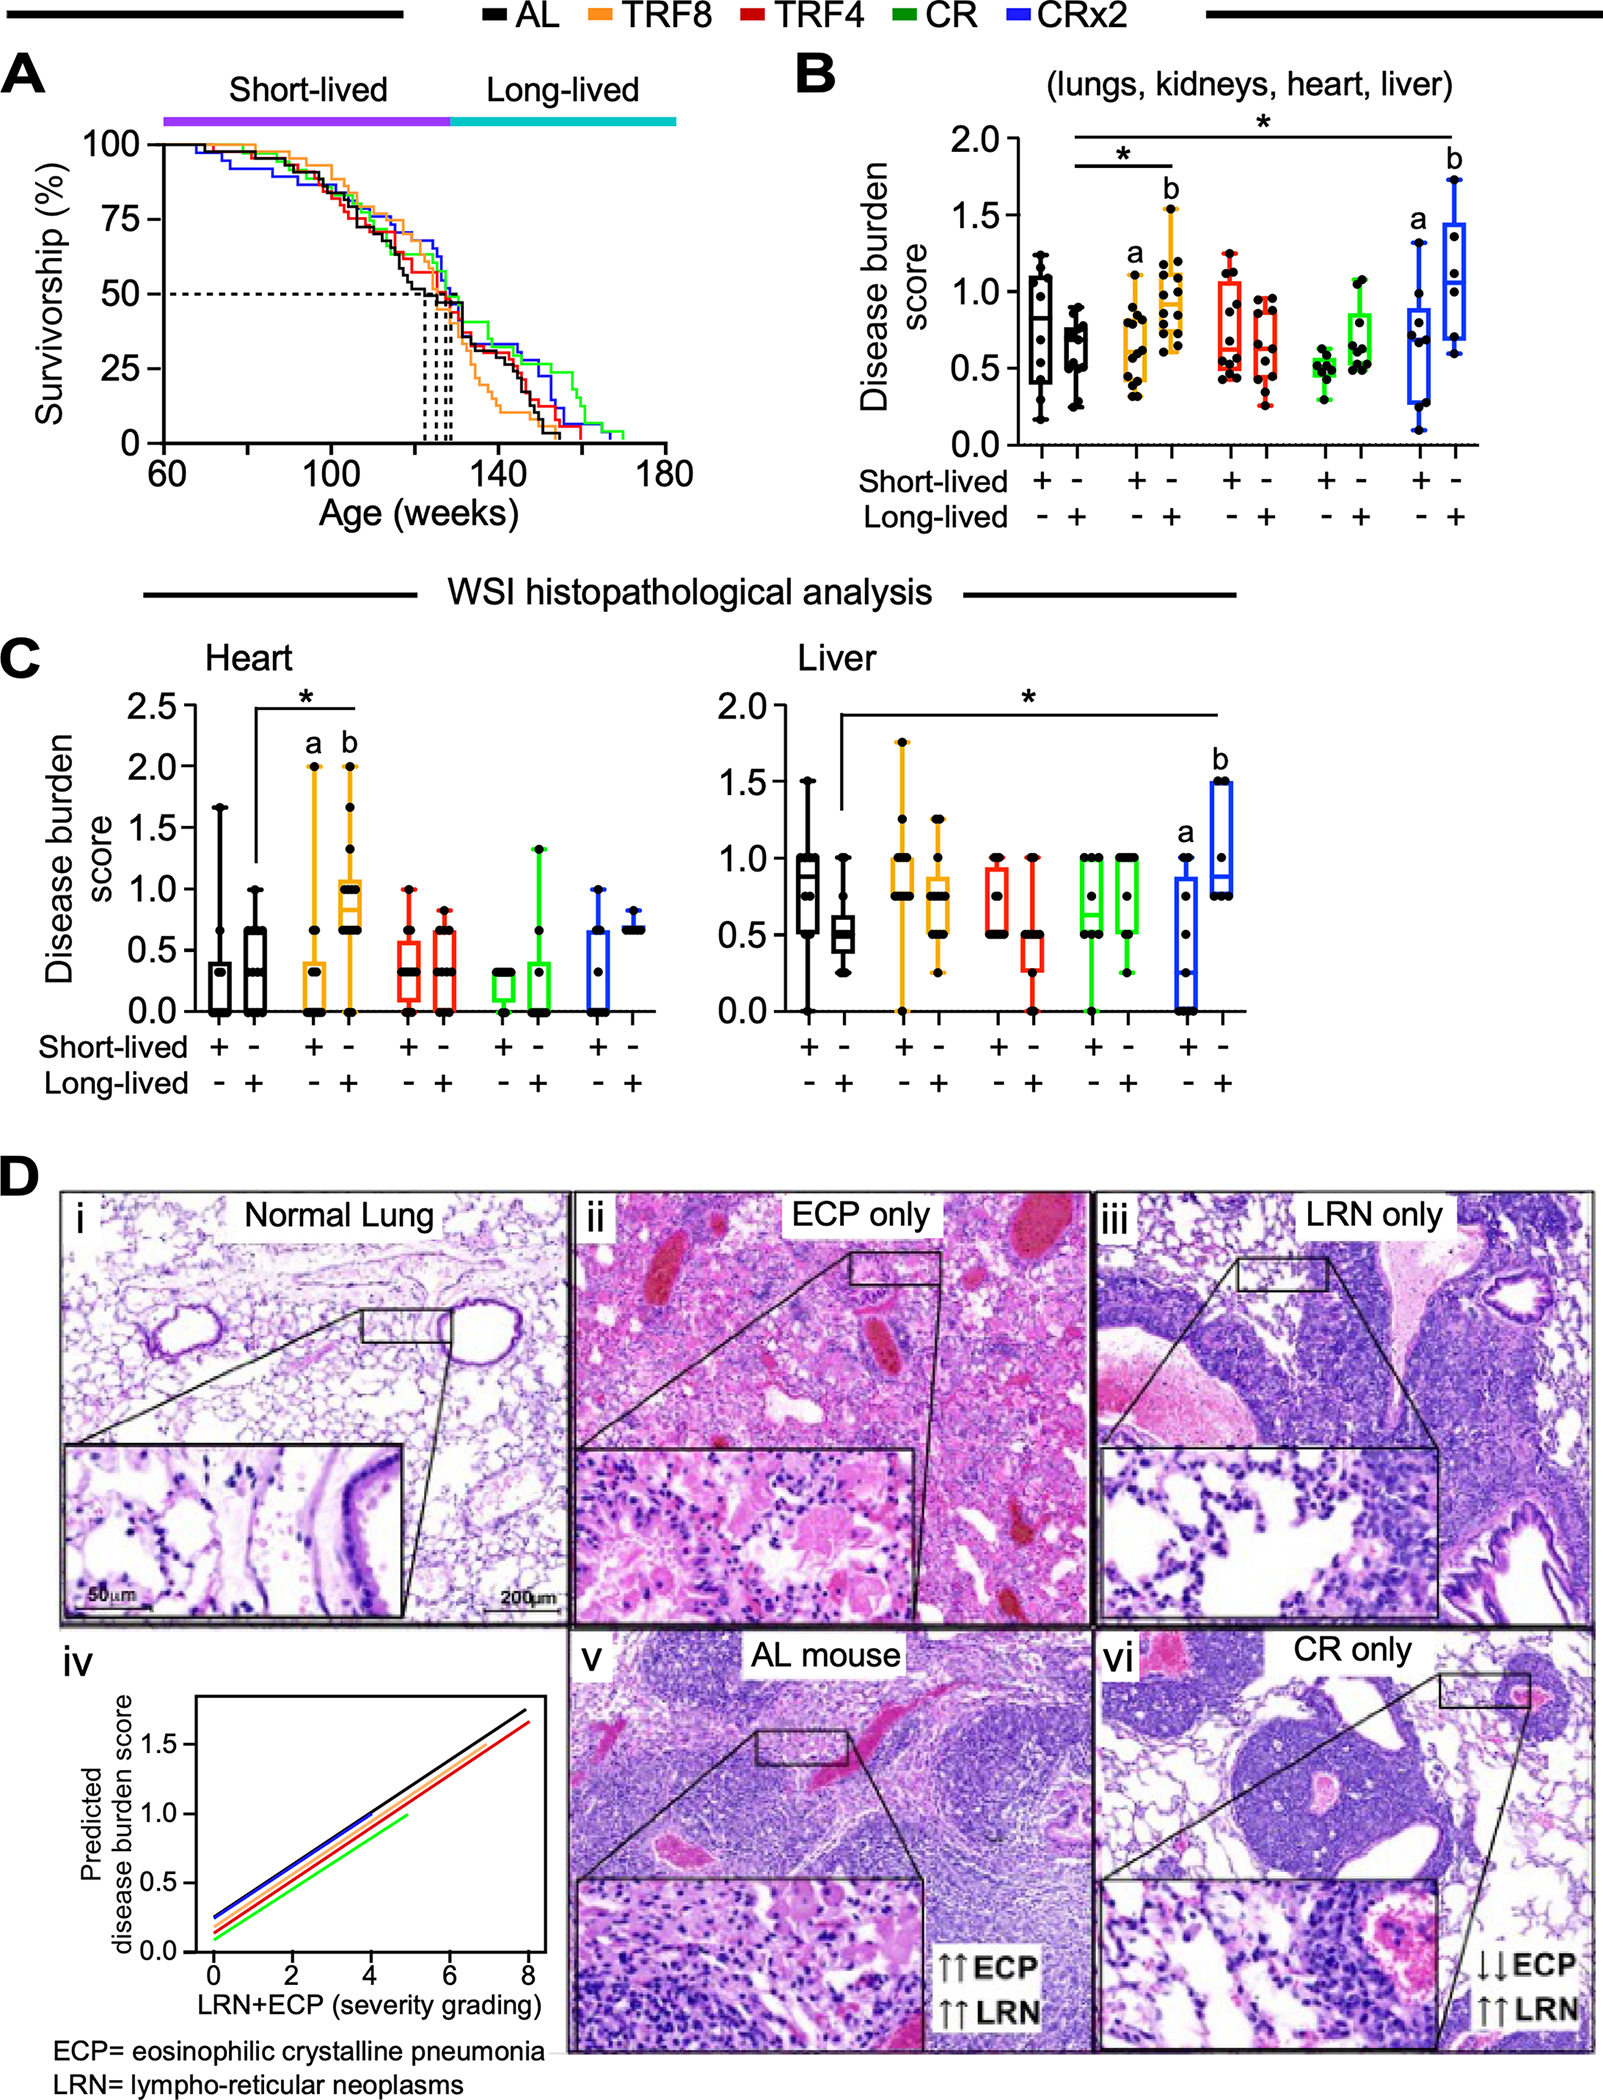
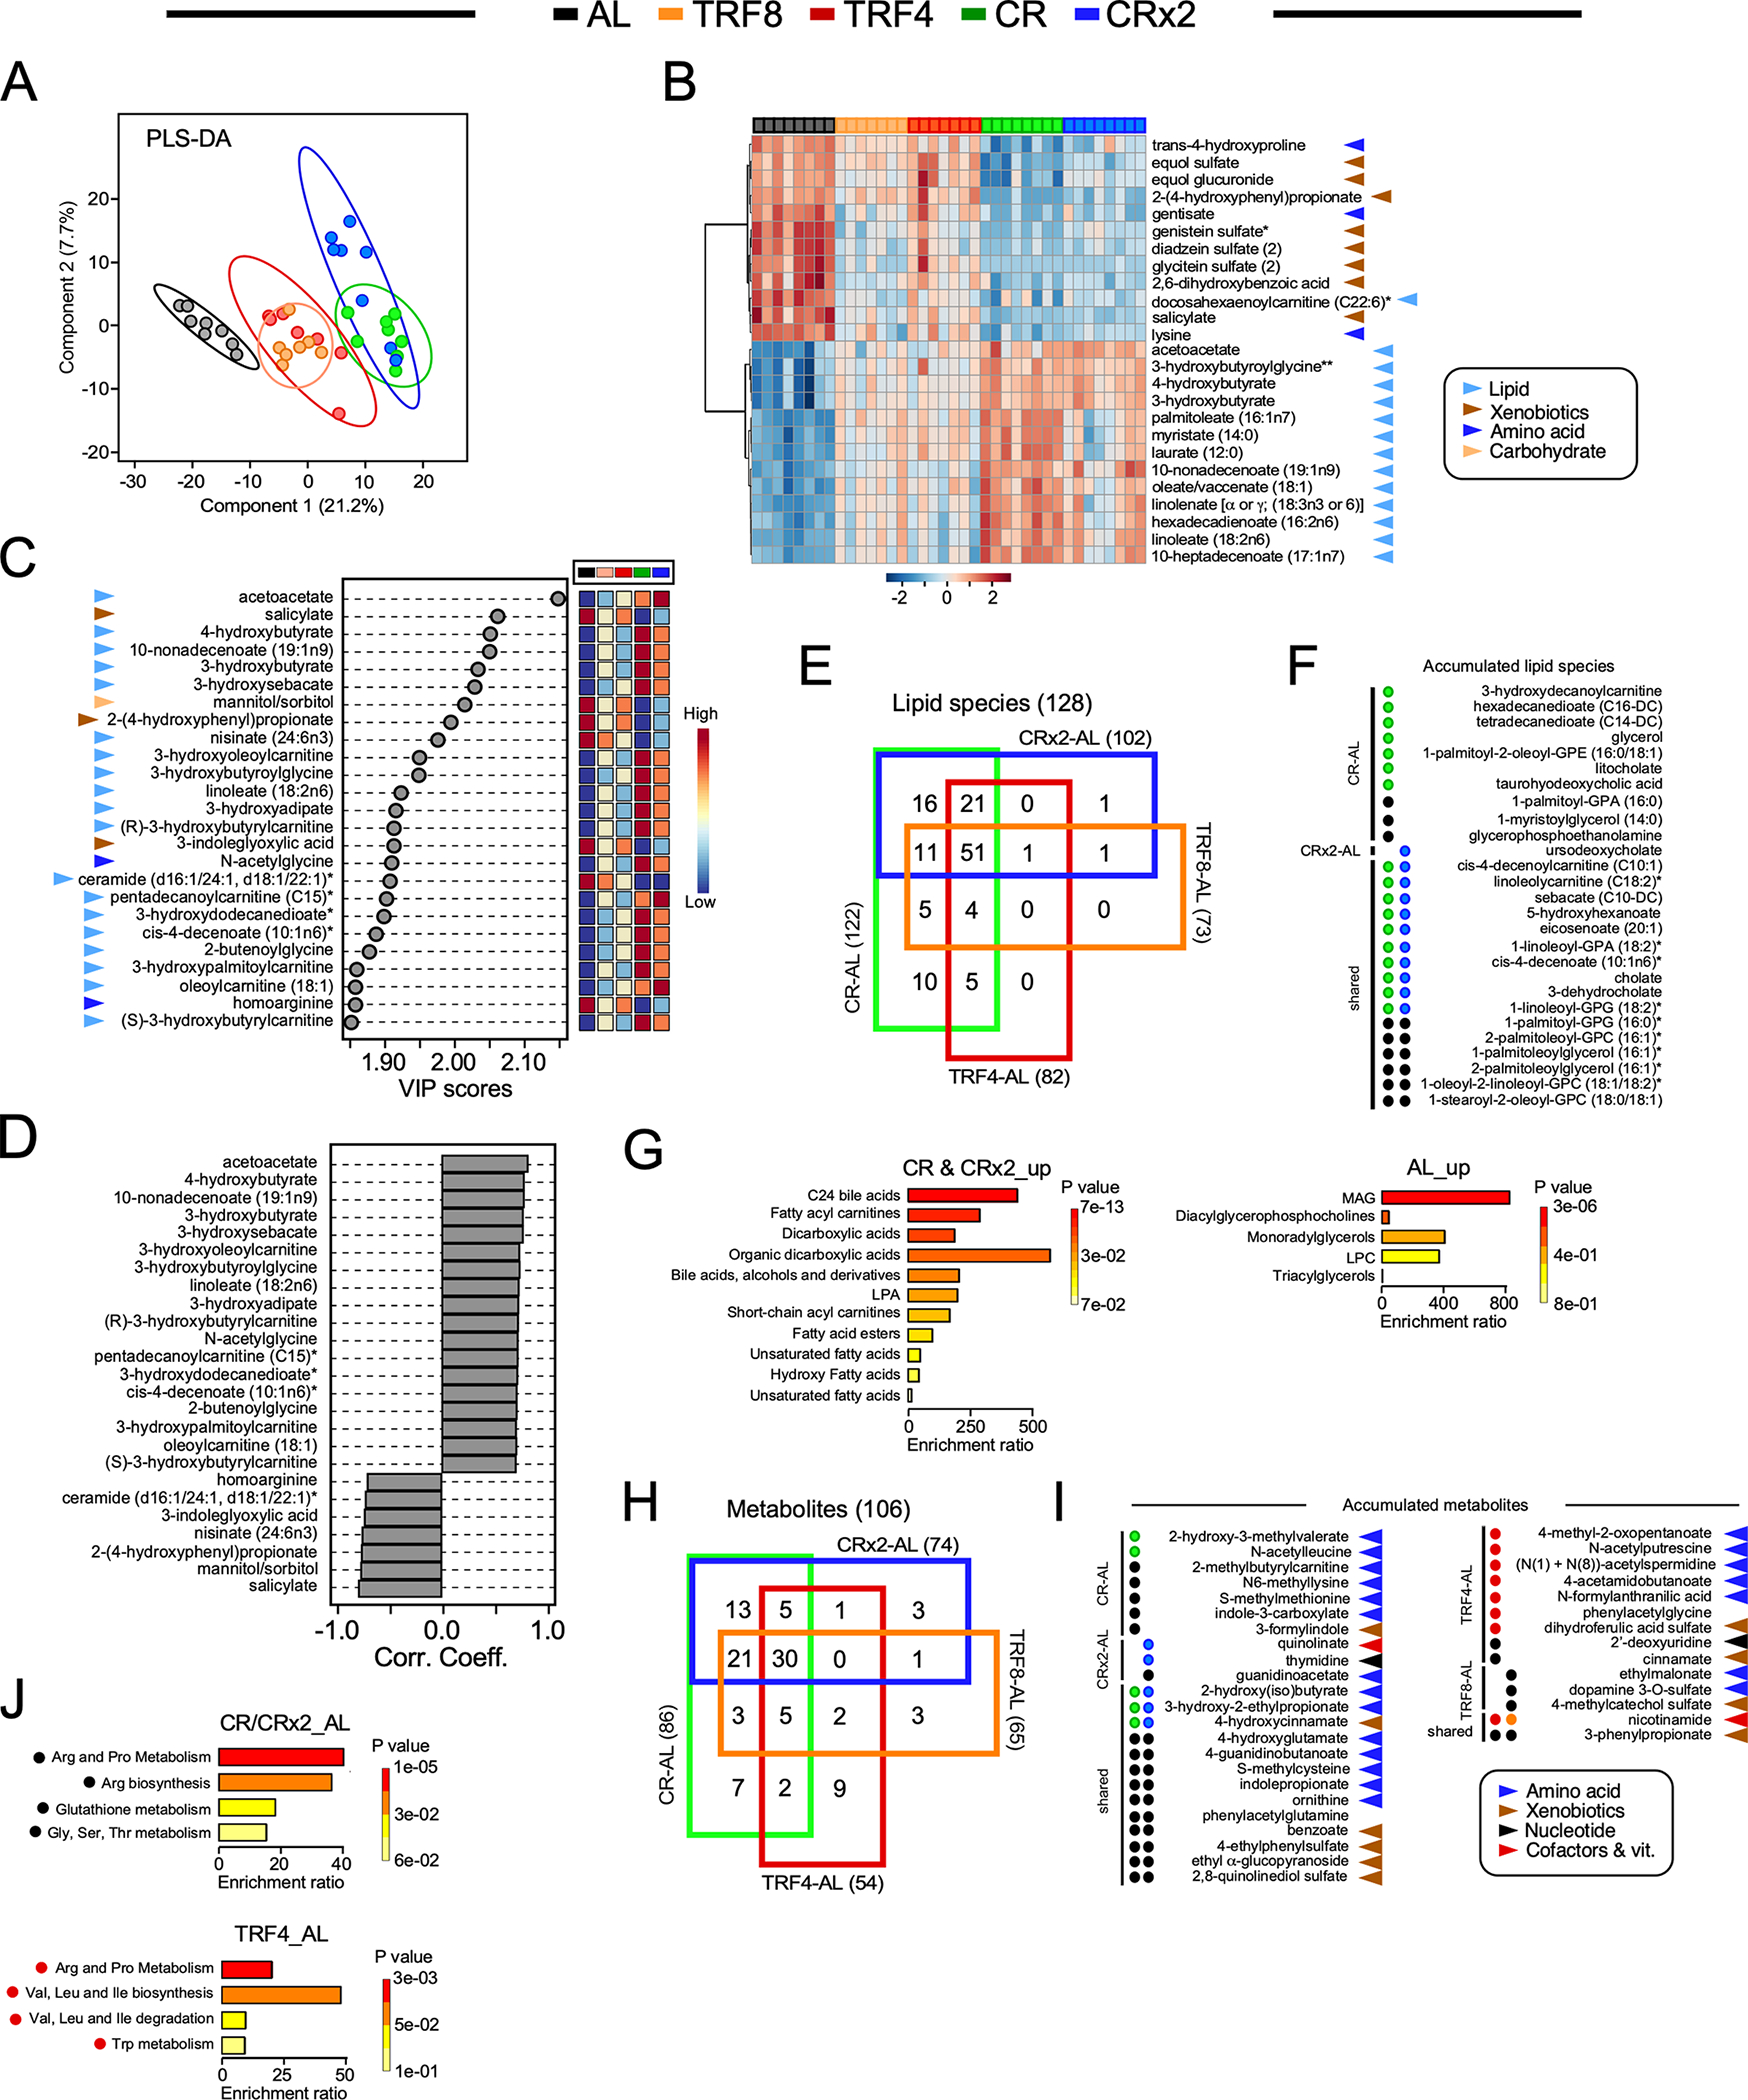
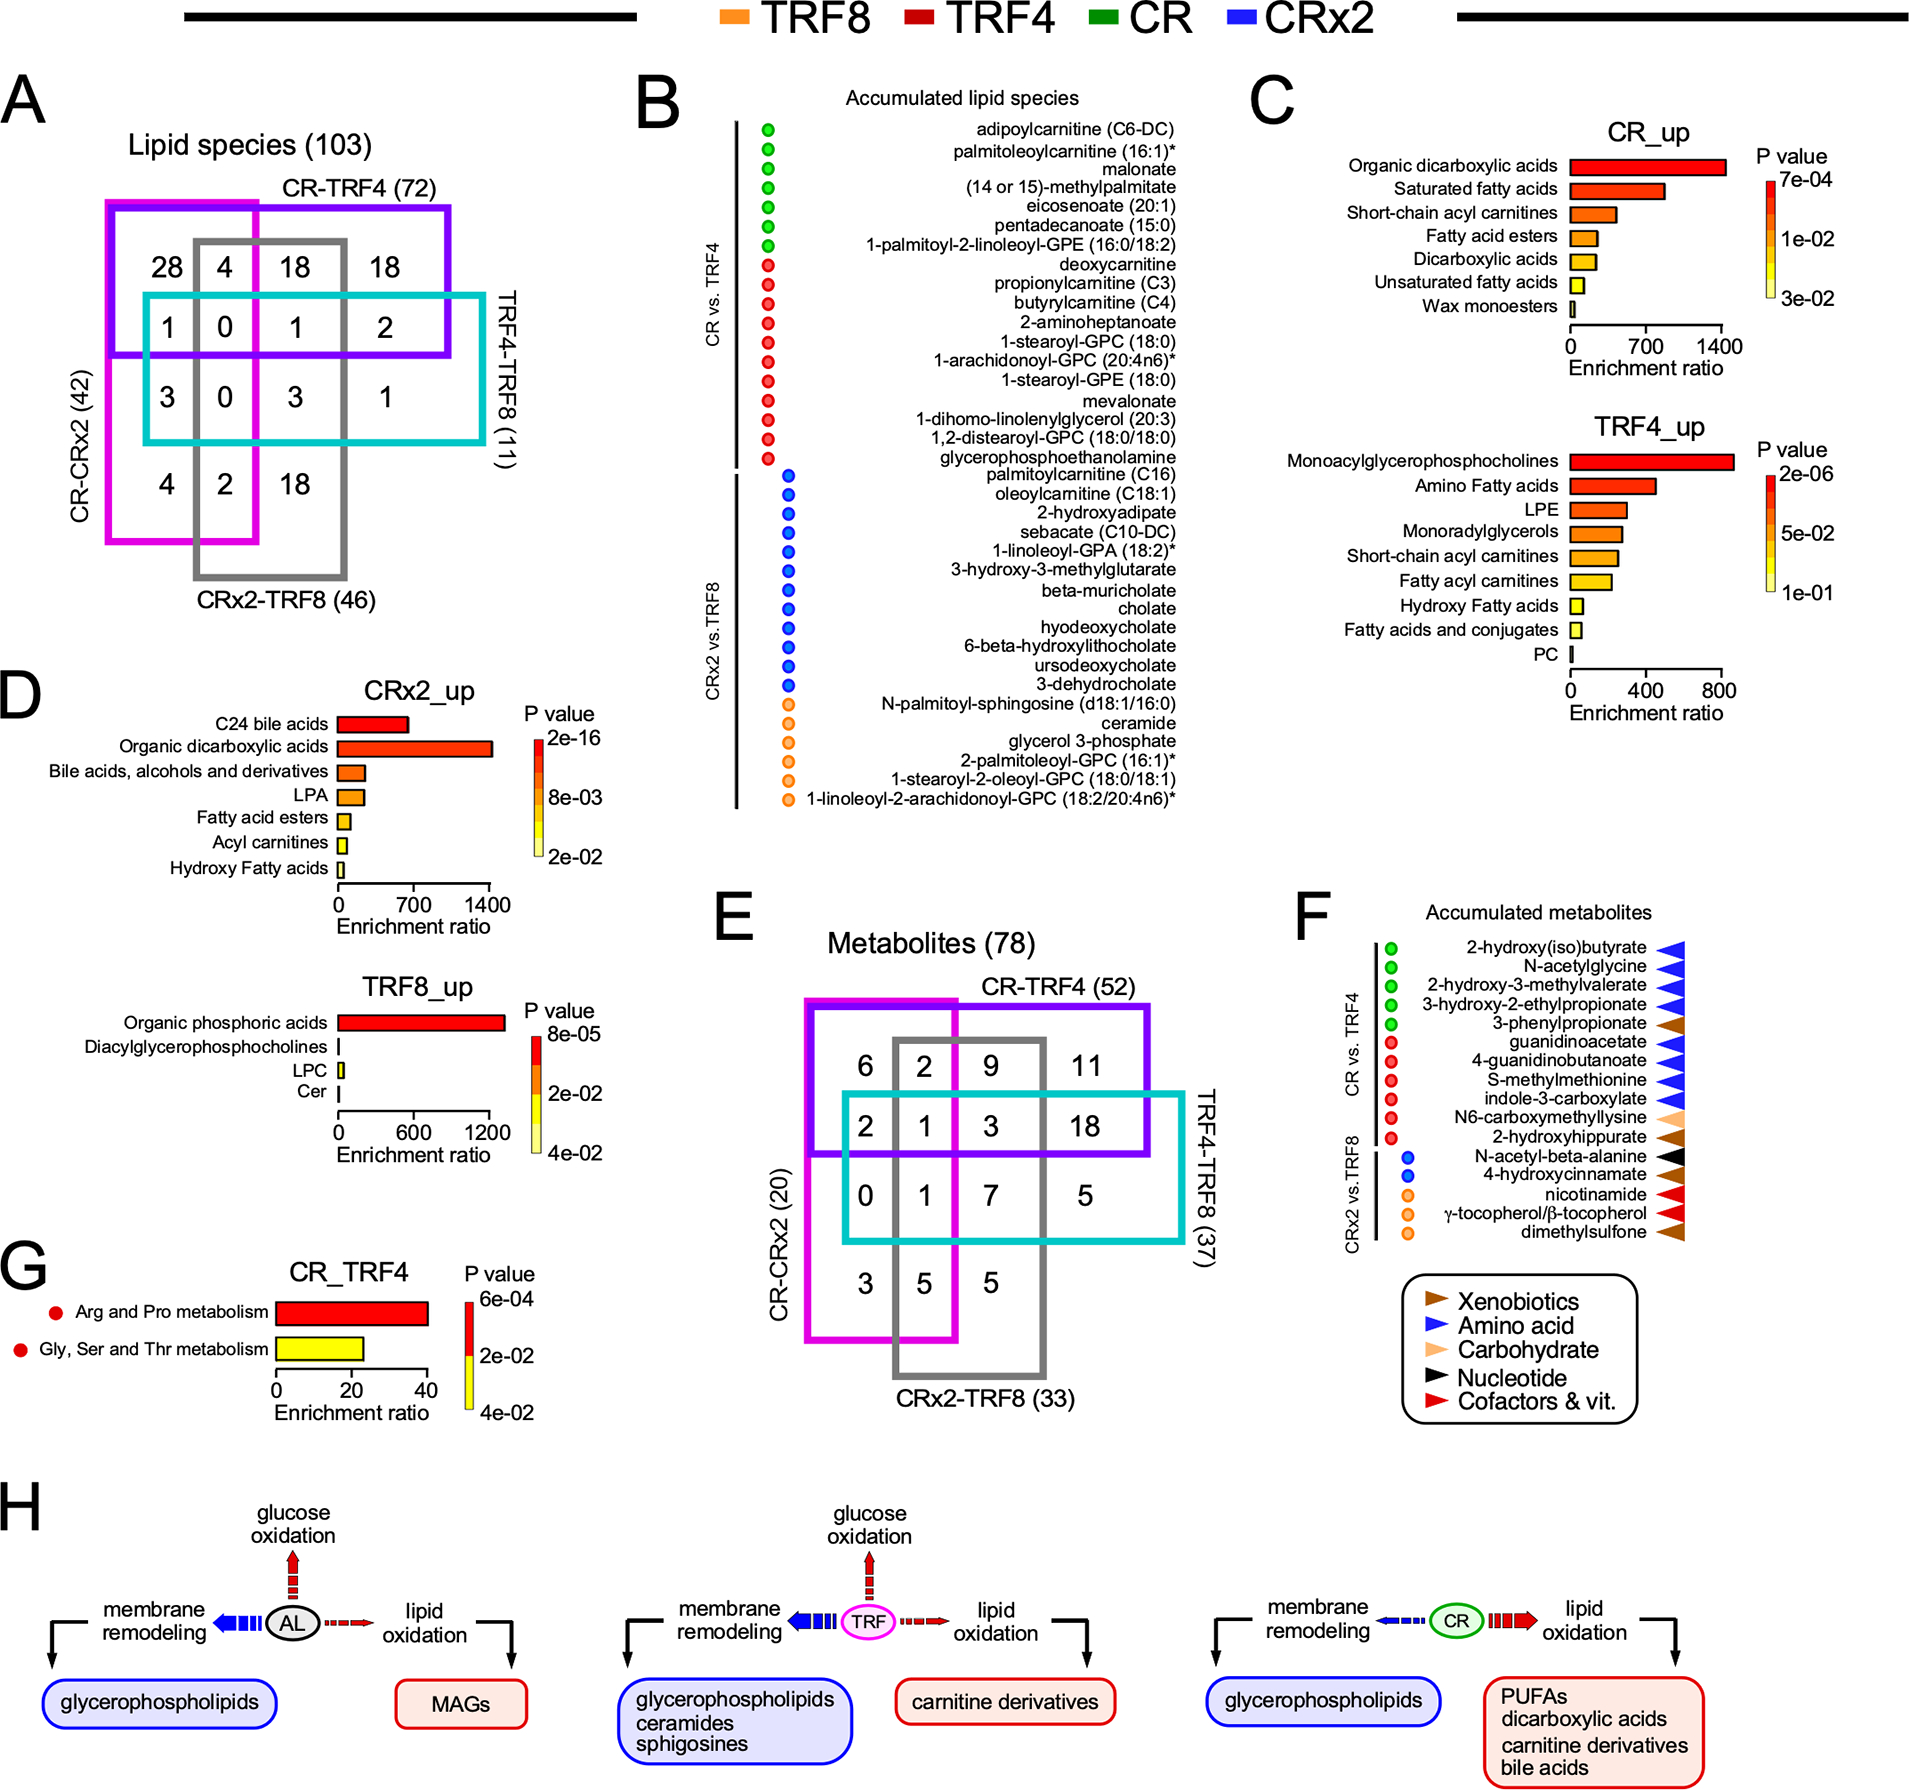
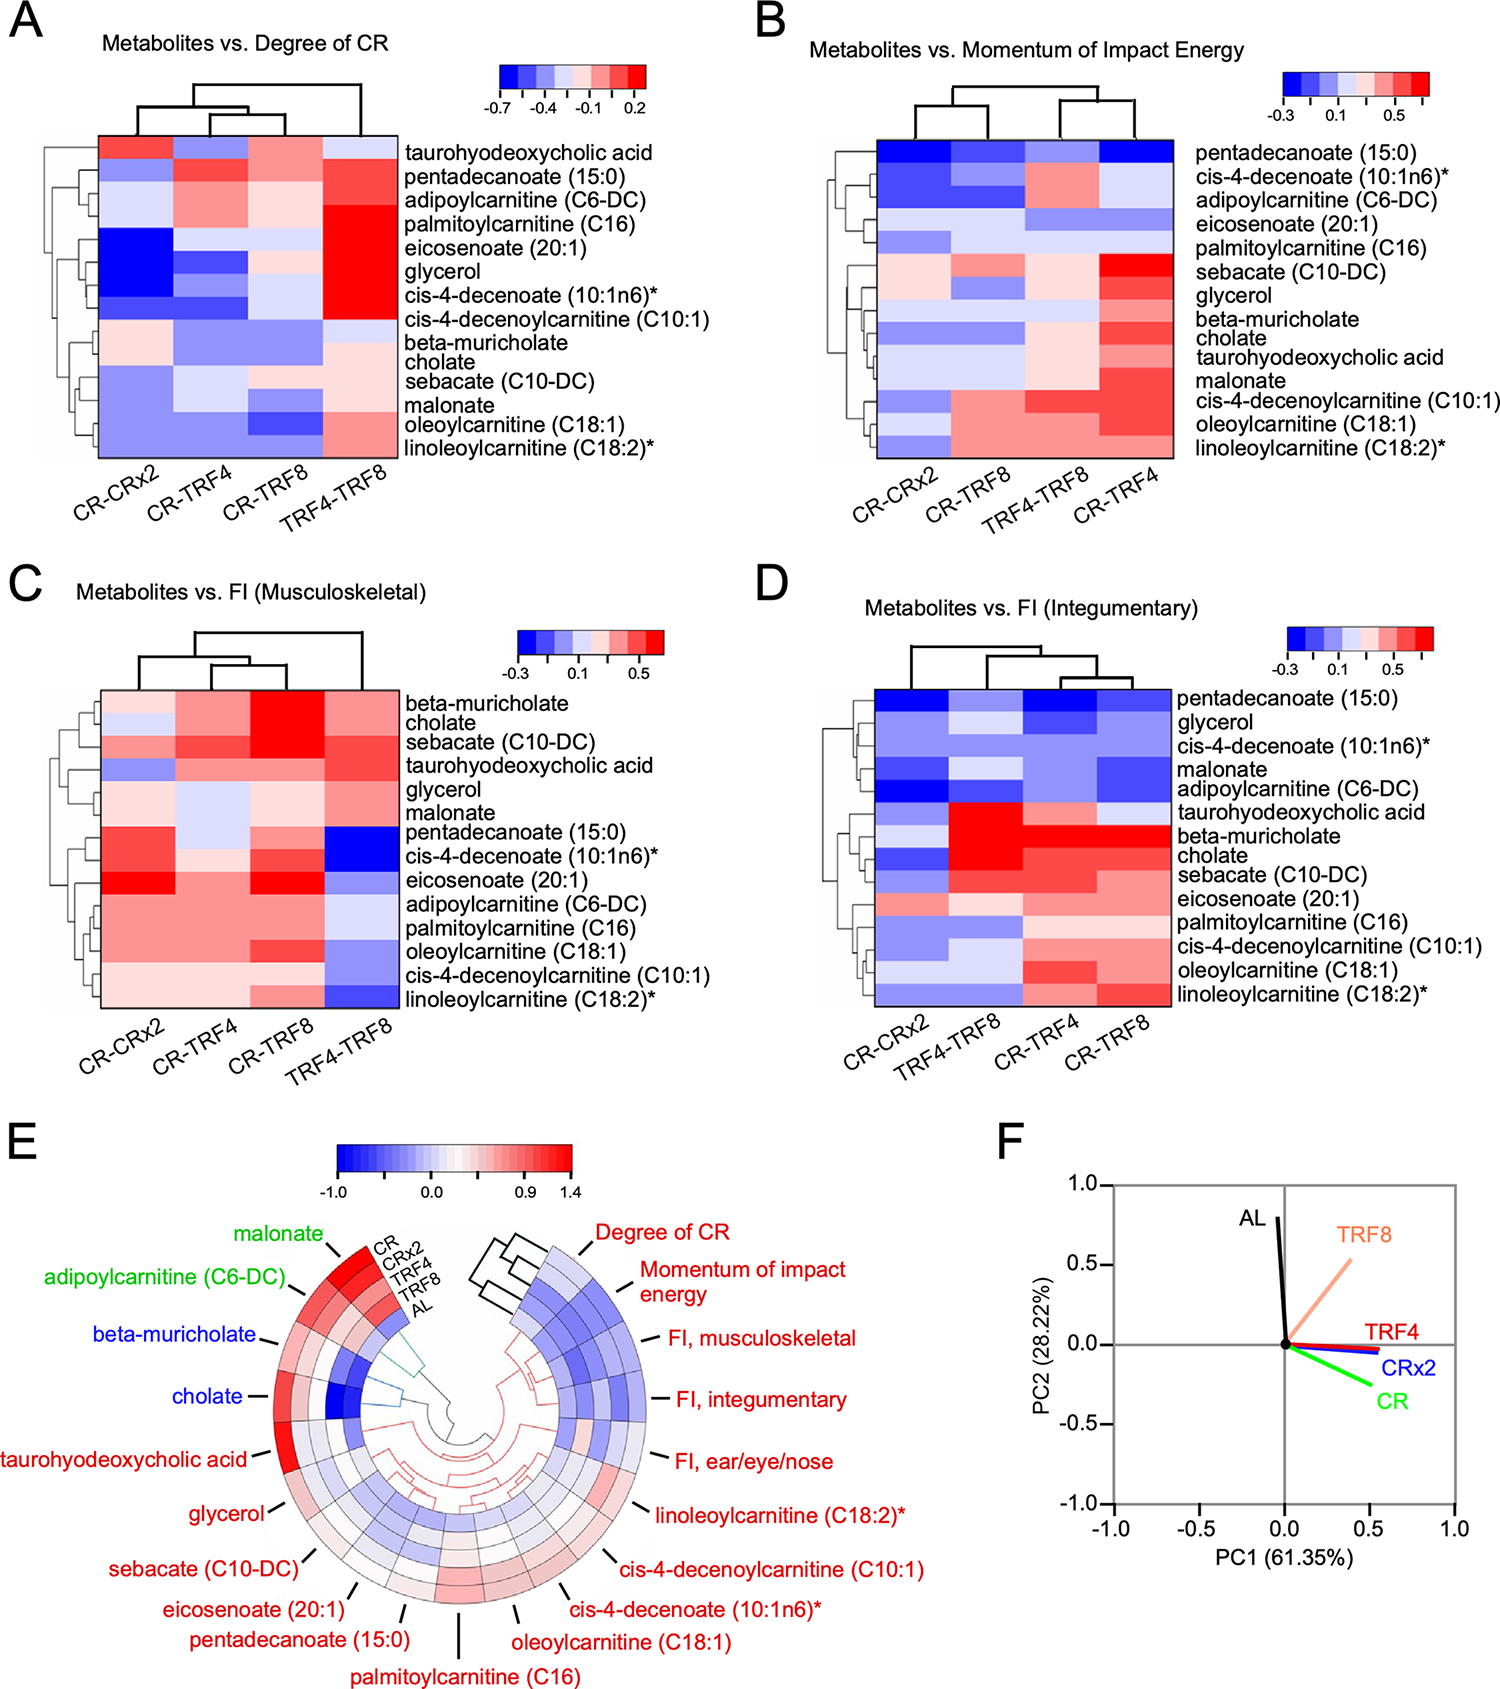
Emerging new evidence highlights the importance of prolonged daily fasting periods for the health and survival benefits of calorie restriction (CR) and time-restricted feeding (TRF) in male mice; however, little is known about the impact of these feeding regimens in females. We placed 14-month-old female mice on five different dietary regimens, either CR or TRF with different feeding windows, and determined the effects of these regimens on physiological responses, progression of neoplasms and inflammatory diseases, serum metabolite levels, and lifespan. Compared with TRF feeding, CR elicited a robust systemic response, as it relates to energetics and healthspan metrics, a unique serum metabolomics signature in overnight fasted animals, and was associated with an increase in lifespan. These results indicate that daytime (rest-phase) feeding with prolonged fasting periods initiated late in life confer greater benefits when combined with imposed lower energy intake.

Keywords: aging phenotypes; calorie restriction; circadian misalignment; fasting; female mice; histopathology; metabolomics; time-restricted feeding.


Conflict of interest statement

Declaration of interests The authors declare no competing interests.

Figures

Figure 1.
Figure 1.. Effect of late onset feeding regime on markers of health in female C57BL/6J mice.
(A) Timetable for the measure of the indicated physiological parameters. (B) Trajectories of food consumption (top panel) and percent change in body weight (bottom panel) over the course of 80 weeks under the indicated feeding regimens. Data are expressed as means +/− 95% confidence intervals (CI). Gray box indicates a volitional increase in food consumption (25–45 weeks after diet switching) by mice fed AL, TRF4 and TRF8. (C) Degree of calorie restriction (referred as percent reduction in energy intake vs. AL feeding) over the course of 80 weeks after diet switching. Black arrows denote measurements of energy metabolism from indirect calorimetry. See Figure 2 for additional details. (D) Percentage of whole-body fat mass (upper panel) and lean-to-fat ratio calculation (bottom panel) as assessed by low-field nuclear magnetic resonance imaging. Data distribution is visualized as violin plots with a marker for the median. (E) Fasting blood glucose (FBG) levels at baseline and 26 weeks after diet switching. Mice were fasted for 6 h. n=6 per group. (F) Trajectories of blood glucose clearance during an oral glucose tolerance test (OGTT), with values represented as means +/− SD. n=6 per group. (G) Area under the curve (AUC) from the OGTT experiment. (H) Momentum of impact energy derived from the inverted cage top experiment. (I, J) Overall frailty index score (I) and domain-specific frailty scores (J) were recorded. n=11–16 per group. (F, H-J) Data are represented as box and whisker plots, depicting minimum, lower quartile (Q1), median (Q2), upper quartile (Q3) and maximum values. Data have been analyzed using either two-way ANOVA coupled with Sidak’s post-hoc test (D) or one-way ANOVA with Dunnett’s post-hoc test (E,G-J) (see Table S1). *, **, ***, ****, p < 0.05, 0.01, 0.001, and 0.0001. Different lowercase letters indicate significant differences at p < 0.01 (panel I).
Figure 2.
Figure 2.. Impact of late onset feeding regimens on in vivo metabolic function in female mice.
Mice exposed to the indicated feeding regimen for 17 and 69 weeks were placed into metabolic cages for 72 h to measure VO2, VCO2, respiratory exchange ratio (RER), energy expenditure (EE), and locomotor activity. The values associated with the first 12 h acclimatization phase (L1) were discarded. n=6 per group. (A) Change in body weight as mice entered and left the metabolic cage. The lack of change in body weight is indicated by the dashed line. (B) Daily food consumption while in metabolic cages. (C) Food efficiency was calculated as the ratio between body weight changes and the net energy intake (kCal) while mice were in the metabolic cage. The lack of change in body weight yields a food efficiency of ‘0’ as indicated by the dashed line. (D) Averaged hourly RER trajectories were captured during 3 dark and 2 light cycles in mice exposed to the indicated feeding regimens for 17 weeks (left panels) and 69 weeks (right panels). Arrows indicate feeding time (8:30 AM for all groups and 4:30 PM for CRx2 only). (E) Averaged hourly RER trajectories of CR (green symbols) and CRx2 (blue symbols) mice under light and dark phases. Arrow, feeding time at 8:30 AM. (A-C) Data are represented as box and whisker plots, depicting minimum, lower quartile (Q1), median (Q2), upper quartile (Q3) and maximum values. One-way ANOVA coupled with Dunnett’s post-hoc test was performed. **, *** and ****, p < 0.01, 0.001 and 0.0001.
Figure 3.
Figure 3.. Survival analysis and histopathological grading of the most prevalent lung diseases at necropsy.
(A) Kaplan-Meier survival curves. Mice that died before the median lifespan of their feeding cohort were labeled as short-lived and those that died after were identified as long-lived. Related to Figure S3A and Table S2. (B, C) Whole-slide image histopathological analysis depicting the averaged disease burden score in 4 tissues (lungs, kidneys, heart, and liver) (B) and in the heart or liver (C). Two-way ANOVA coupled with Sidak’s post-hoc test was performed to assess the effect of feeding regime, survival (short- vs. long-lived) and their interaction (See Table S1). Data are represented as box and whisker plots, depicting minimum, lower quartile (Q1), median (Q2), upper quartile (Q3) and maximum values. *, p < 0.05. Different letters indicate statistical significance with p < 0.05. Related to Figure S3E. (D) Representative images of normal lungs (i), lungs with eosinophilic crystalline pneumonia (ECP, ii) and lungs with lympho-reticular neoplasm (LRN, iii). Severity grading of LRN occurring together with ECP under different feeding regimens (iv). The severity of ECP surrounding LRN was significantly higher in AL-fed mice (v) compared to CR mice (vi). Hematoxylin & Eosin staining, scale bar 200 μm, inset 50 μm.
Figure 4.
Figure 4.. Untargeted metabolomics revealed unique signature of CR from serum of female mice after 26 weeks of diet switching.
(A) Partial Least Square Determinant Analysis (PLS-DA) represented as 2D plots. The ellipses correspond to 95% confidence intervals for a normal distribution. AL, n=8; TRF8, n=7; TRF4, n=7; CR, n=8; CRx2, n=8. (B) Heatmap depicting normalized values of the top 25 features identified by one-way ANOVA and post-hoc test analysis in each animal. The direction (positive or negative) and strength (color intensity) of expression are coded red and blue, respectively, and normalized between 2 and −2 according to the scale bar on the bottom. (C) Variable importance in projection (VIP) scores of the top 25 serum metabolites responsible for feeding regimen-dependent metabolic differences. The colored boxes on the right indicate the relative concentrations of the corresponding metabolite in each group under study. (D) Correlation coefficients of the top 25 serum molecules that correlated positively and negatively regardless of the feeding regimen. (E) 4-way Venn diagram of the 128 lipid species with HMDB identifiers that were significantly impacted by the indicated pairwise comparisons. (F) Significant accumulation of serum lipid species restricted to CR (green circles, n=7/10) vs. AL (black circles, 3/10) and CRx2 (blue circle, n=1/1) vs. AL (0/1), or; shared by CR and CRx2 regimens (n=10/16) vs. AL (n=6/16). There was no accumulation of lipid species restricted to TRF4-AL, TRF8-AL, or shared by both TRF regimens vs. AL. (G) Enrichment analysis of the 18 lipid species accumulated in response to the two CR regimens vs. AL (left panel) and the 9 lipid molecules selectively elevated with AL (right panel). See the list in (F). (H) 4-way Venn diagrams of the 106 serum metabolites with HMDB identifiers in the indicated pairwise comparisons.

(I) Significant accumulation of serum metabolites restricted to CR (n=2/7) vs. AL (5/7); CRx2 (n=2/3) vs. AL (1/3); shared by CR & CRx2 (n=3/13) vs. AL (n=10/13); TRF4 (red circles, n=7/9) vs. AL (n=2/9); TRF8 (orange circles, n=0/3) vs. AL (n=3/3); and shared by TRF4 & TRF8 (n=1/2) vs. AL (n=1/2).

(J) Enrichment analysis of the 16 metabolites depleted in the CR-AL and CRx2-AL pairwise comparisons (top panel) and of the 7 compounds accumulated with TRF4 vs. AL (bottom panel). See the list in (I). Table S4 provides the complete list of chemical compounds and p-value (−log10) used to generate panels F and I. (B, C, I) Arrowheads indicate the metabolic super-pathway each metabolic species belongs to: Lipids, light blue; xenobiotics, brown; amino acid, dark blue; carbohydrate, light orange; nucleotide, black; cofactors & vitamins, red.
Figure 5.
Figure 5.. Identification of unique metabolomics signature in response to the feeding regimen.
(A) 4-way Venn diagram of the 103 lipid species with HMDB identifiers that were significantly impacted in the indicated pairwise comparisons. (B) Significant accumulation of serum lipid species restricted to CR (green circles, n=7/18) vs. TRF4 (red circles, 11/18), and CRx2 (blue circles, n=12/18) vs. TRF8 (orange circles, n=6/18). (C) Enrichment analysis of the lipid species accumulated in response to CR (top panel) vs. TRF4 (bottom panel). See the list in (B). (D) Enrichment analysis of the lipid species accumulated in response to CRx2 (top panel) vs. TRF8 (bottom panel). See the list in (B). (E) 4-way Venn diagrams of the 78 serum metabolites with HMDB identifiers that were significantly impacted in the indicated pairwise comparisons. (F) Significant accumulation of serum metabolites found only in CR (n=5/11) vs. TRF4 (6/11), and CRx2 (n=2/5) vs. TRF8 (3/5). (G) Enrichment analysis of metabolites depleted in CR vs. TRF4. See the list in (F). (H) Diagram depicting broadly the different lipid metabolic signatures in serum of mice fed AL, TRF and CR. Table S4 provides the complete list of chemical compounds and p-value (−log10) used to generate panels B and F.
Figure 6.
Figure 6.. Integrated interpretation of various data sets that includes functional signatures of physiological and metabolic outcomes.
(A-D) Heatmaps of hierarchically clustered correlation coefficients of significantly changed 14 metabolites vs degree of CR (i.e., energy intake, Fig. 1C) (A); momentum impact energy [kg * m/sec] (B); and frailty index (FI) components such as musculoskeletal (C) and integumentary (D), within each group of nutritional interventions. Correlation patterns were determined from Pearson correlation coefficients, r (p<0.05), for each of the serum 14 metabolites vs. each physiological metric displayed in panels A-D. The type (positive or negative) and strength (color intensity) of correlation are coded brown and blue, respectively, according to the bar on the top, right of each heatmap. (E) Polar heatmap depicting hierarchical clustering with circular dendrogram. The pseudocolor scale in the bar on top of the panel denotes low (blue) and high (red) values with respect to the average of each column’s values. (F) Principal component analysis (PCA) of z-score normalized physiological and serum metabolomics data based on average values from the 5 experimental groups. In the PCA plot displayed are the eigenvectors of the correlation matrix. Physiological functional outcomes and serum metabolome signatures reflect the impact of nutritional interventions and their type as the major and second principal components, respectively, of groups’ separation. Related to Figure S5.

Comment in

References

    1. Mitchell SJ, Bernier M, Mattison JA, Aon MA, Kaiser TA, Anson RM, Ikeno Y, Anderson RM, Ingram DK, and de Cabo R (2019). Daily Fasting Improves Health and Survival in Male Mice Independent of Diet Composition and Calories. Cell Metab. 29, 221–228.e3. 10.1016/j.cmet.2018.08.011. - DOI - PMC - PubMed
    1. Pomatto-Watson LCD, Bodogai M, Bosompra O, Kato J, Wong S, Carpenter M, Duregon E, Chowdhury D, Krishna P, Ng S, et al. (2021). Daily caloric restriction limits tumor growth more effectively than caloric cycling regardless of dietary composition. Nat. Commun. 12, 6201. 10.1038/s41467-021-26431-4. - DOI - PMC - PubMed
    1. Green CL, Lamming DW, and Fontana L (2022). Molecular mechanisms of dietary restriction promoting health and longevity. Nat. Rev. Mol. Cell. Biol. 23, 56–73. 10.1038/s41580-021-00411-4. - DOI - PMC - PubMed
    1. de Cabo R, and Mattson MP (2019). Effects of Intermittent Fasting on Health, Aging, and Disease. N Engl J Med. 381, 2541–2551. Erratum in: N Engl J Med. (2020). 382, 298 and 978. 10.1056/NEJMra1905136. - DOI - PubMed
    1. Longo VD, Di Tano M, Mattson MP, and Guidi N (2021). Intermittent and periodic fasting, longevity, and disease. Nat Aging 1, 47–59. 10.1038/s43587-020-00013-3. - DOI - PMC - PubMed

Publication types

LinkOut - more resources