. 2023 Sep 11;58(17):1534-1547.e6.
doi: 10.1016/j.devcel.2023.06.005. Epub 2023 Jul 11.

The secreted neuronal signal Spock1 promotes blood-brain barrier development

Affiliations

The secreted neuronal signal Spock1 promotes blood-brain barrier development

Natasha M O'Brown et al. Dev Cell. .

Abstract

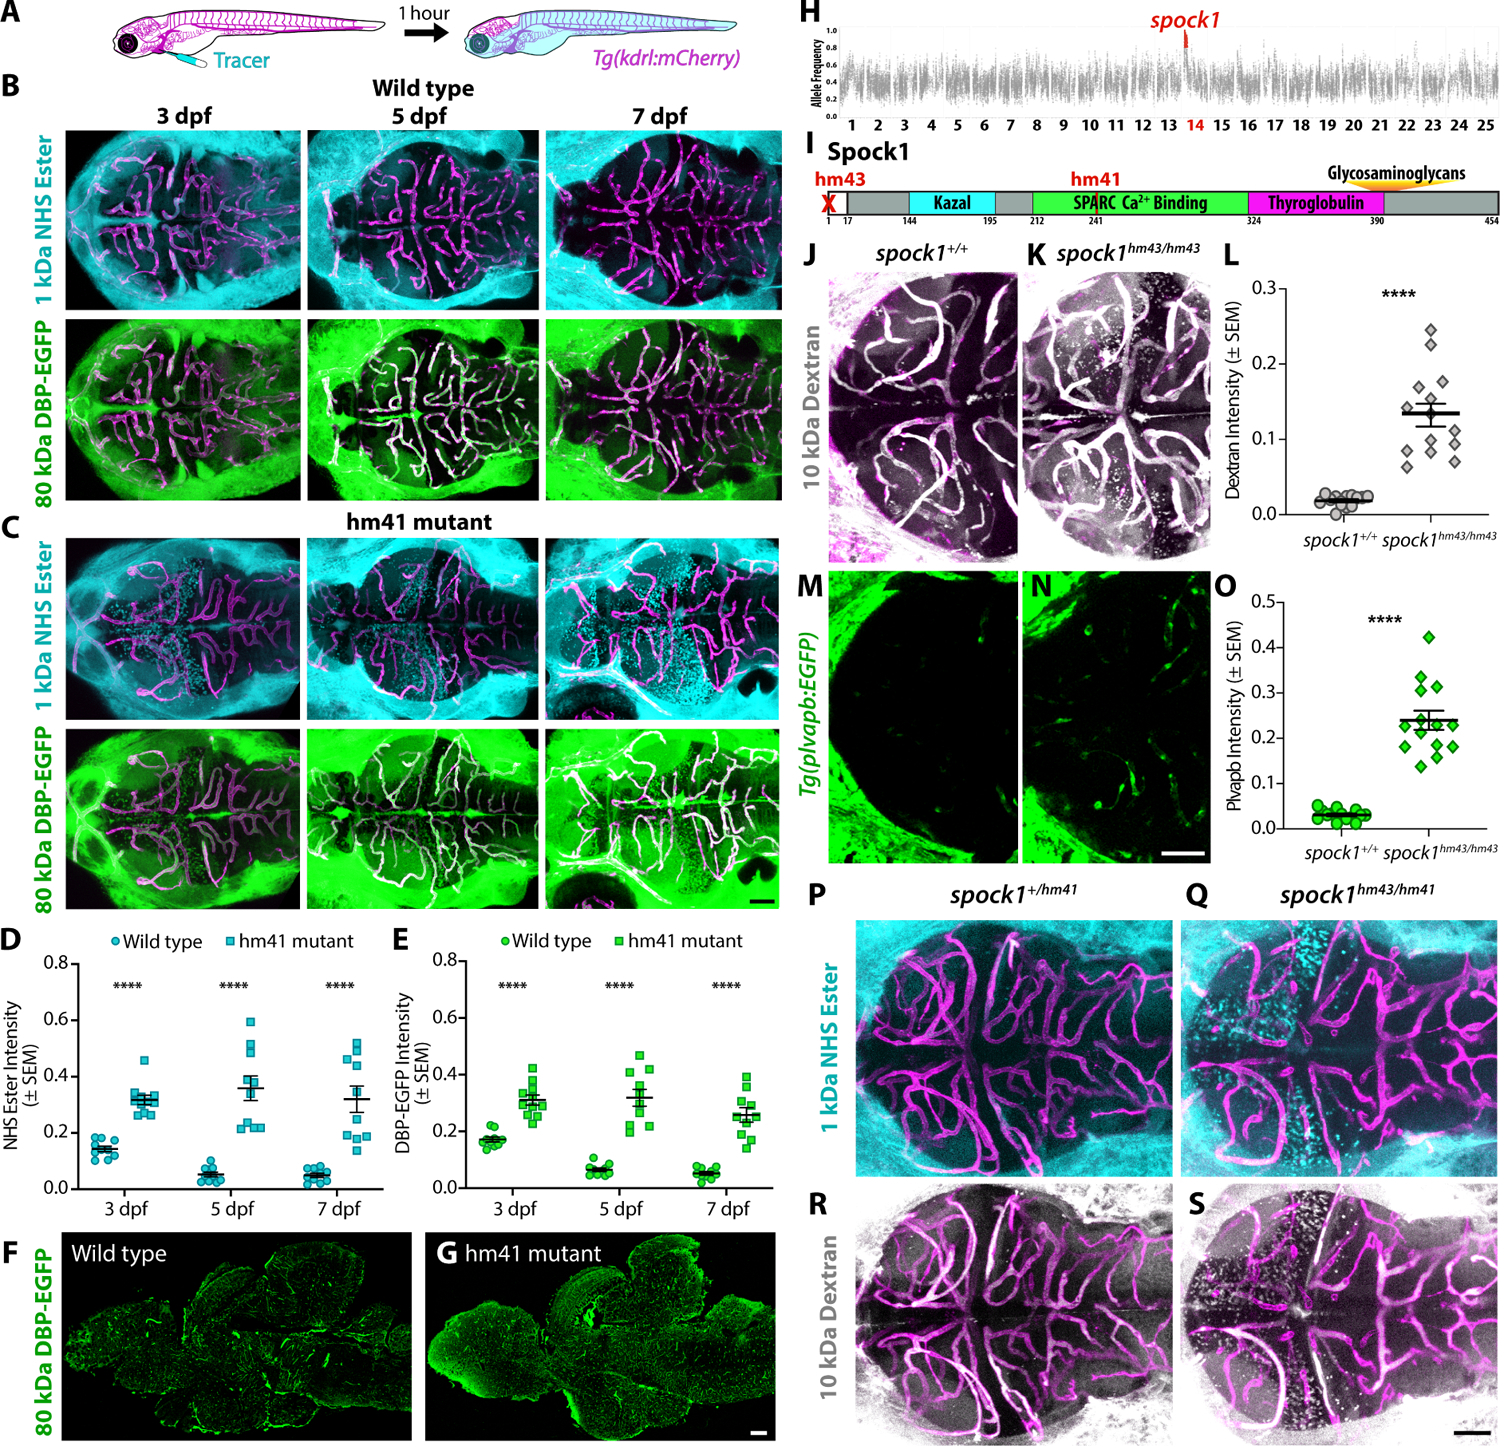
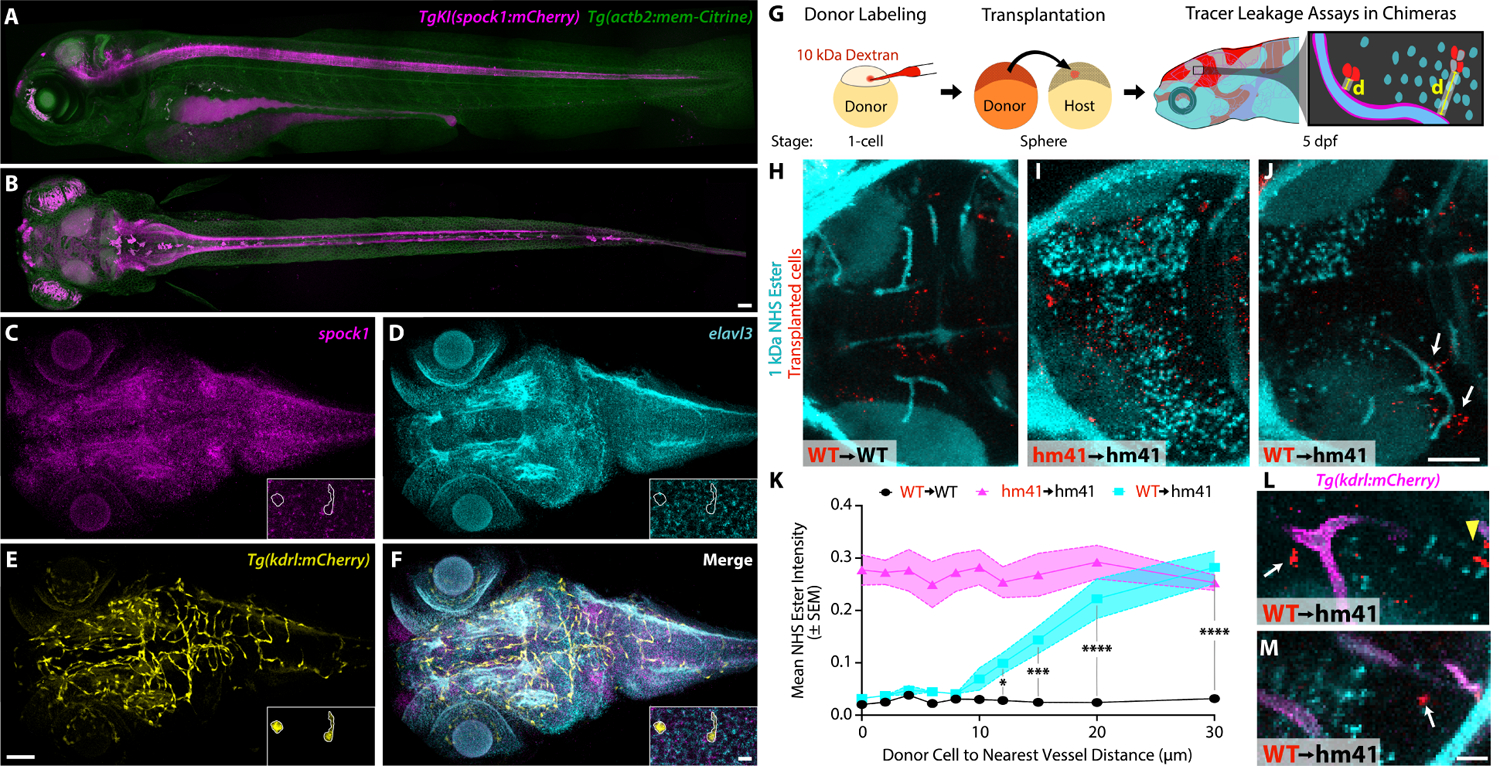
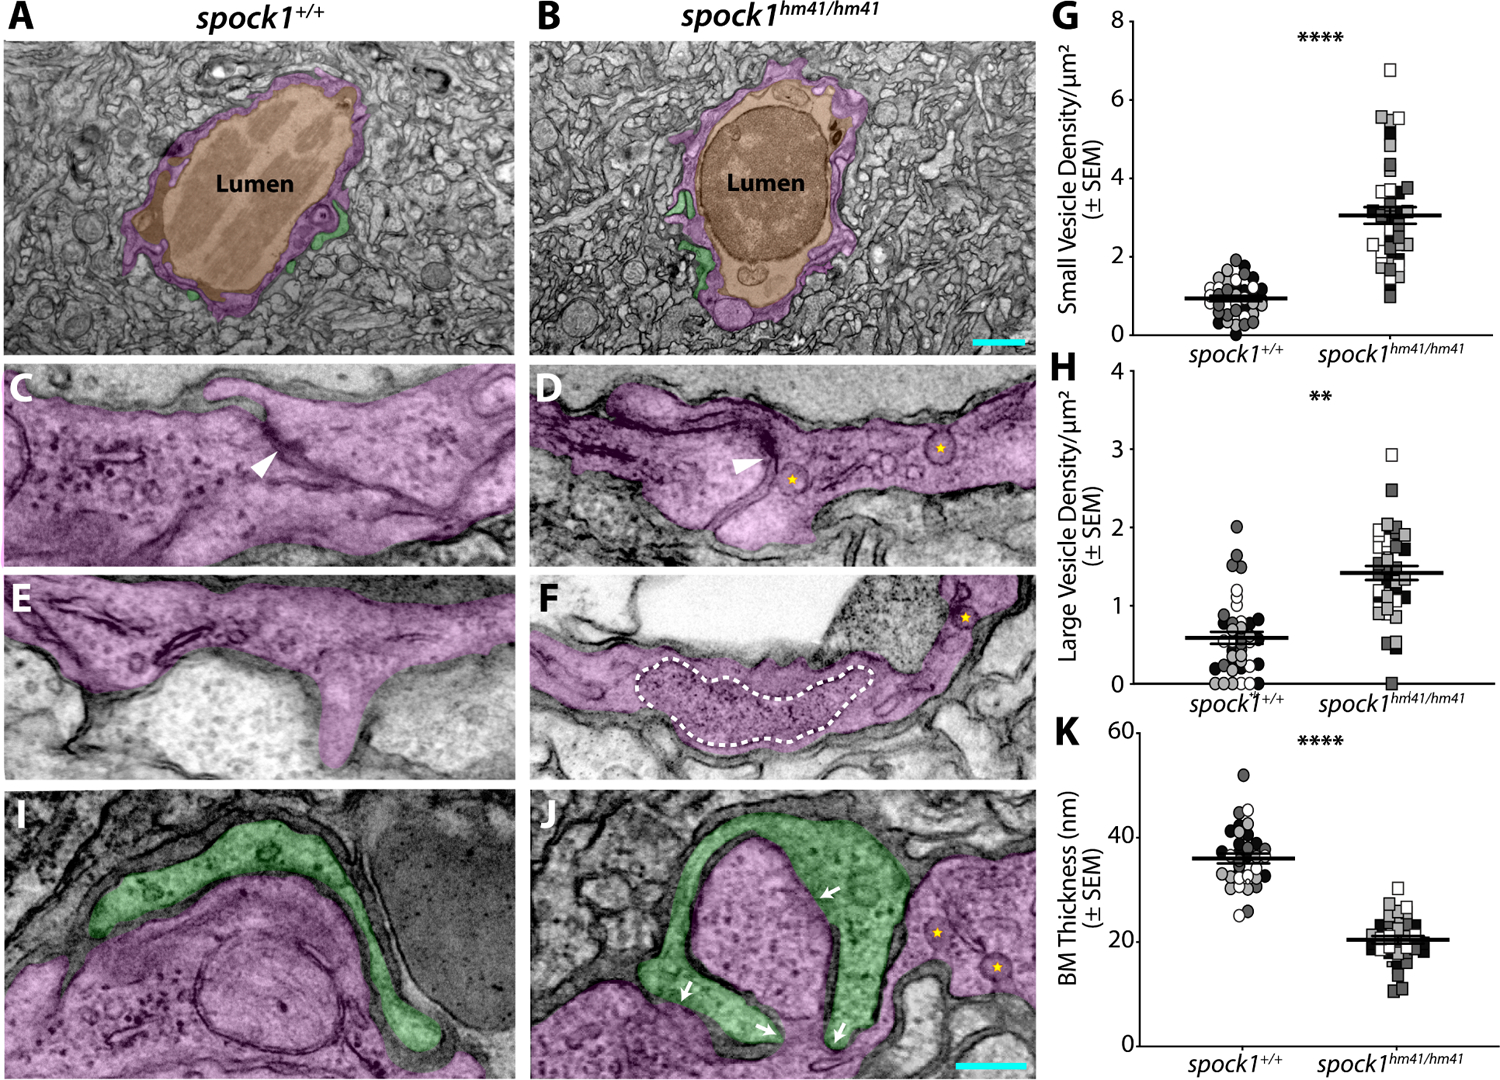
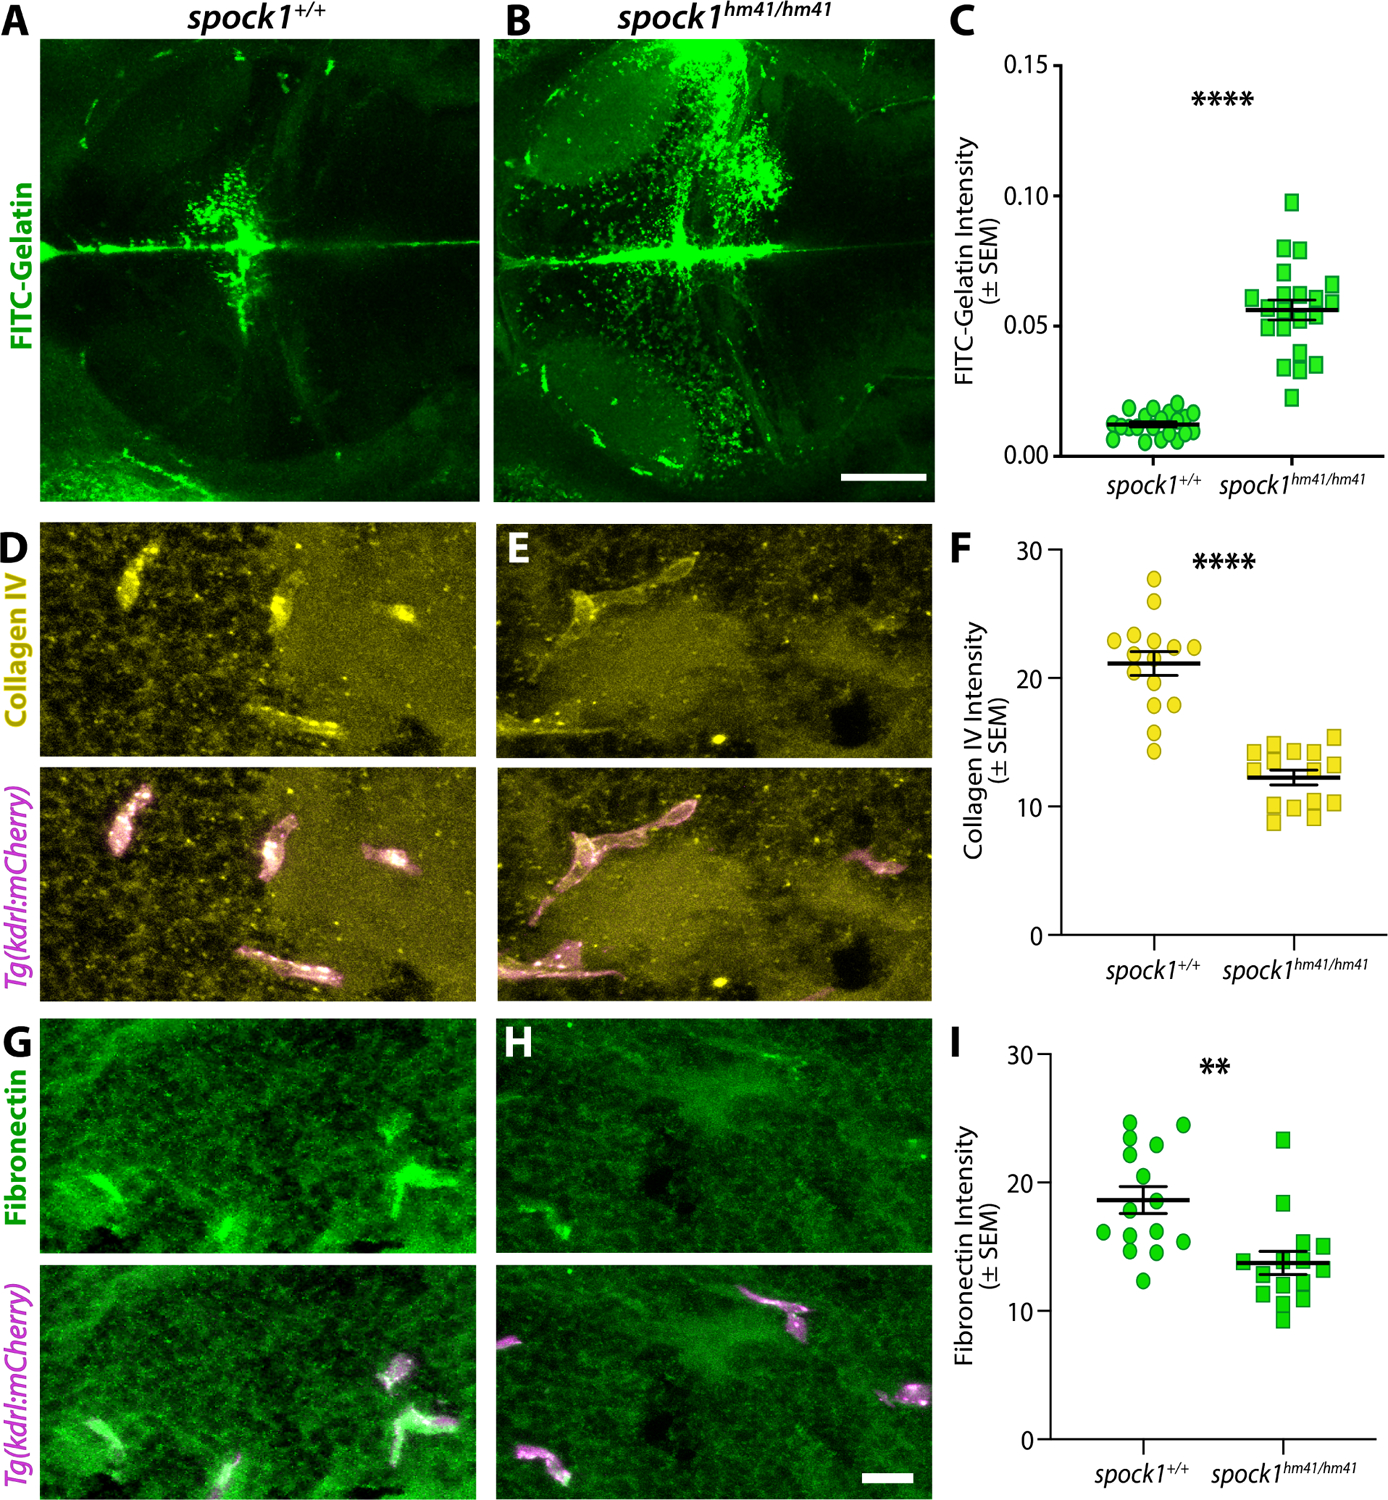
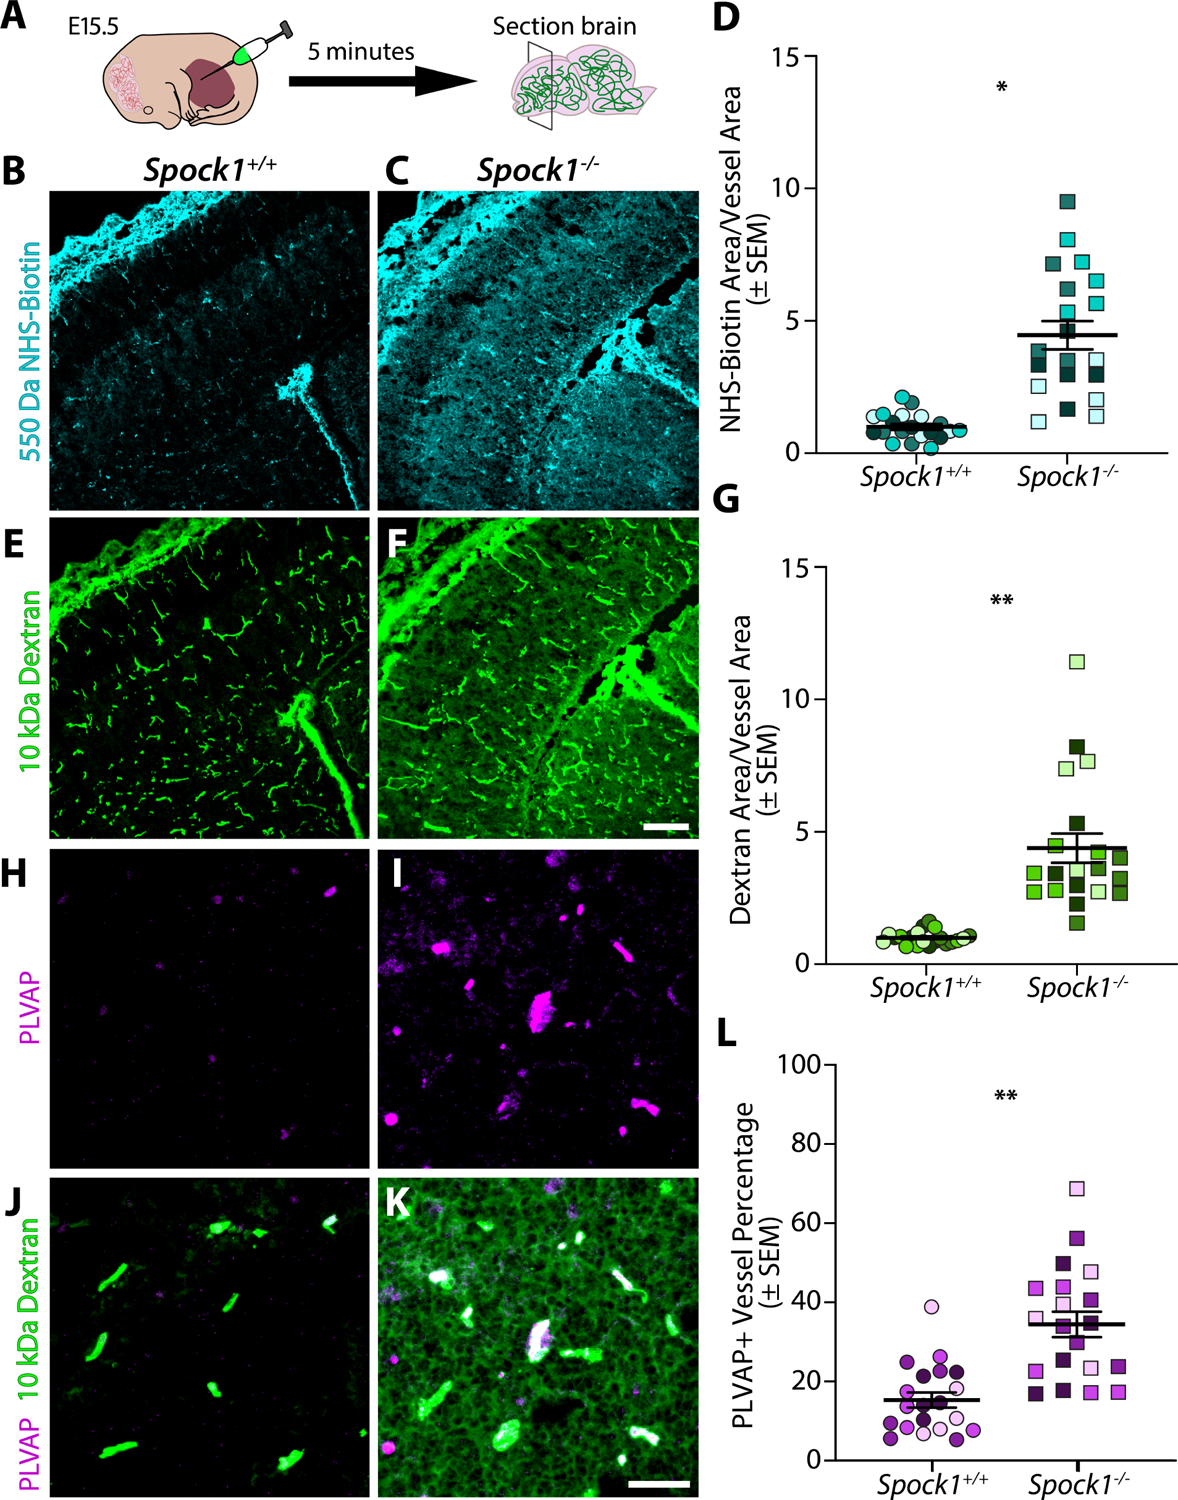
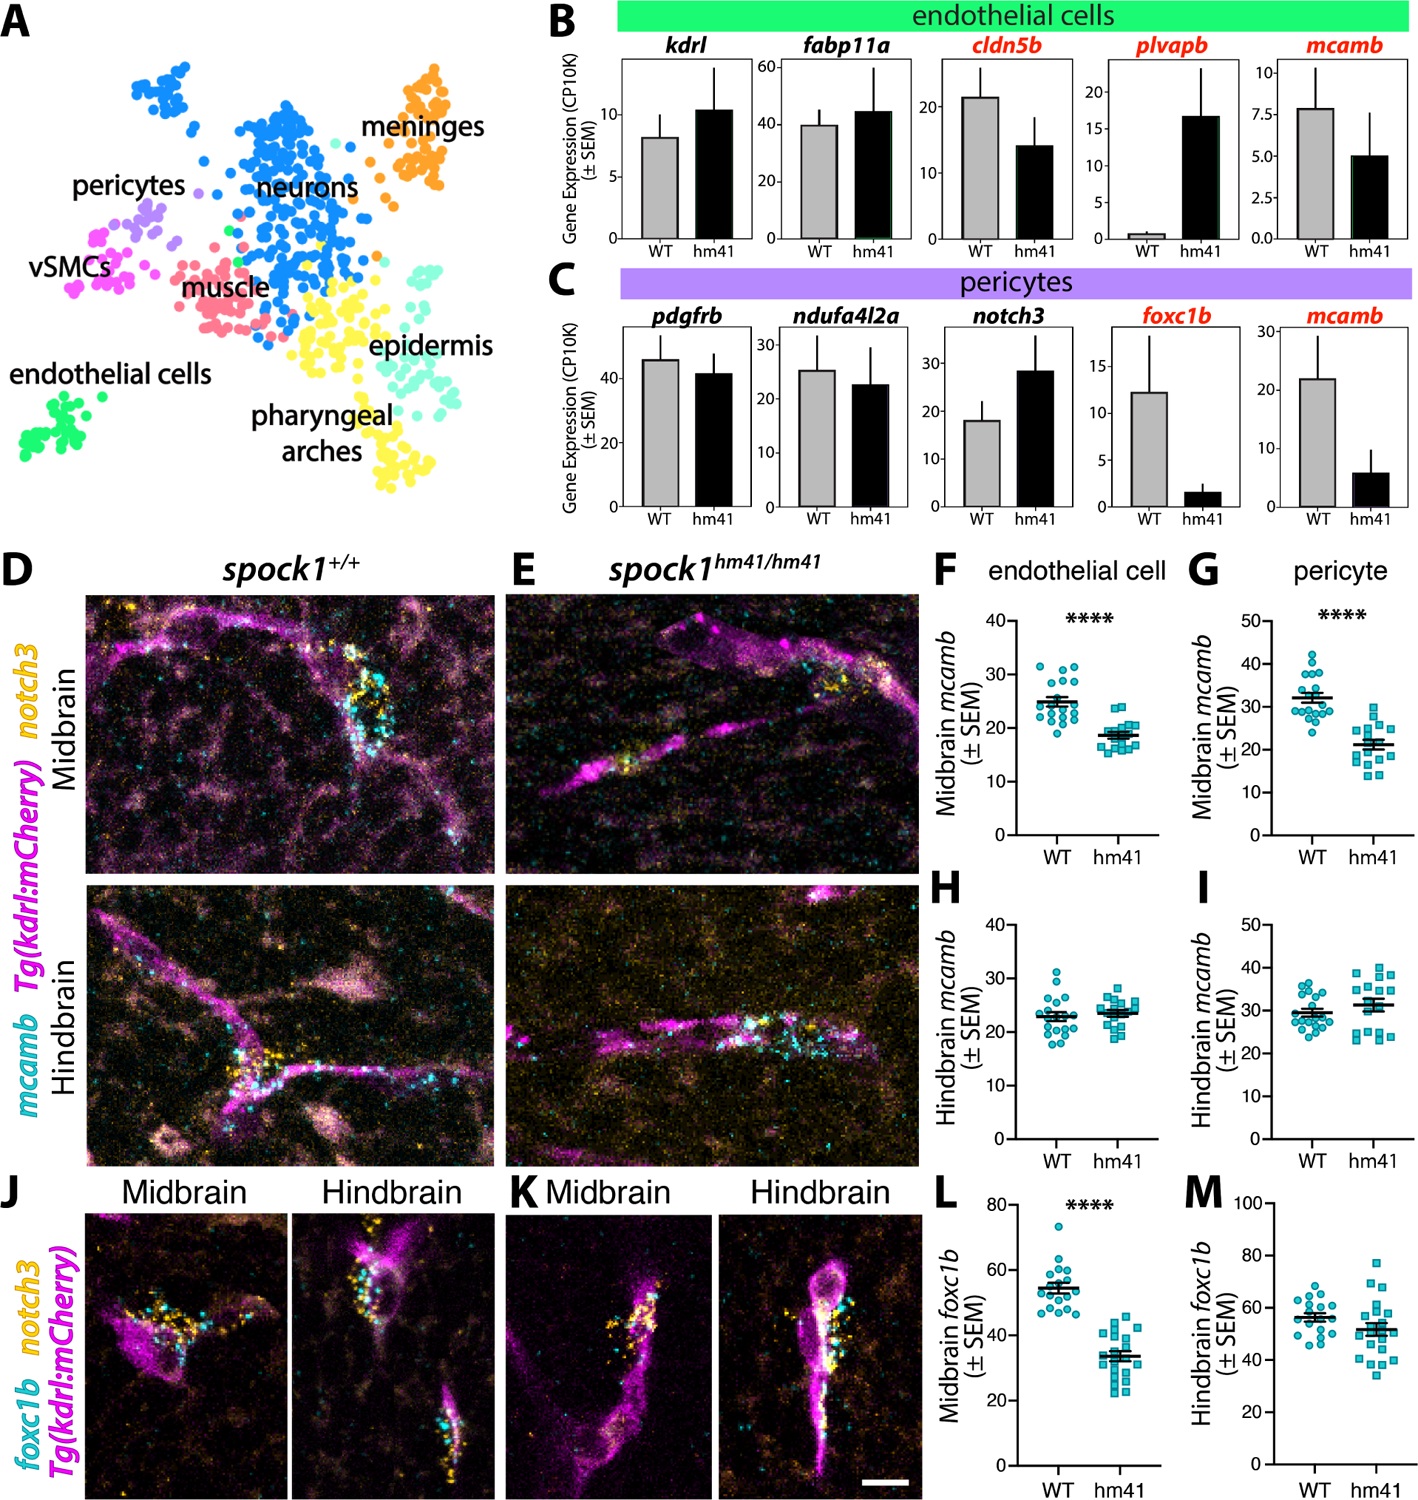
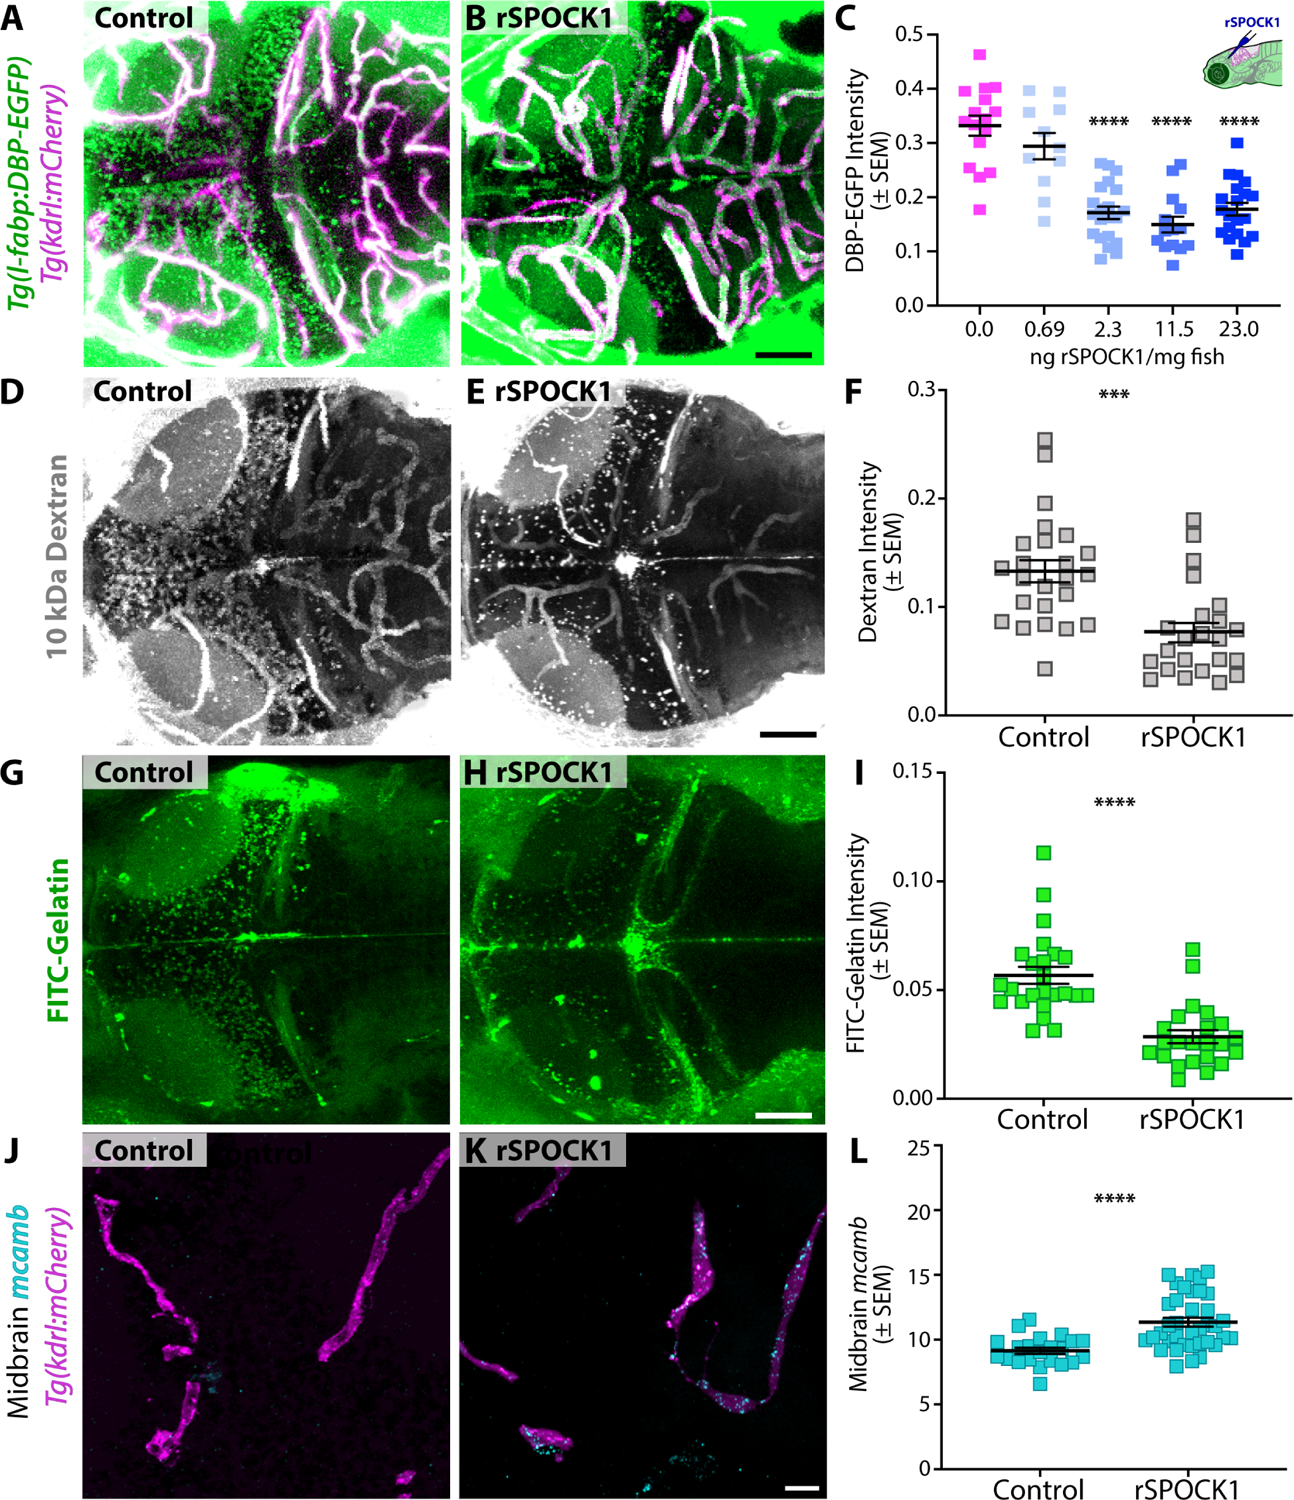
The blood-brain barrier (BBB) is a unique set of properties of the brain vasculature which severely restrict its permeability to proteins and small molecules. Classic chick-quail chimera studies have shown that these properties are not intrinsic to the brain vasculature but rather are induced by surrounding neural tissue. Here, we identify Spock1 as a candidate neuronal signal for regulating BBB permeability in zebrafish and mice. Mosaic genetic analysis shows that neuronally expressed Spock1 is cell non-autonomously required for a functional BBB. Leakage in spock1 mutants is associated with altered extracellular matrix (ECM), increased endothelial transcytosis, and altered pericyte-endothelial interactions. Furthermore, a single dose of recombinant SPOCK1 partially restores BBB function in spock1 mutants by quenching gelatinase activity and restoring vascular expression of BBB genes including mcamb. These analyses support a model in which neuronally secreted Spock1 initiates BBB properties by altering the ECM, thereby regulating pericyte-endothelial interactions and downstream vascular gene expression.

Keywords: blood vessel; blood-brain barrier; development; genetics; leakage; zebrafish.


Conflict of interest statement

Declaration of interests The authors declare no competing interests.

Figures

Figure 1.
Figure 1.. Spock1 induces BBB functional development.
(A-E) Fluorescent tracer leakage assays in larval zebrafish reveal BBB leakage in the forebrain and midbrain of both injected 1 kDa Alexa Fluor 405 NHS Ester (turquoise) and 80 kDa DBP-EGFP (green) of hm41 homozygous larvae (C) compared to wild type controls (B) throughout larval development, as quantified in D and E. (F-G) Sagittal sections of adult brains show that the mutant leakage persists into adulthood (G). (H) Linkage mapping of the hm41 mutant phenotype reveals tight linkage to spock1 on chromosome 14. (I) Spock1hm41 has several point mutations (T241A and several silent mutations) in the SPARC domain. Spock1hm43 has a deletion of the 5’ UTR and start codon. (J-O) Dextran leakage assays show spock1hm43/hm43 mutants (K) have increased BBB leakage (L). spock1hm43/hm43 mutants also have increased expression of the leaky vessel marker plvapb (N and O). (P-S) Compound spock1hm43/hm41 heterozygotes also display increased NHS Ester (Q) and Dextran (S) leakage compared to spock1hm41/+ heterozygote siblings, which confine both injected tracers at 5 dpf (P and R). Scale bars represent 50 μm (C, N, S) and 200 μm (G). N = 10 (D and E) and 14 (L and O), with each point representing an individual fish. **** p<0.0001 by 2way ANOVA (D and E) and by t test (L and O).
Figure 2.
Figure 2.. Neuronal Spock1 regulates endothelial cells within a 10–20 μm range.
(A-B) Sagittal (A) and dorsal (B) maximum intensity projections (MIPs) of the TgKI(spock1:mCherry) (magenta) knock-in reveals expression of spock1 throughout the CNS, including the retina, brain and spinal cord with all cells in the fish labelled by Tg(actb2:memCitrine) (green). (C-F) Whole-mount HCR in situ hybridization for spock1 (C) confirms signal throughout the 5 dpf brain, in elavl3+ (D) neurons and absent from kdrl+ vasculature (E). Insets are zoomed in 10 μm thick MIPs from the midbrain region to further resolve the absence of spock1 signal in the vasculature (outlined in white). (G) Schematic of transplantation experiments. Cells from donor embryos labeled with 10 kDa Dextran (red) at the single cell stage are transplanted into unlabeled host embryos at sphere stage. Leakage of the injected 1 kDa AF 405 NHS Ester (turquoise) into the midbrain parenchyma is then measured in relationship to the distance (d) from the blood vessel to the nearest donor cell in the 5 dpf chimeric larvae. (H-J) Representative dorsal 20 μm thick MIP confocal image of a chimeric larva with transplanted wild type donor cells (red) into a wild type host (H, WT→WT), spock1hm41/hm41 donor cells into a spock1hm41/hm41 mutant host (I, hm41→hm41), and wild type donor cells into a spock1hm41/hm41 mutant host (J, WT→hm41). (K) Quantification of mean NHS leakage in WT→WT (black line, N=11) and hm41→hm41 (magenta line, N=8) reveals no change in tracer leakage in relationship to the nearest donor cell, with wild type fish confining the tracer and mutant fish leaking the tracer. However WT→hm41 (turquoise line, N=11) transplants reveal a full rescue of the leakage in the mutant background when the transplanted cell is within 10 μm of a blood vessel and no effect if the donor cell is further than 20 μm from the vessel. (L-M) Zoomed in images of WT→hm41 transplants. The white arrows point to instances of local rescue of tracer (turquoise) leakage when the wild type donor cell is close but not directly contacting the mutant vasculature (magenta). The yellow arrowhead marks wild type donor cells that fall outside the range of Spock1 signaling. Scale bars represent 50 μm (D and K) and 10 μm (G and N). * p=0.0495, *** p=0.0001, **** p<0.0001 by 2way ANOVA compared to WT→WT transplants.
Figure 3.
Figure 3.. Spock1 mutant leakage arises through increased endothelial vesicles.
(A-B) The neurovascular unit remains intact in spock1hm41/hm41 mutants (B) with a continuous single layer of endothelial cells (pseudocolored magenta) enclosing the lumen (pseudocolored orange) and in close contact with pericytes (pseudocolored green). (C-H) The majority of tight junctions (white arrowheads) are functionally restrictive in the spock1hm41 mutant endothelial cells (88%). Mutant endothelial cells displayed a significant increase in vesicular density, including both small flask shaped vesicles (yellow stars, G) and larger vesicles greater than 200 nm in diameter (outlined by a white dashed line in F, H). (I-K) While pericyte coverage is unaltered in spock1hm41 mutants, the pericyte-endothelial cell interactions are altered in the mutants, with several instances of direct pericyte-endothelial cell contact (white arrows) and overall diminished average basement membrane thickness between the two vascular cells (K). Scale bars represent 1 μm (B) and 200 nm (J). N= 4 fish, each demarcated by a unique color, with 10 vessels analyzed per fish and shown as individual points. ** p=0.0029 (H), **** p<0.0001 by nested t test (G and K).
Figure 4.
Figure 4.. The extracellular matrix is misregulated in spock1 mutants.
(A-C) In vivo gelatin zymography in wild type (A) and spock1hm41/hm41 mutants (B) reveals significantly increased gelatinase activity in the mutant midbrain compared to wild type siblings (C). (D-I) Immunofluorescence staining for vascular extracellular matrix proteins Collagen IV (yellow, D-F) and Fibronectin (green, G-I) that are required for vascular integrity reveal significantly reduced levels of all basement membrane proteins assayed within in the kdrl:mCherry labelled vasculature (magenta), quantified in F and I. N=21 (C) and 15 (F and I) fish analyzed for each genotype and depicted as individual points. Scale bars represent 50 μm (B) and 10 μm (H). ** p=0.0014, **** p<0.0001 by unpaired t test.
Figur 5.
Figur 5.. Spock1 plays a conserved role in inducing barrier function during embryonic development in mice.
(A) Schematic of functional tracer leakage assays in embryonic day 15.5 (E15.5) mice. (B-G) Wild type mice confine both injected 550 Da NHS-Biotin (B) and 10 kDa Dextran (D) within the vasculature, as previously reported. However, Spock1−/− mice leak both NHS-Biotin (C) and Dextran (E) into the brain parenchyma. Quantification of the total area of NHS-Biotin leakage (D) and Dextran leakage (G) normalized to vessel area where a ratio of 1 indicates no leakage reveals a significant increase in extravasation of both tracers in the Spock1−/−embryos (p=0.0191 (F) and p=0.0048 (G) by nested t test). (H-L) Zoomed in view of 10 kDa Dextran (green) injected embryos immunostained for the leaky vessel marker PLVAP (magenta) in wild type (H,J) reveals that the increased BBB permeability in Spock1−/− mice is accompanied by an increase in PLVAP expression in the vasculature (I,K). Quantification of PLVAP expression within the vasculature (L) reveals a significant increase in PLVAP expression in the Spock1−/− embryos (p=0.0016 by nested t test). N=4 embryos for each genotype, marked by unique colors, with 5 sections analyzed per embryo and shown as individual points. Scale bars represent 100 μm (F) and 50 μm (K).
Figure 6.
Figure 6.. Spock1hm41/hm41 mutant vascular cells have reduced expression of BBB regulators.
(A) UMAP of Leiden cluster 13 following subclustering and annotated by cell type, with pericytes (purple) separating from vascular smooth muscle cells (vSMCs, pink) and endothelial cells (green). (B-C) Mean gene expression in wild type (WT, grey bars) and spock1 mutant (hm41, black bars) endothelial cells (B) and pericytes (C). Error bars represent SEM. Mutants appear to have lower levels of mcamb in both pericytes and endothelial cells and reduced foxc1b expression in pericytes. (D-I) HCR FISH reveals strong expression of mcamb (turquoise) in wild type vessels (magenta) and notch3+ pericytes (orange, D), both in the midbrain (F-G) and hindbrain (H-I). Spock1 mutants have significantly reduced expression of mcamb in the midbrain (E-G), but normal levels in the hindbrain (H-I), where no leakage is observed. (J-M) HCR FISH reveals expression of foxc1b (turquoise) in wild type notch3+ pericytes (orange, J), both in the midbrain (L) and hindbrain (M). Spock1 mutants have significantly reduced expression of foxc1b (K) in the midbrain (L) but not in the hindbrain (H). Scale bar represents 10 μm. **** p<0.0001 by unpaired t test.
Figure 7.
Figure 7.. Spock1 induces BBB properties by modulating the brain microenvironment, altering vascular cell biology non-autonomously.
(A-C) A single intracranial injection of human rSPOCK1 into the brain at 5 dpf reduces mutant leakage of DBP-EGFP at 6 dpf about 50% (B) compared to controls injected with PBS alone (A), quantified in C. (D-F) Similarly, injection of rSPOCK1 at 4 dpf reduces mutant leakage of 10 kDa Dextran at 5 dpf (E), quantified in F. (F-I) The addition of rSPOCK1 reduces gelatinase activity in the mutant brain (H) compared to control injected mutants (F), quantified in I. (J-L) Vascular expression of mcamb in the midbrain is partially restored following rSPOCK1 intracranial injections (K), quantified in L. Scale bars represent 50 μm (C, E, F) and 10 μm (K). **** p<0.0001 by 2way ANOVA compared to PBS injected control spock1hm41/hm41 mutants in C and by t test in I and L, *** p<0.001 by t test in F.

References

    1. Sweeney MD, Sagare AP, and Zlokovic BV (2018). Blood–brain barrier breakdown in Alzheimer disease and other neurodegenerative disorders. Nature Publishing Group 14, 133–150. 10.1038/nrneurol.2017.188. - DOI - PMC - PubMed
    1. Reese TS, and Karnovsky MJ (1967). Fine structural localization of a blood-brain barrier to exogenous peroxidase. J Cell Biology 34, 207–217. 10.1083/jcb.34.1.207. - DOI - PMC - PubMed
    1. Campbell M, Kiang A-S, Kenna PF, Kerskens C, Blau C, O’Dwyer L, Tivnan A, Kelly JA, Brankin B, Farrar G-J, et al. (2008). RNAi-mediated reversible opening of the blood-brain barrier. The Journal of Gene Medicine 10, 930–947. 10.1002/jgm.1211. - DOI - PubMed
    1. Ben-Zvi A, Lacoste B, Kur E, Andreone BJ, Mayshar Y, Yan H, and Gu C (2014). Mfsd2a is critical for the formation and function of the blood-brain barrier. Nature 509, 507–511. 10.1038/nature13324. - DOI - PMC - PubMed
    1. Andreone BJ, Chow BW, Tata A, Lacoste B, Ben-Zvi A, Bullock K, Deik AA, Ginty DD, Clish CB, and Gu C (2017). Blood-Brain Barrier Permeability Is Regulated by Lipid Transport-Dependent Suppression of Caveolae-Mediated Transcytosis. Neuron 94, 581–594.e5. 10.1016/j.neuron.2017.03.043. - DOI - PMC - PubMed

Publication types