. 2023 Aug;620(7974):643-650.
doi: 10.1038/s41586-023-06362-4. Epub 2023 Jul 12.

Immune sensing of food allergens promotes avoidance behaviour

Affiliations

Immune sensing of food allergens promotes avoidance behaviour

Esther B Florsheim et al. Nature. 2023 Aug.

Abstract

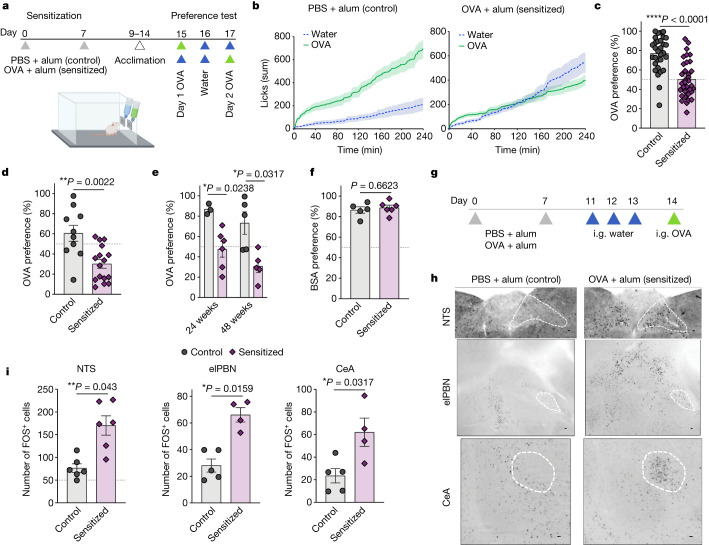
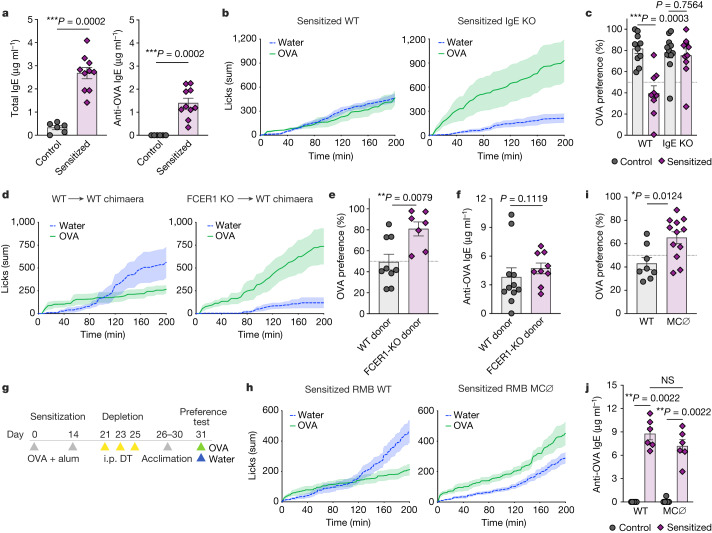
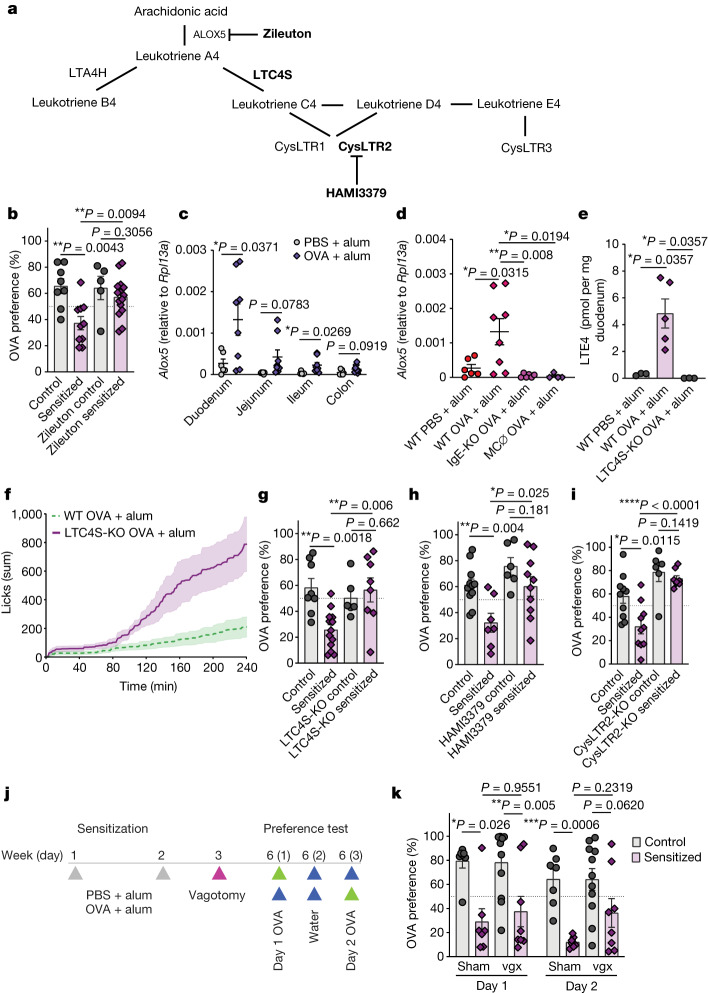
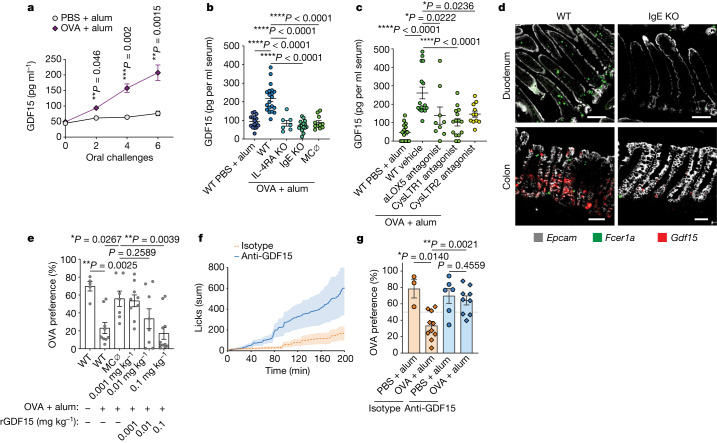
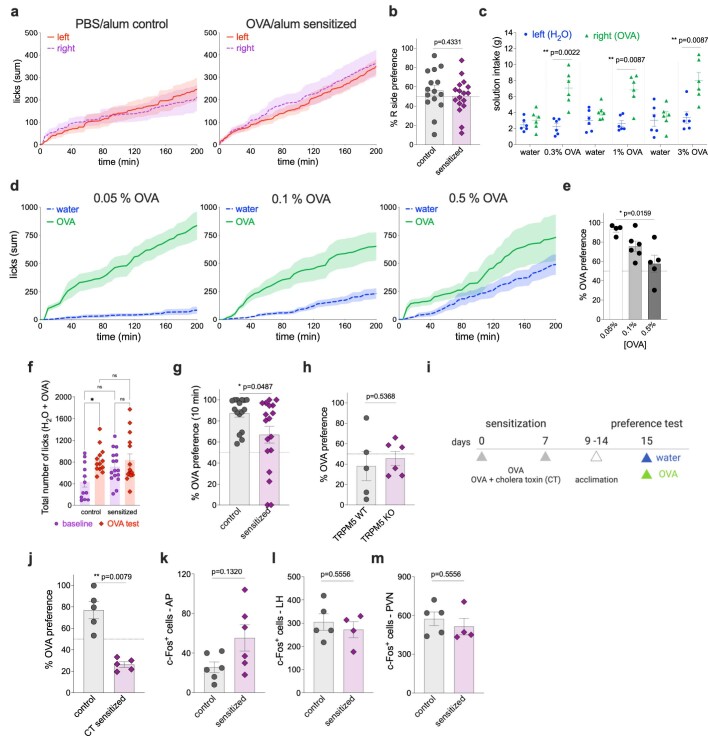
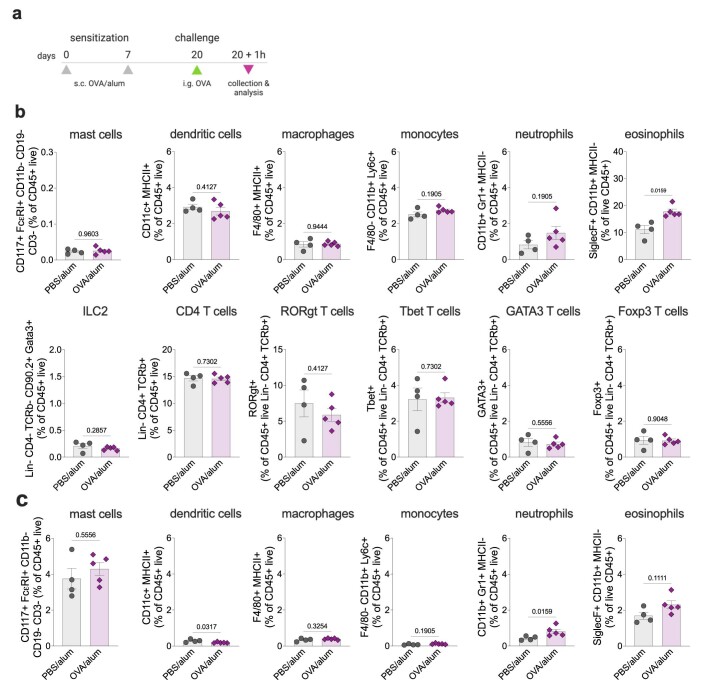
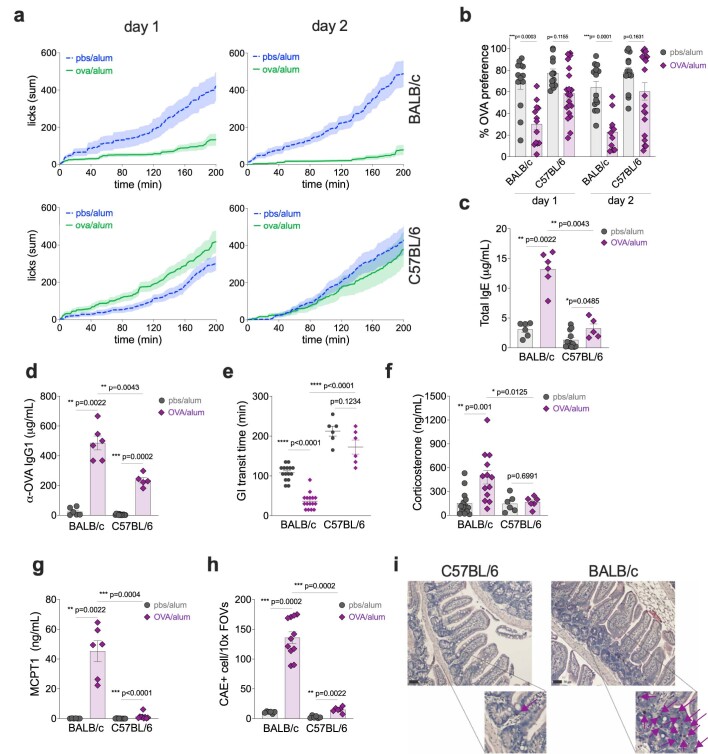
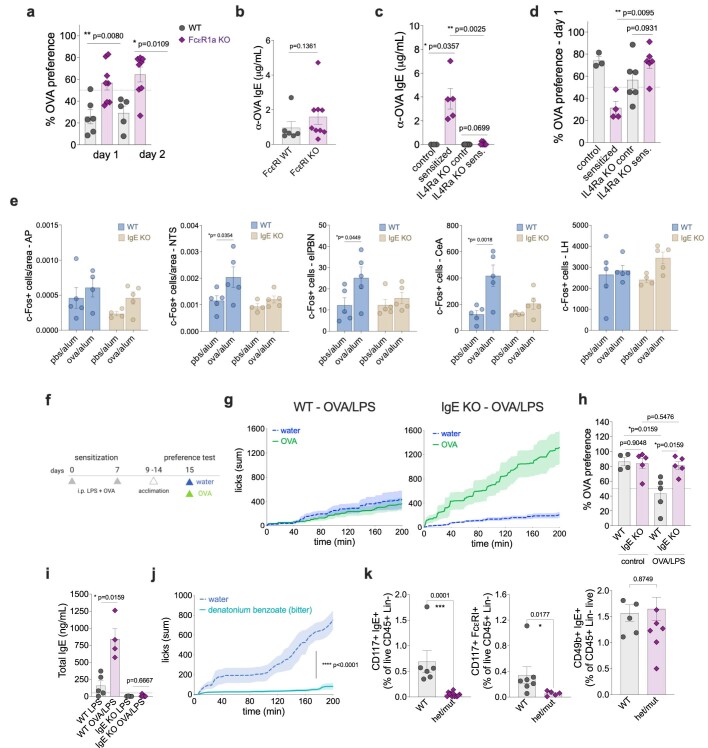
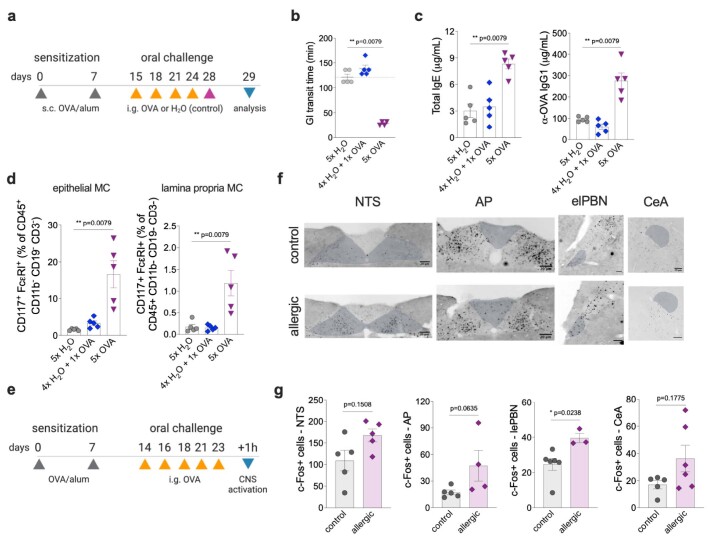
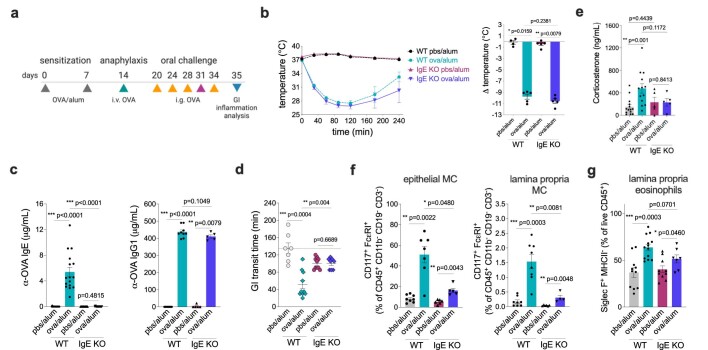
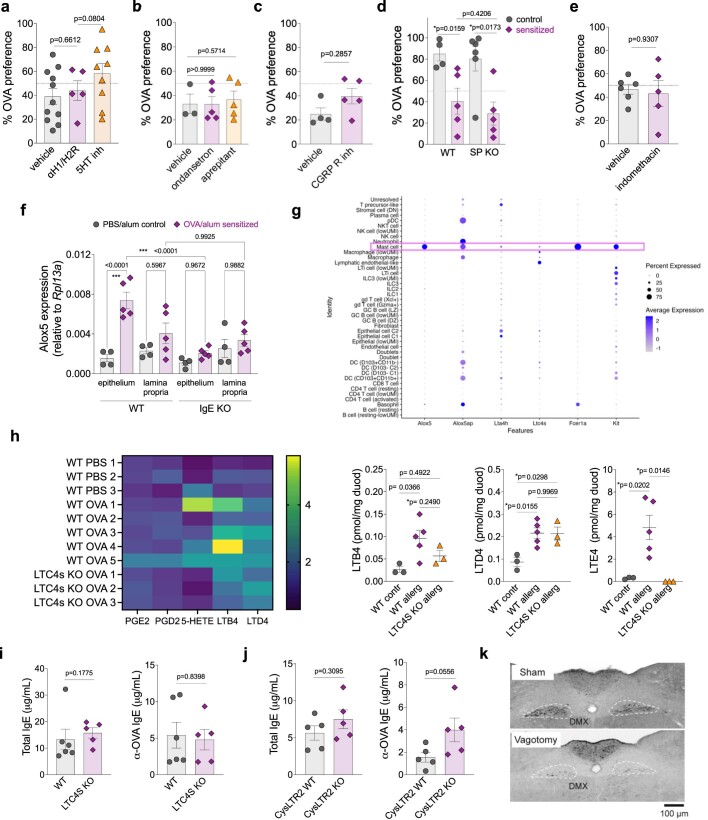
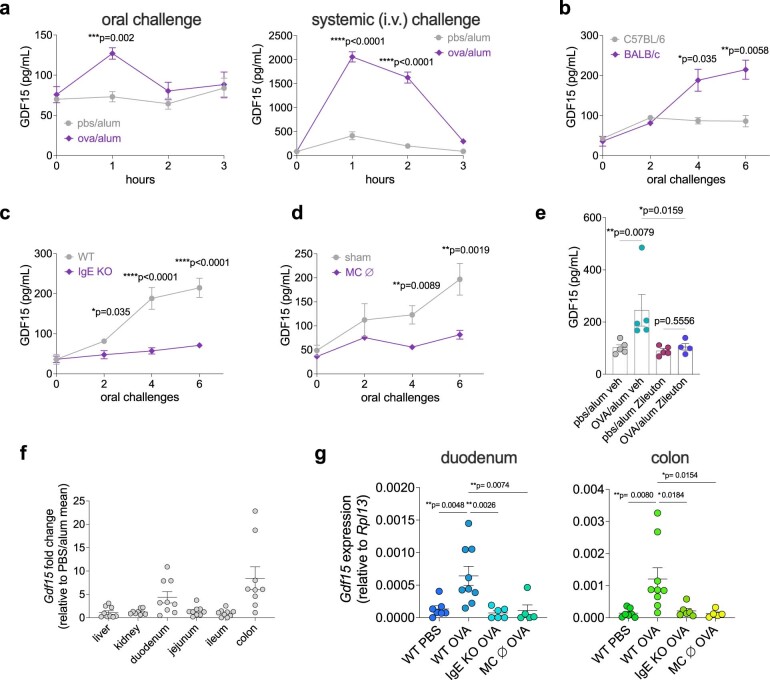
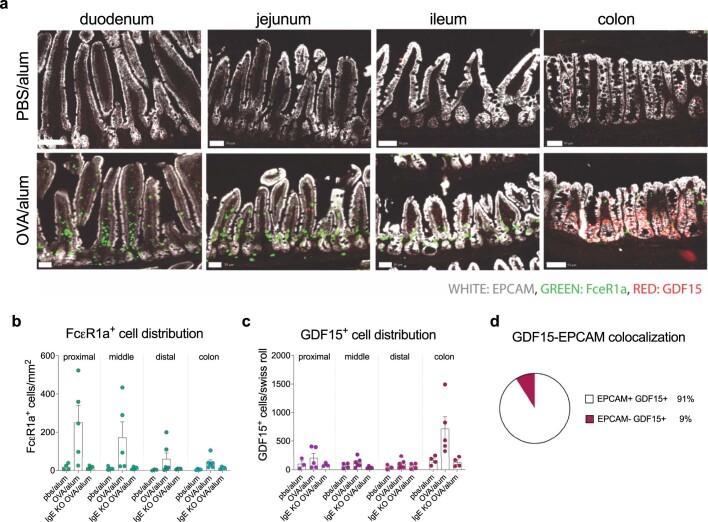
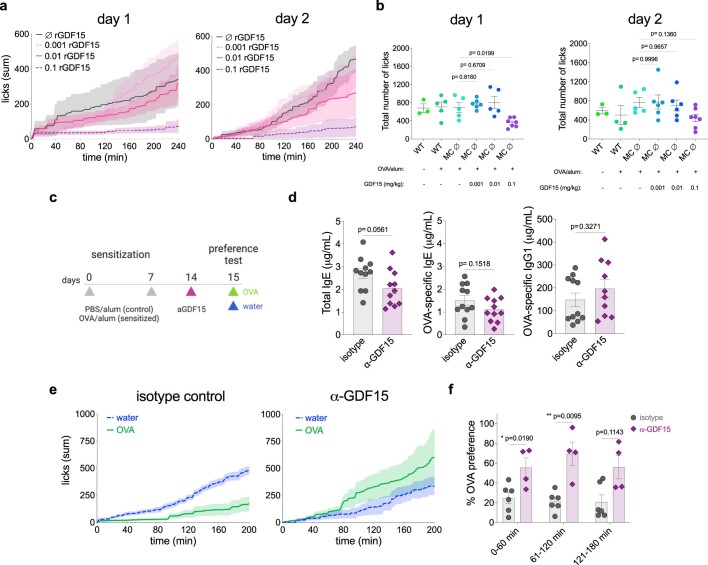
In addition to its canonical function of protection from pathogens, the immune system can also alter behaviour1,2. The scope and mechanisms of behavioural modifications by the immune system are not yet well understood. Here, using mouse models of food allergy, we show that allergic sensitization drives antigen-specific avoidance behaviour. Allergen ingestion activates brain areas involved in the response to aversive stimuli, including the nucleus of tractus solitarius, parabrachial nucleus and central amygdala. Allergen avoidance requires immunoglobulin E (IgE) antibodies and mast cells but precedes the development of gut allergic inflammation. The ability of allergen-specific IgE and mast cells to promote avoidance requires cysteinyl leukotrienes and growth and differentiation factor 15. Finally, a comparison of C57BL/6 and BALB/c mouse strains revealed a strong effect of the genetic background on the avoidance behaviour. These findings thus point to antigen-specific behavioural modifications that probably evolved to promote niche selection to avoid unfavourable environments.


Conflict of interest statement

A.W. received funding from NGM Biopharmaceuticals for research projects unrelated to this study through the Yale Office of Sponsored Projects. The authors declare no other competing interests.

Figures

Fig. 1
Fig. 1. Allergic sensitization induces specific and long-lasting avoidance behaviour to food allergen.
a, Schematic protocol for allergic sensitization and behavioural assay. b, Cumulative licks from mice sensitized with phosphate-buffered saline (PBS) + alum (left) or OVA + alum (right). Preference test consisting of one water bottle and one 1% OVA bottle on day 1 (n = 9–10 mice per group). c, Preference to OVA solution (n = 31 control and 34 allergic mice per group) on day 1 of the test. d, Preference to OVA with switched side bottles on day 2 of the test (n = 10 control and 16 allergic per group). e, Preference to OVA at 24 or 48 weeks after alum or OVA + alum sensitization (n = 3–6 mice per group). f, Preference to bovine serum albumin (BSA; n = 5 control and 6 allergic mice per group). g, Schematic protocol of allergic sensitization and oral challenge. Mice were administered intragastric (i.g.) OVA after OVA + alum sensitization and three sham gavages with water. Controls were sensitized with alum alone. h, Immunofluorescence images of the NTS (top), elPBN (middle) and CeA (bottom) from control (n = 5) or OVA + alum-sensitized (n = 4) mice using anti-FOS antibody, 90 min after OVA challenge. Scale bars, 100 µm. i, Number of FOS+ neurons in the NTS (left), elPBN (middle) and CeA (right) of control or OVA + alum-sensitized mice. Graphs show mean ± s.e.m. *P ≤ 0.05, **P ≤ 0.01, ****P ≤ 0.0001. Two-tailed Mann–Whitney test. Each panel is representative of at least two independent experiments. a,g, Created with BioRender.com. Source Data
Fig. 2
Fig. 2. Allergic avoidance requires IgE and mast cells.
a, Total (left) and OVA-specific (right) levels of serum IgE on day 14 after allergic sensitization in BALB/c mice (n = 6 control and 11 allergic mice per group). b, Cumulative licks to water and OVA solutions during the two-bottle preference test in OVA + alum-sensitized IgE-KO (right) and wild-type (WT) littermate control (left) mice (n = 6 WT and 6 IgE-KO mice per group). c, Drinking preference to OVA bottles in controls and allergic sensitized WT or IgE-KO mice (n = 9–11 mice per group). d, Cumulative licks to water and OVA bottles in OVA + alum-sensitized WT (left) or FCER1 (right) chimaeras. WT or FCER1-KO bone marrow haematopoietic cells were transplanted into irradiated WT recipients (n = 5 WT to FCER1 and 6 FCER1 into WT). e, Drinking preference to OVA bottles in allergic sensitized WT or FCER1 chimaeras (n = 9 WT to FCER1 and 7 FCER1 into WT). f, OVA-specific IgE (n = 11 WT to FCER1 and 9 FCER1 into WT). g, Schematic protocol of FCER1+ cell depletion with diphtheria toxin (DT) in RMB BALB/c mice. h, Cumulative licks to water and OVA bottles in allergic sensitized and diphtheria toxin-injected RMB WT (left) and RMB mutants (right) (n = 9 RMB WT and 14 RMB heterozygotes or mutants). MC ∅, mast cell depleted. i,j, Preference to OVA solution (n = 8 RMB WT and 12 RMB heterozygotes or mutants) (i) and OVA-specific IgE (n = 6 per group) (j) in diphtheria toxin-injected RMB WT and mutants. Graphs show mean ± s.e.m. *P ≤ 0.05, **P ≤ 0.01, ***P ≤ 0.001; NS, not significant. Two-tailed Mann–Whitney test. Each panel is representative of at least two independent experiments. g, Created with BioRender.com. Source Data
Fig. 3
Fig. 3. Allergen-induced avoidance behaviour requires cysteinyl leukotrienes.
a, Leukotriene biosynthetic pathway with targets of inhibitors and knockout mice in bold. b, Preference to OVA in OVA + alum-sensitized BALB/c mice. Zileuton was used as an ALOX5 inhibitor 1 h before the preference test (n = 8 vehicle control, 10 vehicle allergic, 5 zileuton control, 15 zileuton allergic). c, Alox5 expression across the gastrointestinal tract of control and OVA + alum-sensitized BALB/c mice after allergen oral challenges (n = 6 control and 8 allergic). d, Alox5 expression in the duodenum of OVA-sensitized WT, IgE-deficient or mast cell-depleted mice (n = 6 WT control, 8 WT allergic, 6 IgE-KO allergic, 4 MC-depleted allergic). e, Concentration of LTE4 per milligram of duodenal tissue determined by mass spectrometry in allergic WT and LTC4S-KO mice after oral challenges (n = 3 WT control, 5 WT allergic, 3 LTC4S-KO allergic). f,g, Cumulative licks of OVA (f; n = 9 WT allergic, 5 LTC4S-KO allergic) and OVA preference (g; n = 8 WT control, 13 WT allergic, 6 LTC4S-KO control, 8 LTC4S-KO allergic) of sensitized LTC4S-KO or BALB/c control mice. h, Preference to OVA in OVA + alum-sensitized mice. HAMI3379 was used as a CysLTR2 inhibitor 1 h before the preference test (first day of preference testing shown; n = 11 vehicle control, 7 vehicle allergic, 6 HAMI3379 control, 10 HAMI3379 allergic). i, OVA preference of sensitized CysLTR2-KO or BALB/c control mice during the first day of testing (n = 10 WT control and allergic, 6 CysLTR2-KO control, 8 CysLTR2-KO allergic). j, Schematic protocol for subdiaphragmatic vagotomy in OVA + alum-sensitized BALB/c mice. k, OVA preference was determined 3 weeks post vagotomy (vgx; n = 7 sham control, 7 sham allergic, 11 vagotomy control, 8 vagotomy allergic). Graphs show mean ± s.e.m. *P ≤ 0.05, **P ≤ 0.01, ***P ≤ 0.001, ****P ≤ 0.0001. b,e,gi,k, Two-tailed Man–Whitney test. c,d, One-way analysis of variance (ANOVA) with Tukey’s multiple-comparison test. Each panel is representative of at least two independent experiments. j, Created with BioRender.com. Source Data
Fig. 4
Fig. 4. Allergen-induced avoidance requires GDF15.
a, Serum levels of GDF15 in sensitized BALB/c mice after oral allergen challenges (n = 6 control and 10 allergic). b, Serum GDF15 in BALB/c WT, IL-4RA KO, IgE-KO and mast cell-depleted (MC ∅) RMB mice after 6 oral challenges with OVA (n = 16 WT control, 20 WT allergic, 15 IgE-KO allergic, 11 MC-depleted allergic, 7 IL-4RA-KO allergic). c, Serum GDF15 after 6 oral challenges in BALB/c WT mice pretreated with zileuton (ALOX5 antagonist), montelukast (CYSLTR1 antagonist), HAMI3379 (CYSLTR2 antagonist) or vehicle before each challenge (n = 15 vehicle control, 16 vehicle allergic, 11 HAMI3379 allergic, 15 montelukast allergic, 9 zileuton allergic). d, Expression of Gdf15 mRNA by RNAscope in the duodenum and colon of allergic (sensitization and five oral challenges) WT or littermate IgE-KO mice (representative of 2 independent experiments with n > 3 biological replicates in each group, see Extended Data Fig. 9). Scale bars, 100 µm (for duodenum) and 50 µm (for colon). e, OVA preference 1 h after administration of recombinant GDF15 (rGDF15) in mast cell-depleted (MC ∅) RMB mice (n = 5 WT control, 9 WT allergic, 7 MC depleted, 9 MC depleted + 0.001 mg kg−1, 8 MC depleted + 0.01 mg kg−1, 11 MC depleted + 0.1 mg kg−1 rGDF15). f, Cumulative licks on OVA bottle during two-bottle preference test in sensitized WT mice 5 h after injection with blocking GDF15 antibody or isotype control (n = 6 allergic isotype and 6 allergic anti-GDF15). g, Sensitized WT mice were injected with blocking GDF15 antibody, and the OVA preference was quantified 5 h later (n = 3 isotype control, 10 isotype allergic, 6 anti-GDF15 control, 9 anti-GDF15 allergic). Graphs show mean ± s.e.m. *P ≤ 0.05, **P ≤ 0.01, ****P ≤ 0.0001. ac,e, One-way ANOVA with Sidak’s multiple-comparison test. g, Two-tailed Mann–Whitney U-test. Each panel is representative of at least two independent experiments. Source Data
Extended Data Fig. 1
Extended Data Fig. 1. Characterization of immunological avoidance.
a, Cumulative licks of water solution from right- or left-positioned bottles from control (left) and OVA/alum sensitized BALB/c mice (right) (n = 15-18). b, Preference to the water bottle located on the right side by control and OVA/alum sensitized mice (n = 15 control and 17 allergic). c, Solution intake of water and varying concentrations of OVA in control mice on day 1 of the two-bottle preference test (n = 6 per concentration). d, Cumulative licks to different concentrations of OVA from mice sensitized with OVA/alum (n = 5-6 per concentration). e, Preference to different concentrations of OVA in sensitized mice (n = 4-6 per concentration). f, Total number of licks during water baseline or OVA test day 1, determined as the sum of licks from the two bottles at 200 min (n = 12-13 control and 15-16 allergic). g, Preference to 1% OVA solution within 10 min of offering the two bottles (n = 16 control and 18 allergic). h, OVA preference by OVA/alum sensitized TRPM5 WT or KO mice (n = 5 WT and 6 TRPM5 KO). i, Experimental protocol for oral sensitization to OVA with cholera toxin (CT). Mice were administered with i.g. OVA with or without CT on days 0 and 7. Controls received OVA alone. j, Preference to OVA on day 1 of preference test (n = 5 control and 5 CT sensitized). k-m, Total number of cFos+ cells in the area postrema (AP), lateral hypothalamus (LH), and paraventricular nucleus of the hypothalamus (PVN) of OVA/alum sensitized mice (n = 6 control and 6 allergic). Graphs show mean ± s.e.m. *p ≤ 0.05, **p ≤ 0.01, ***p ≤ 0.001. a-e and g-m, two-tailed Mann-Whitney test, f, one-way ANOVA with Dunn’s multiple comparisons test. Each panel is representative of at least two independent experiments. i, Created with BioRender.com. Source Data
Extended Data Fig. 2
Extended Data Fig. 2. Enteric immune populations.
a, Experimental protocol to determine cellular inflammation in the small intestines upon oral challenge. BALB/c mice were sensitized with OVA/alum on d0 and d7 and orally challenged with OVA on day 20. One hour later, small intestine cells from the lamina propria (b) and epithelial layer (c) were isolated and analysed by flow cytometry. Graphs are representative of two independent experiments, n = 4-5 per group. Graphs show mean ± s.e.m. *p ≤ 0.05, **p ≤ 0.01, ***p ≤ 0.001. Two-tailed Mann-Whitney test. Each panel is representative of at least two independent experiments. a, Created with BioRender.com. Source Data
Extended Data Fig. 3
Extended Data Fig. 3. Food avoidance in C57BL/6 strain.
a, Cumulative licks of OVA solution from BALB/c or C57BL/6 female mice sensitized with PBS/alum or OVA/alum. After day 1, mice received water bottles, and on two-bottle preference test day 2, OVA bottles were offered on the opposite side of d1 (n = 12 control and 8 allergic BALB/cJ, 17 control and allergic C57BL/6J). b, Preference to OVA solution (n = 14 control and 13 allergic BALB/cJ, 12 control and 20 allergic C57BL/6J) . c, Total serum IgE in mice sensitized with OVA/alum and orally challenged five times (n = 6 control and allergic BALB/cJ, 12 control and 6 allergic C57BL/6J). d, OVA-specific IgG1 after allergic sensitization and challenges (n = 6 control and allergic BALB/cJ, 12 control and 5 allergic C57BL/6J). e, Gastrointestinal transit time was determined on the fourth oral challenge with OVA in control and OVA/alum sensitized mice using a red carmine assay (n = 15 control and 16 allergic BALB/cJ, 6 control and allergic C57BL/6J). f, Systemic corticosterone 1 h after the fifth OVA challenge in control and OVA/alum sensitized BALB/c or C57BL/6 mice (n = 14 control and 13 allergic BALB/cJ, 6 control and allergic C57BL/6J). g, MCPT-1 in the serum 1 h after the fifth oral OVA challenge (n = 6 control and allergic BALB/cJ, 12 control and 9 allergic C57BL/6J). h, Number of chloroacetate esterase (CAE) positive cells present in the jejunum upon 5 oral challenges of control or allergic mice (n = 6 control and 11 allergic BALB/cJ, 6 control and allergic C57BL/6J). i, Representative images of histological sections and CAE staining of OVA/alum-sensitized small intestines (jejunum) from C57BL/6 and BALB/c at magnitude 10x and zoomed images at 40x. Arrows indicate CAE-stained cells. Scale bars = 50 µm. Graphs show mean ± s.e.m. a and c-h, Two-tailed Mann-Whitney test, b, 2-way ANOVA with Turkey’s multiple comparisons test. Each panel is representative of at least two independent experiments. Source Data
Extended Data Fig. 4
Extended Data Fig. 4. Role of IgE signalling in allergic and non-allergic avoidance.
a, Drinking preference of BALB/c WT and FcεRI KO to OVA (n = 6 WT and 8 FcεR1 KO mice). b, OVA-specific serum IgE in WT and FcεRI KO mice sensitized with OVA/alum (n = 6 WT and 9 FceR1 KO mice). c, Serum levels of OVA-specific IgE (n = 3 WT control, 5 WT allergic, 7 IL-4Ra KO control and allergic). d, Two-bottle preference test in control and OVA/alum sensitized BALB/c IL-4Ra KO (n = 3 WT control, 4 WT allergic, 6 IL-4Ra KO control and allergic). e, Number of cFos+ neurons in the AP, NTS, elPBN, CeA, and LH of control or OVA/alum sensitized WT and IgE KO analysed 90 min after the first oral challenge (n = 4-5 WT or IgE KO control or allergic per group). f, Experimental protocol for i.p. sensitization to OVA and lipopolysaccharide (LPS) in WT and IgE KO C57BL/6 mice. g, Cumulative licks from C57BL/6 WT (left) or IgE KO (right) mice sensitized i.p. with OVA/LPS (n = 6 WT and 6 IgE KO). h, Preference to OVA solution from control (LPS only) and OVA/LPS-sensitized mice (n = 4 WT control, 5 WT allergic, 5 IgE KO control, 5 IgE KO allergic). i, Total serum IgE in WT and IgE KO mice sensitized with OVA/LPS (n = 4 WT control, 5 WT allergic, 5 IgE KO control, 5 IgE KO allergic). j, Cumulative licks during the two-bottle preference test with water and a solution containing the bitter compound denatonium benzoate in C57BL/6 IgE KO mice sensitized with OVA/alum (n = 5 IgE KO). k, Frequency of peritoneal (left), intestinal mast cells (centre), and blood basophils (right) by flow cytometry on d16 from control WT or het/mut RMB mice after 3 doses of diphtheria toxin (DT) on days 0, 2, and 4 (n = 6-7 WT and 5-12 RMB het/mut per group). Error bars indicate SEM. *p ≤ 0.05, **p ≤ 0.01, ***p ≤ 0.001. a-d and f-k, Two-tailed Mann-Whitney test, e, Two-way ANOVA with Bonferroni multiple comparisons test. Each panel is representative of at least two independent experiments. f, Created with BioRender.com. Source Data
Extended Data Fig. 5
Extended Data Fig. 5. Enteric inflammation and brain activation upon acute or chronic allergen exposure.
a, Experimental protocol for the development of gut allergic inflammation. BALB/c WT mice were orally challenged with OVA five times (5x OVA group), once on d28 (4x H2O + 1x OVA group) or they received only i.g. water (5x H2O group). Prior to OVA challenges, all mice were s.c. sensitized with OVA and alum. b, Gastrointestinal transit time was determined on day 28 upon the fifth oral gavage (n = 4-5 per group). c, Total serum IgE (left) and OVA-specific IgG1 (right) antibodies (n = 5 per group). d, Flow cytometry analysis of small intestinal mast cells from the epithelial layer (left) and lamina propria (right) (n = 5 per group). e, Experimental protocol for brain activation analysis in allergic and control WT BALB/c mice. f, Immunofluorescence images of the nucleus tractus solitarius (NTS), area postrema (AP), central amygdala (CeA), and lateral external parabrachial nucleus (elPBN) from control (n = 5-6) or OVA/alum sensitized allergic (n = 3-6) mice using anti-cFos antibody, 90 min after the last OVA challenge. Scale bars = 20 µm. g, Number of cFos+ neurons in the NTS, AP, elPBN, and CeA of control or OVA/alum sensitized mice. Graphs show mean ± s.e.m. *p ≤ 0.05, **p ≤ 0.01. Two-tailed Mann-Whitney test. Each panel is representative of at least two independent experiments. a,e, Created with BioRender.com. Source Data
Extended Data Fig. 6
Extended Data Fig. 6. IgE-dependent and independent roles in gut allergic inflammation.
a, Experimental protocol for the development of gut allergic inflammation and systemic anaphylaxis. Allergic BALB/c WT and littermate IgE KO mice were sensitized with OVA/alum whereas control mice received alum alone. All mice were orally challenged with OVA. b, Rectal temperature over time (left) and maximum temperature variation (right) after systemic OVA challenge on d1 (n = 4 WT control and n = 5 allergic, IgE KO control and allergic). c, OVA-specific IgE (left) and IgG1 (right) serum antibodies after five oral challenges with OVA (n = 13-17 per group L, n = 5-9 per group R). d, Gastrointestinal transit time was determined on day 31 following OVA challenge (n = 7 WT controls, 10 WT allergic, 10 IgE KO controls, 8 IgE KO allergic). e, Systemic levels of corticosterone 1h after the fifth OVA challenge in control and OVA/alum sensitized mice (n = 14 WT controls and allergic, 5 IgE KO controls and allergic). f-g, Flow cytometry analysis of isolated small intestinal cells from the epithelial layer (left) and lamina propria (centre and right) (n = 8 WT control and allergic, 6 IgE KO control, 5 IgE KO allergic, f) (n = 11 WT control, 13 WT allergic, 10 IgE KO control, 7 IgE KO allergic, g). h, Flow cytometry analysis of enteric mast cells (CD45+ CD19- CD3- CD11b- CD117int FcεRI+ cells) from the small intestine of OVA/alum sensitized BALB/c WT mice after OVA challenges. Controls were sensitized with alum alone and challenged with oral OVA. Graphs show mean ± s.e.m. *p ≤ 0.05, **p ≤ 0.01, ***p ≤ 0.001. Two-tailed Mann-Whitney test. Each panel is representative of at least two independent experiments. a, Created with BioRender.com. Source Data
Extended Data Fig. 7
Extended Data Fig. 7. Allergen-induced avoidance behaviour is independent of hallmark mediators but correlated with cysteinyl leukotrienes.
a-c, e, Drinking preference to OVA solution by OVA/alum sensitized WT BALB/c mice administered with H1 and H2 histamine receptors antagonists (loratadine and famotidine), serotonin synthesis inhibitor (parachlorophenylalanine), serotonin receptor 3 antagonist (ondansetron), substance P receptor NK1 antagonist (aprepitant), CGRP receptor inhibitor (BIBN4096), cyclooxygenase inhibitor (indomethacin), or their respective vehicle solutions prior to preference test (see Materials and methods for n for each group). d, Preference to OVA in C57BL/6 WT or substance P KO mice orally sensitized with OVA and cholera toxin (n = 4 WT control, 5 WT allergic, 6 Substance P KO control, 5 Substance P KO allergic). f, Alox5 expression levels in the epithelial and lamina propria compartments of the small intestine from BALB/c WT or IgE KO mice sensitized with PBS/alum (control) or OVA/alum (sensitized) (n = 4 WT control, 5 WT allergic, 4 IgE KO control, 5 IgE KO allergic). g, Comparison of gene expression in BALB/c intestinal immune cells from published scRNA-seq data of allergic mice (Xu et al., Immunity, 2019). h, Fold change in duodenal eicosanoids of allergic WT or LTC4S KO mice relative to average of control WT mice (left) and picomoles of detected leukotrienes per mg of duodenal tissue (right) detected by mass spectrometry (n = 3 WT control, 5 WT allergic, 3 LTC4s KO allergic). i, Total OVA- specific IgE concentrations in allergic WT or LTC4S KO mice at time of behavioural testing (n = 6 WT allergic, 5 LTC4s KO allergic). j, Total and OVA-specific IgE in allergic WT or CysLTR2 KO mice at time of behavioural testing (n = 5 WT allergic, 5 CysLTR2 KO allergic). k, Staining of the dorsal motor nucleus of the vagus after i.p. fluorogold injection in sham and vagotomised BALB/c mice to confirm efficiency of subdiaphragmatic vagotomy. Graphs show mean ± s.e.m. *p ≤ 0.05, **p ≤ 0.01, ***p ≤ 0.001. a-e and i-j, Two-tailed Mann-Whitney test, f-h, One-way ANOVA with Turkey’s multiple comparisons test. Each panel is representative of at least two independent experiments. Source Data
Extended Data Fig. 8
Extended Data Fig. 8. GDF15 is induced upon allergen exposure.
a, GDF15 serum levels induced by oral (left) (n = 3-8 control and 3-10 allergic per timepoint) or intravenous (right)(n = 4 control and 4 allergic per timepoint) OVA administration in sensitized BALB/c mice. b-d, Serum GDF15 induction after oral allergen challenges in OVA/alum sensitized BALB/c and C57BL/6 (n = 4 C57BL/6J, 9 BALB/cJ)(b), IgE KO (n = 9 WT, 15 IgE KO) (c), or mast cell-depleted RMB (n = 5-8 WT, 5-10 MC Dep mice per timepoint) (d) mice. e, Induction of serum GDF15 in control and sensitized mice after the administration of the 5- lipoxygenase inhibitor zileuton during oral challenges with OVA (n = 5 control vehicle, 5 allergic vehicle, 5 control zileuton, 4 allergic zileuton). f, Fold change in Gdf15 mRNA transcripts in the intestinal tissues of OVA/alum sensitized BALB/c mice relative to control groups (n = 9 WT allergic normalized to the average transcripts of 7 WT control mice per tissue). g, Gdf15 mRNA transcripts in the duodenum (left) and colon (right) in sensitized mice (n = 7 WT control, 9 WT allergic, 6 IgE KO allergic, 5 MC Dep allergic). Graphs show mean ± s.e.m. *p ≤ 0.05, **p ≤ 0.01, ***p ≤ 0.001. a-d, Two-tailed Student’s T-test, e, Two-tailed Mann-Whitney test, g, One-way ANOVA with Dunett’s multiple comparisons test. Each panel is representative of at least two independent experiments. Source Data
Extended Data Fig. 9
Extended Data Fig. 9. GDF15 originates from colonic epithelial cells.
a, Fcεr1a (green), EPCAM (grey), and GDF15 (red) transcripts across intestinal tissues in OVA/alum BALB/c sensitized and control mice by RNAScope. Scale bars =  50 µm. b-c, Analysis of intestinal distribution of FcεR1 expressing cells (b) and GDF15 expressing cells (c) from control and allergic sensitized WT or IgE KO mice (n = 4 WT control, 5 WT allergic, 4 IgE KO allergic per group). Quantification was performed after RNAscope technique. d, Colocalization analysis of GDF15 expressing colonic cells and cells expressing the epithelial cell marker, EPCAM utilizing sum of all WT 5 allergic mice. Graphs show mean ± s.e.m. *p ≤ 0.05, **p ≤ 0.01, ***p ≤ 0.001. Two-way ANOVA by Genotype/Sensitization Status and Anatomical Region. Representative of two independent experiments. Source Data
Extended Data Fig. 10
Extended Data Fig. 10. GDF15 blockade reduces allergen avoidance.
a, Cumulative licks of OVA over time and (b) total licks of OVA and water in mast cell-depleted RMB mice retreated with rGDF15 (mg/kg) from one experiment pertaining to Fig. 4e (n = 3 WT control, 5 WT allergic, 4 MC Dep, 6 MC Dep + 0.001mg/kg, 6 MC Dep + 0.01 mg/kg, 7 MC Dep + 0.1 mg/kg rGDF15). c, BALB/c mice were sensitized with OVA/alum and treated with a mouse GDF15 blocking antibody or isotype control 5 h prior to two bottle preference testing. d, Total IgE (left), OVA-specific IgE (centre), and OVA-specific IgG1 (right) antibodies after neutralizing GDF15 antibody treatment (n = 11 isotype, 10 aGDF15). e, Cumulative licks during the two-bottle preference test of isotype control (left) or GDF15 blocking antibody-treated (right) mice (n = 6 isotype, 6 aGDF15). f, OVA preference of OVA/alum sensitized mice that received either GDF15 blocking antibody or isotype control 5 h prior to the behavioural assay (n = 6 isotype, 4 aGDF15). Graphs show mean ± s.e.m. *p ≤ 0.05, **p ≤ 0.01, ***p ≤ 0.001. a-b, One-way ANOVA with Dunnett’s multiple comparisons test, d, Two-tailed Student’s t-test, f, Two-tailed Mann-Whitney test. Each panel is representative of at least two independent experiments. c, Created with BioRender.com. Source Data

Update of

Comment in

References

    1. Hoffman SA, Shucard DW, Harbeck RJ. The immune system can affect learning: chronic immune complex disease in a rat model. J. Neuroimmunol. 1998;86:163–170. doi: 10.1016/S0165-5728(98)00052-6. - DOI - PubMed
    1. Talbot S, Foster SL, Woolf CJ. Neuroimmunity: physiology and pathology. Annu. Rev. Immunol. 2016;34:421–447. doi: 10.1146/annurev-immunol-041015-055340. - DOI - PubMed
    1. Jackson, K. D., Howie, L. D. & Akinbami, L. J. Trends in Allergic Conditions Among Children: United States, 1997-2011 Data Brief 1–8 (NCHS, 2013). - PubMed
    1. Strachan DP. Hay fever, hygiene, and household size. Br. Med. J. 1989;299:1259–1260. doi: 10.1136/bmj.299.6710.1259. - DOI - PMC - PubMed
    1. Moneret-Vautrin DA, Morisset M, Flabbee J, Beaudouin E, Kanny G. Epidemiology of life-threatening and lethal anaphylaxis: a review. Allergy. 2005;60:443–451. doi: 10.1111/j.1398-9995.2005.00785.x. - DOI - PubMed

Publication types