. 2023 Jul 26;43(30):5483-5500.
doi: 10.1523/JNEUROSCI.0251-23.2023. Epub 2023 Jul 12.

Delaying the GABA Shift Indirectly Affects Membrane Properties in the Developing Hippocampus

Affiliations

Delaying the GABA Shift Indirectly Affects Membrane Properties in the Developing Hippocampus

Carlijn Peerboom et al. J Neurosci. .

Abstract

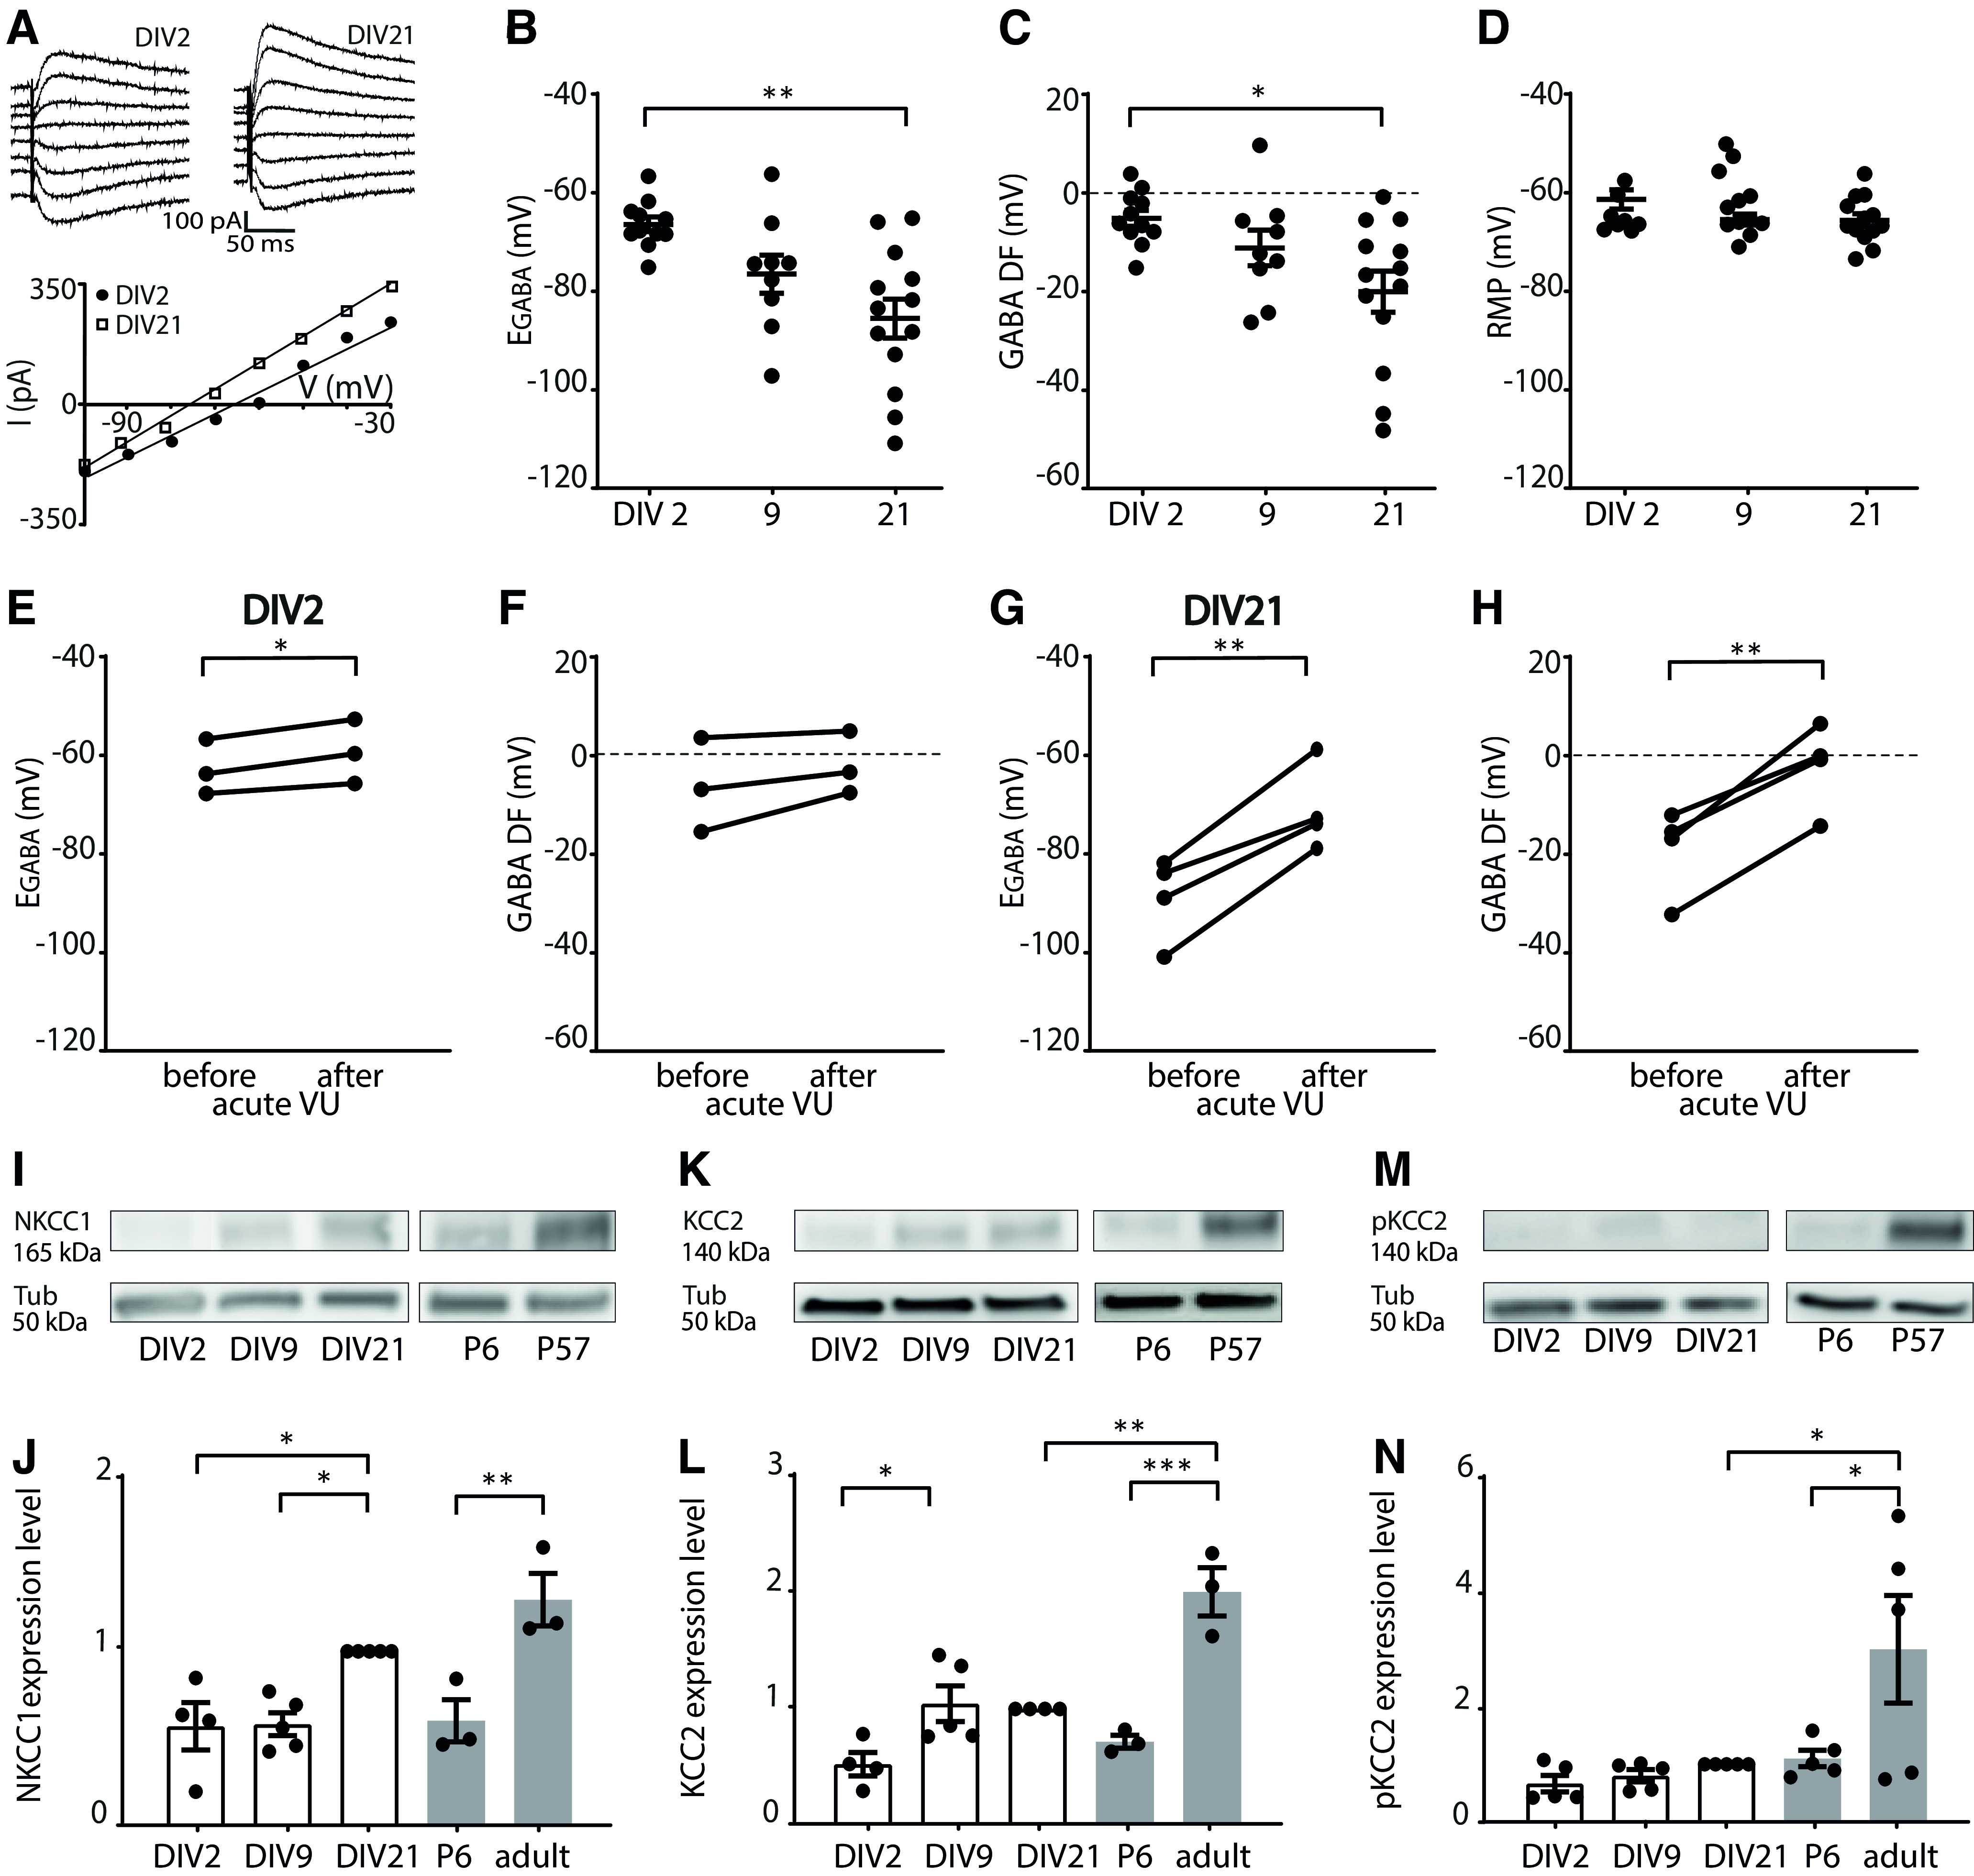
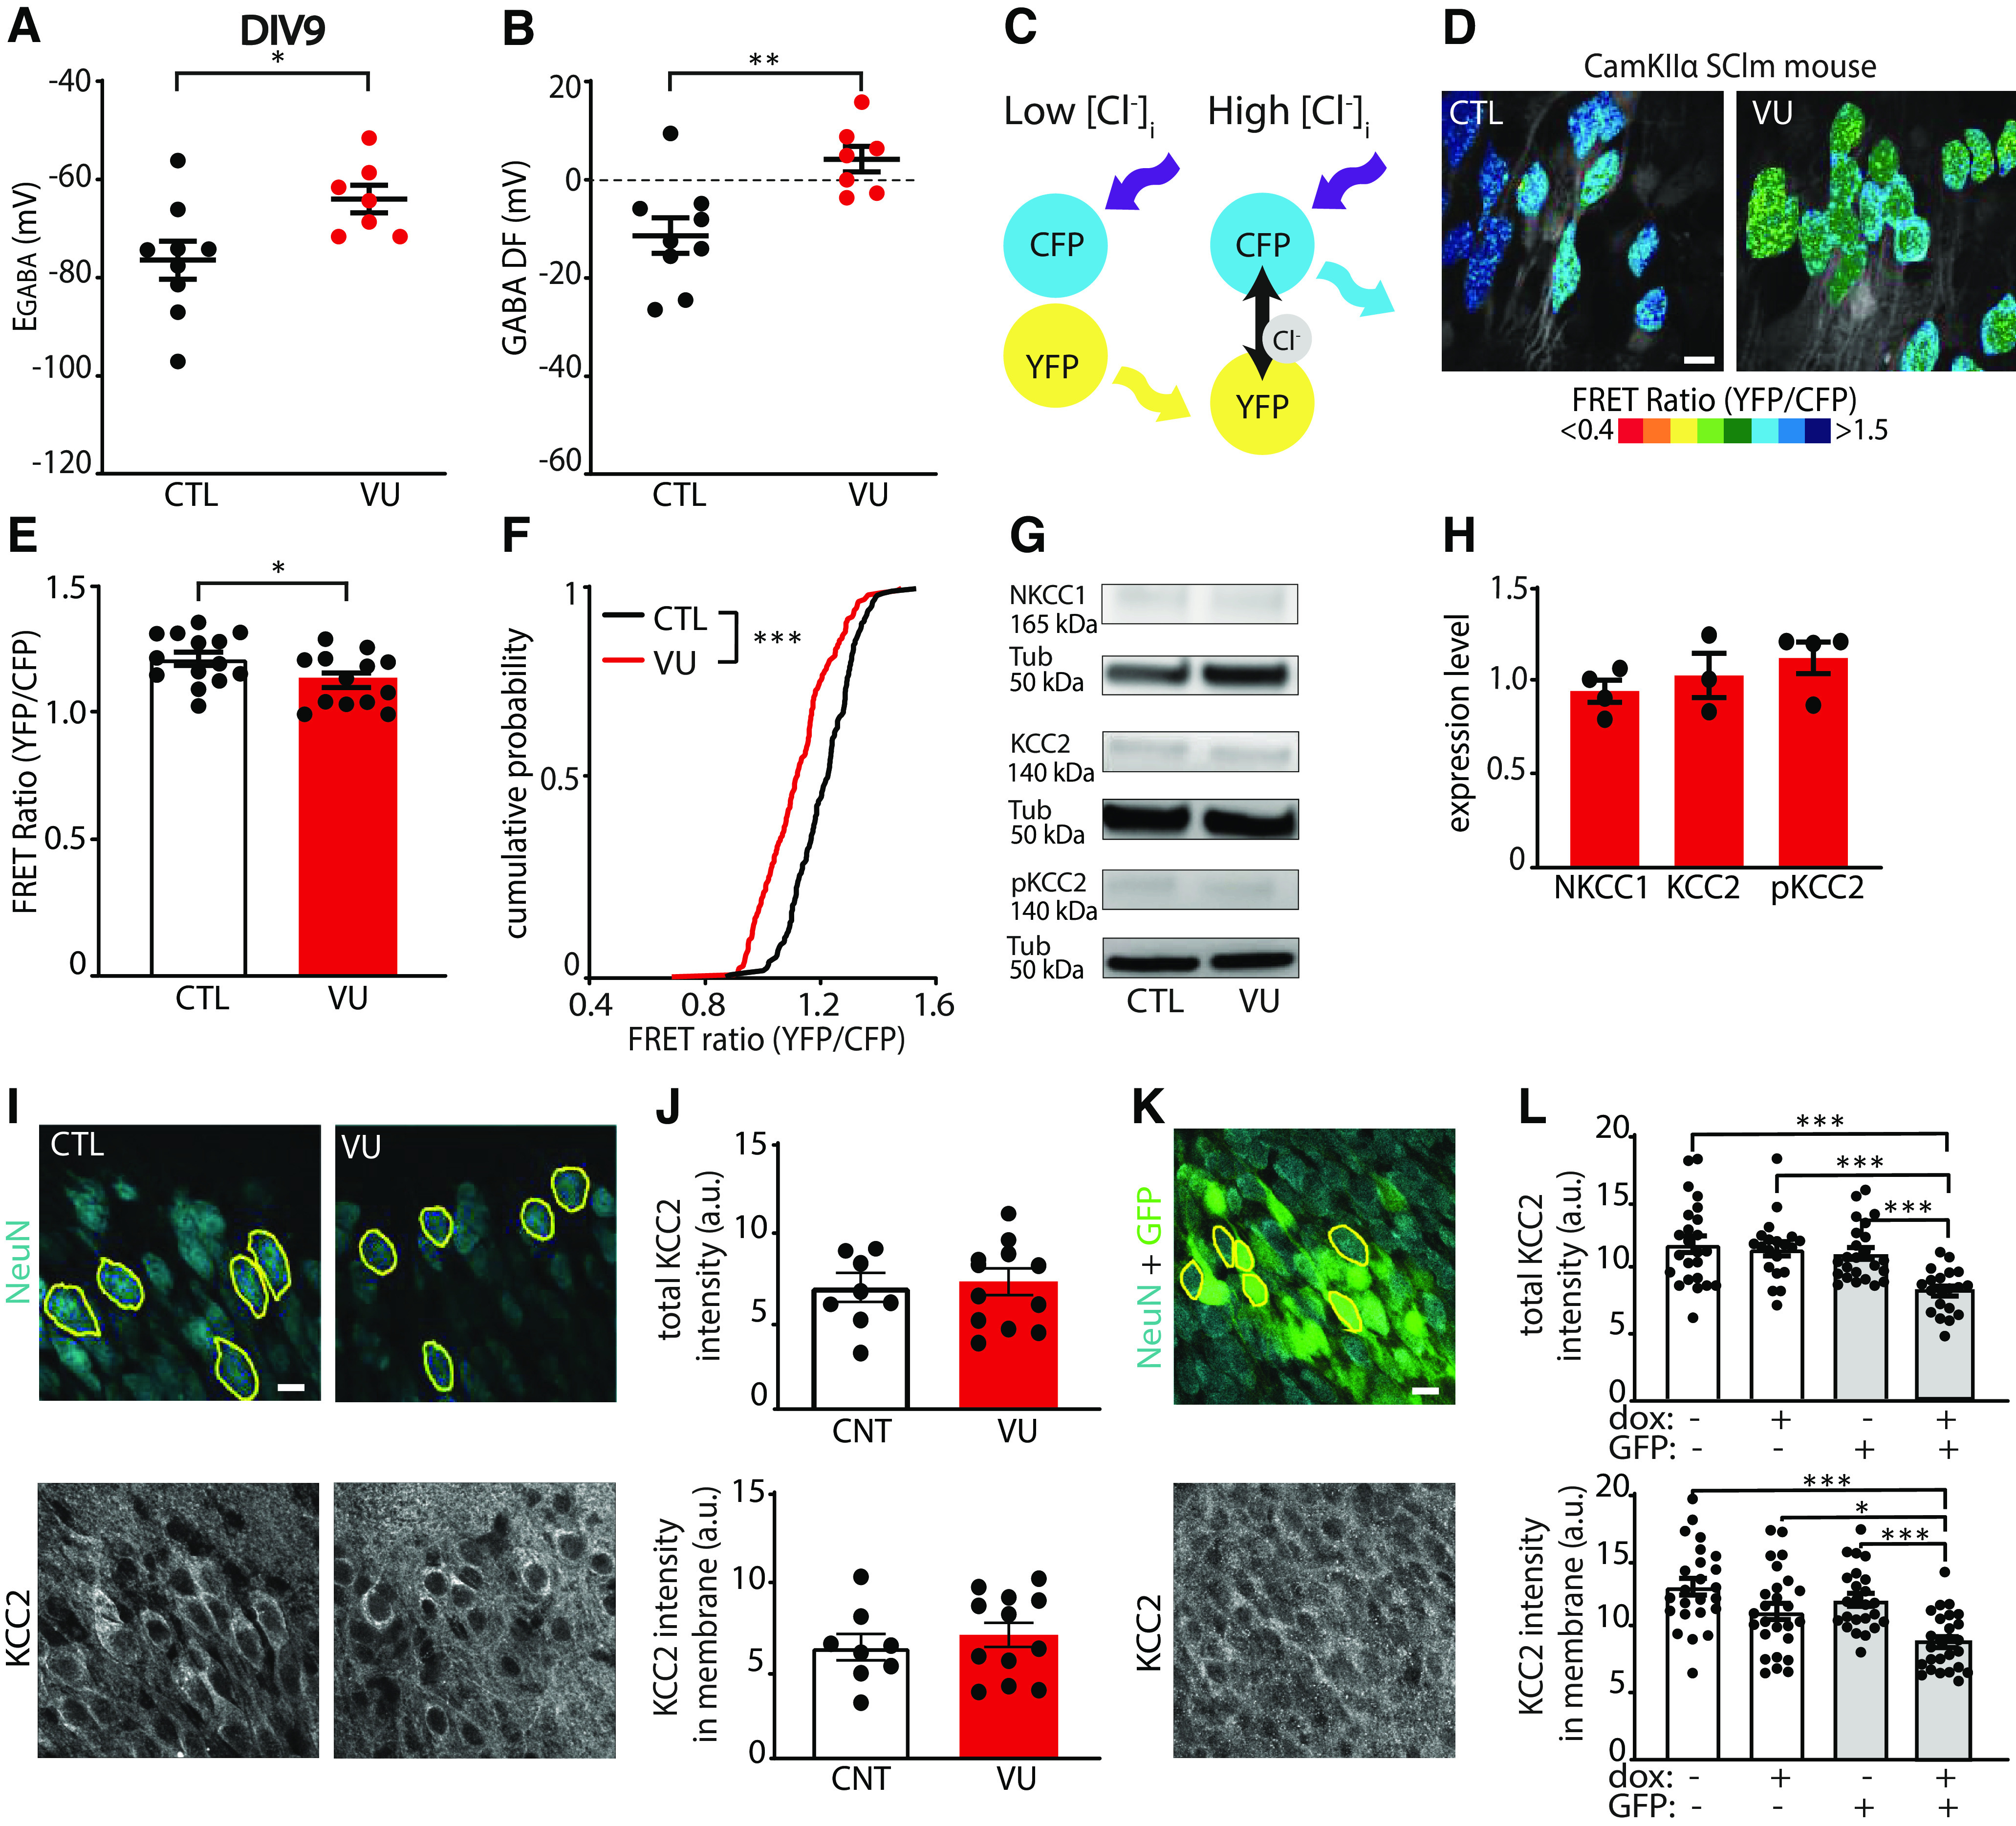
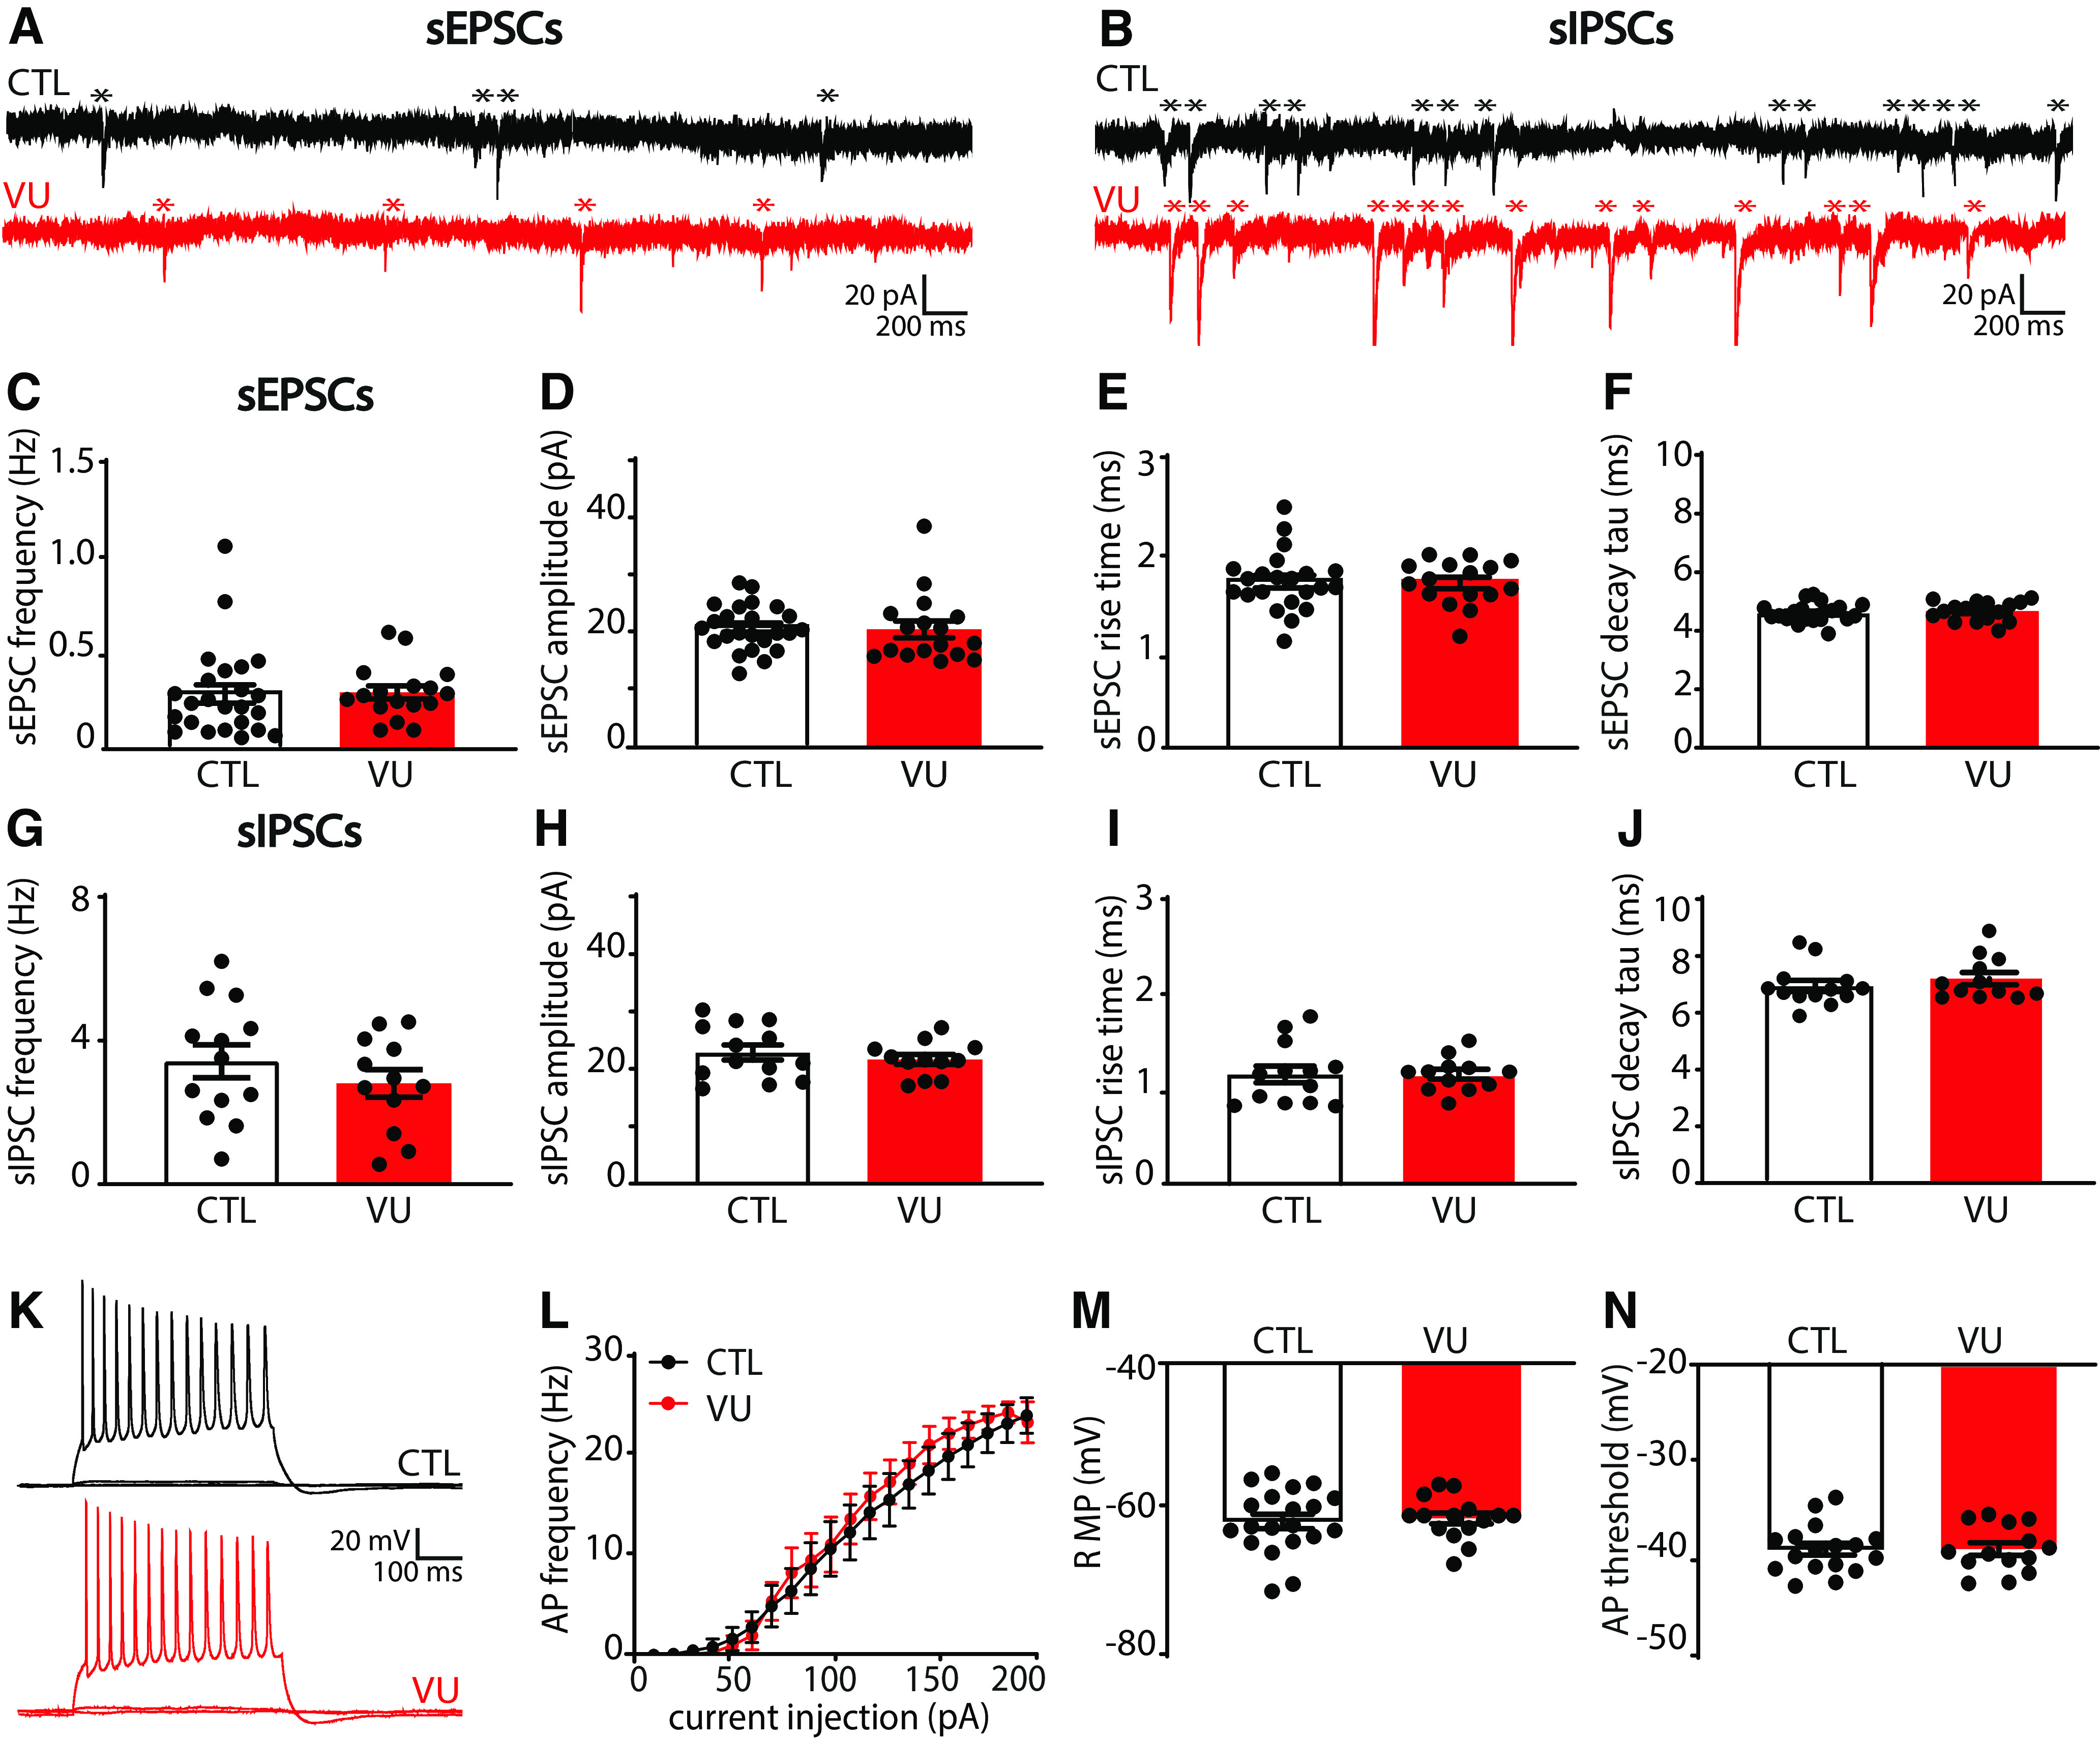
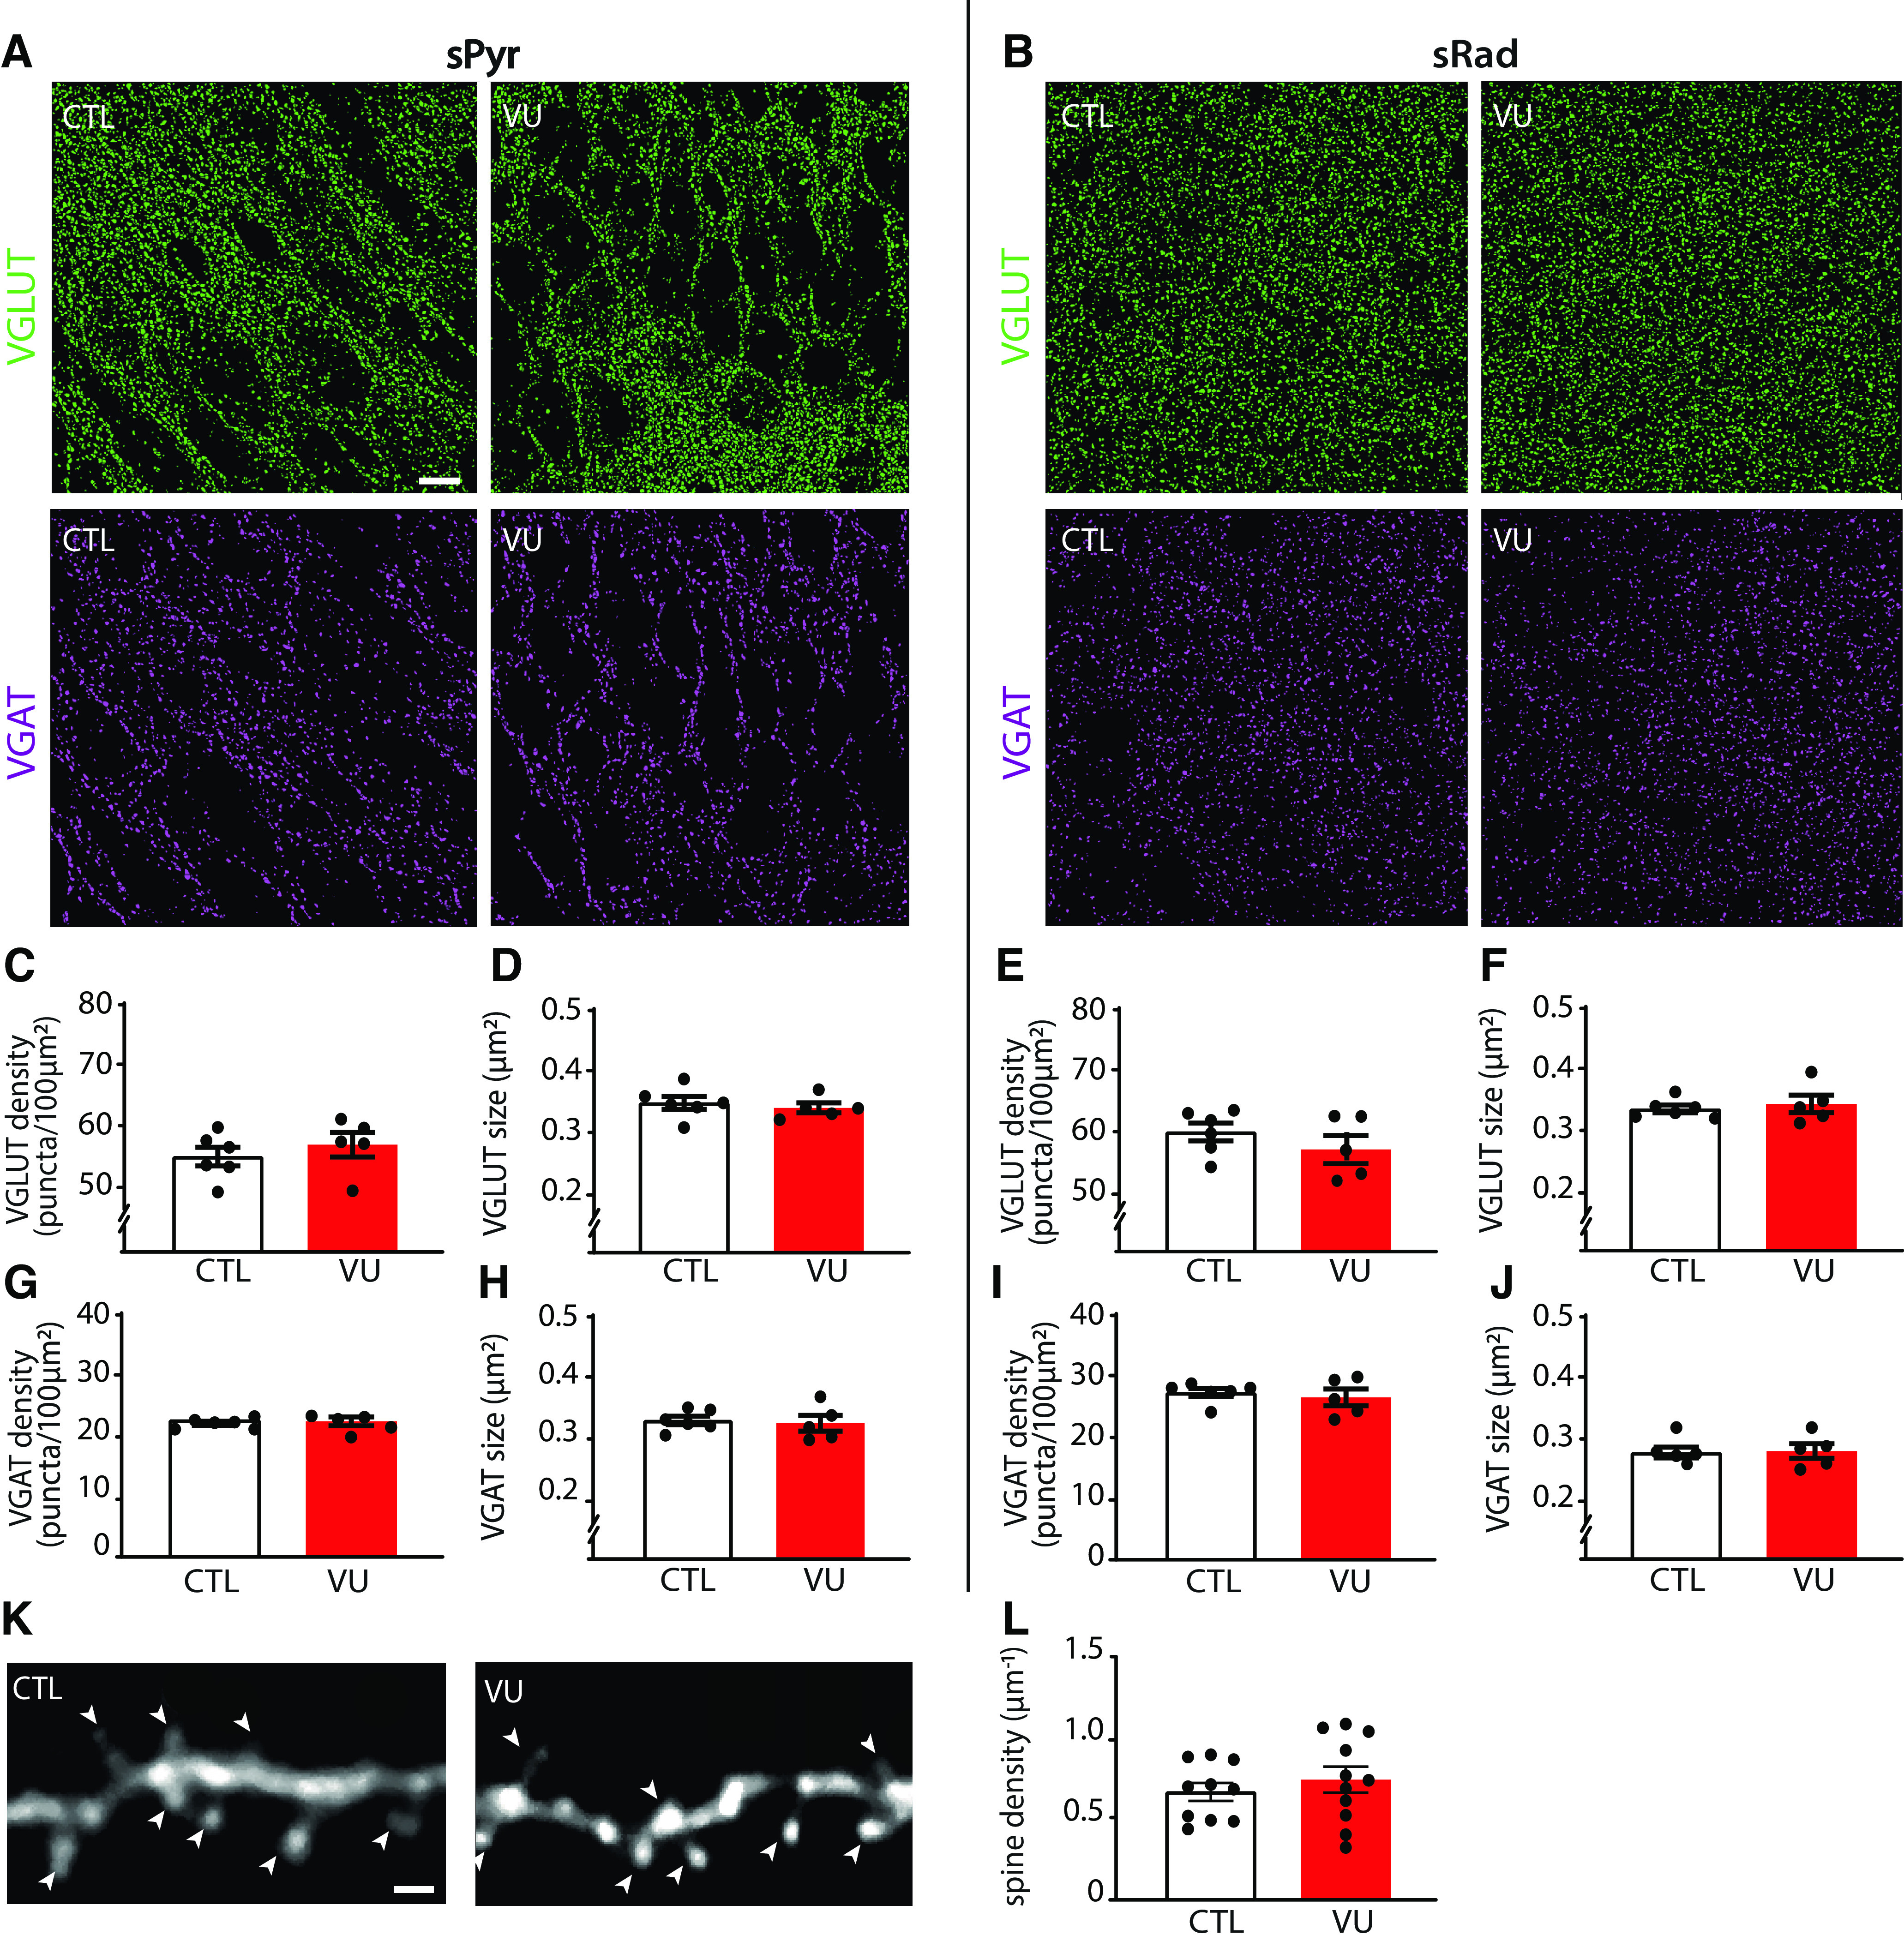
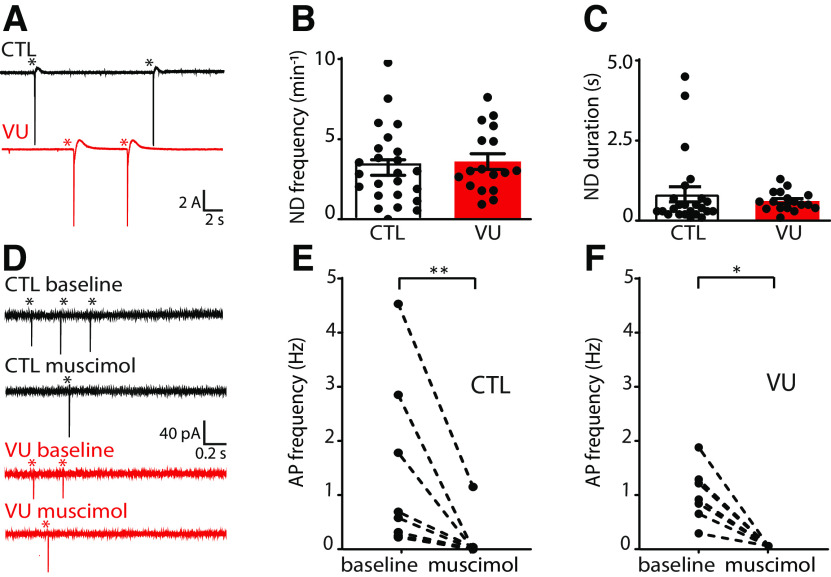
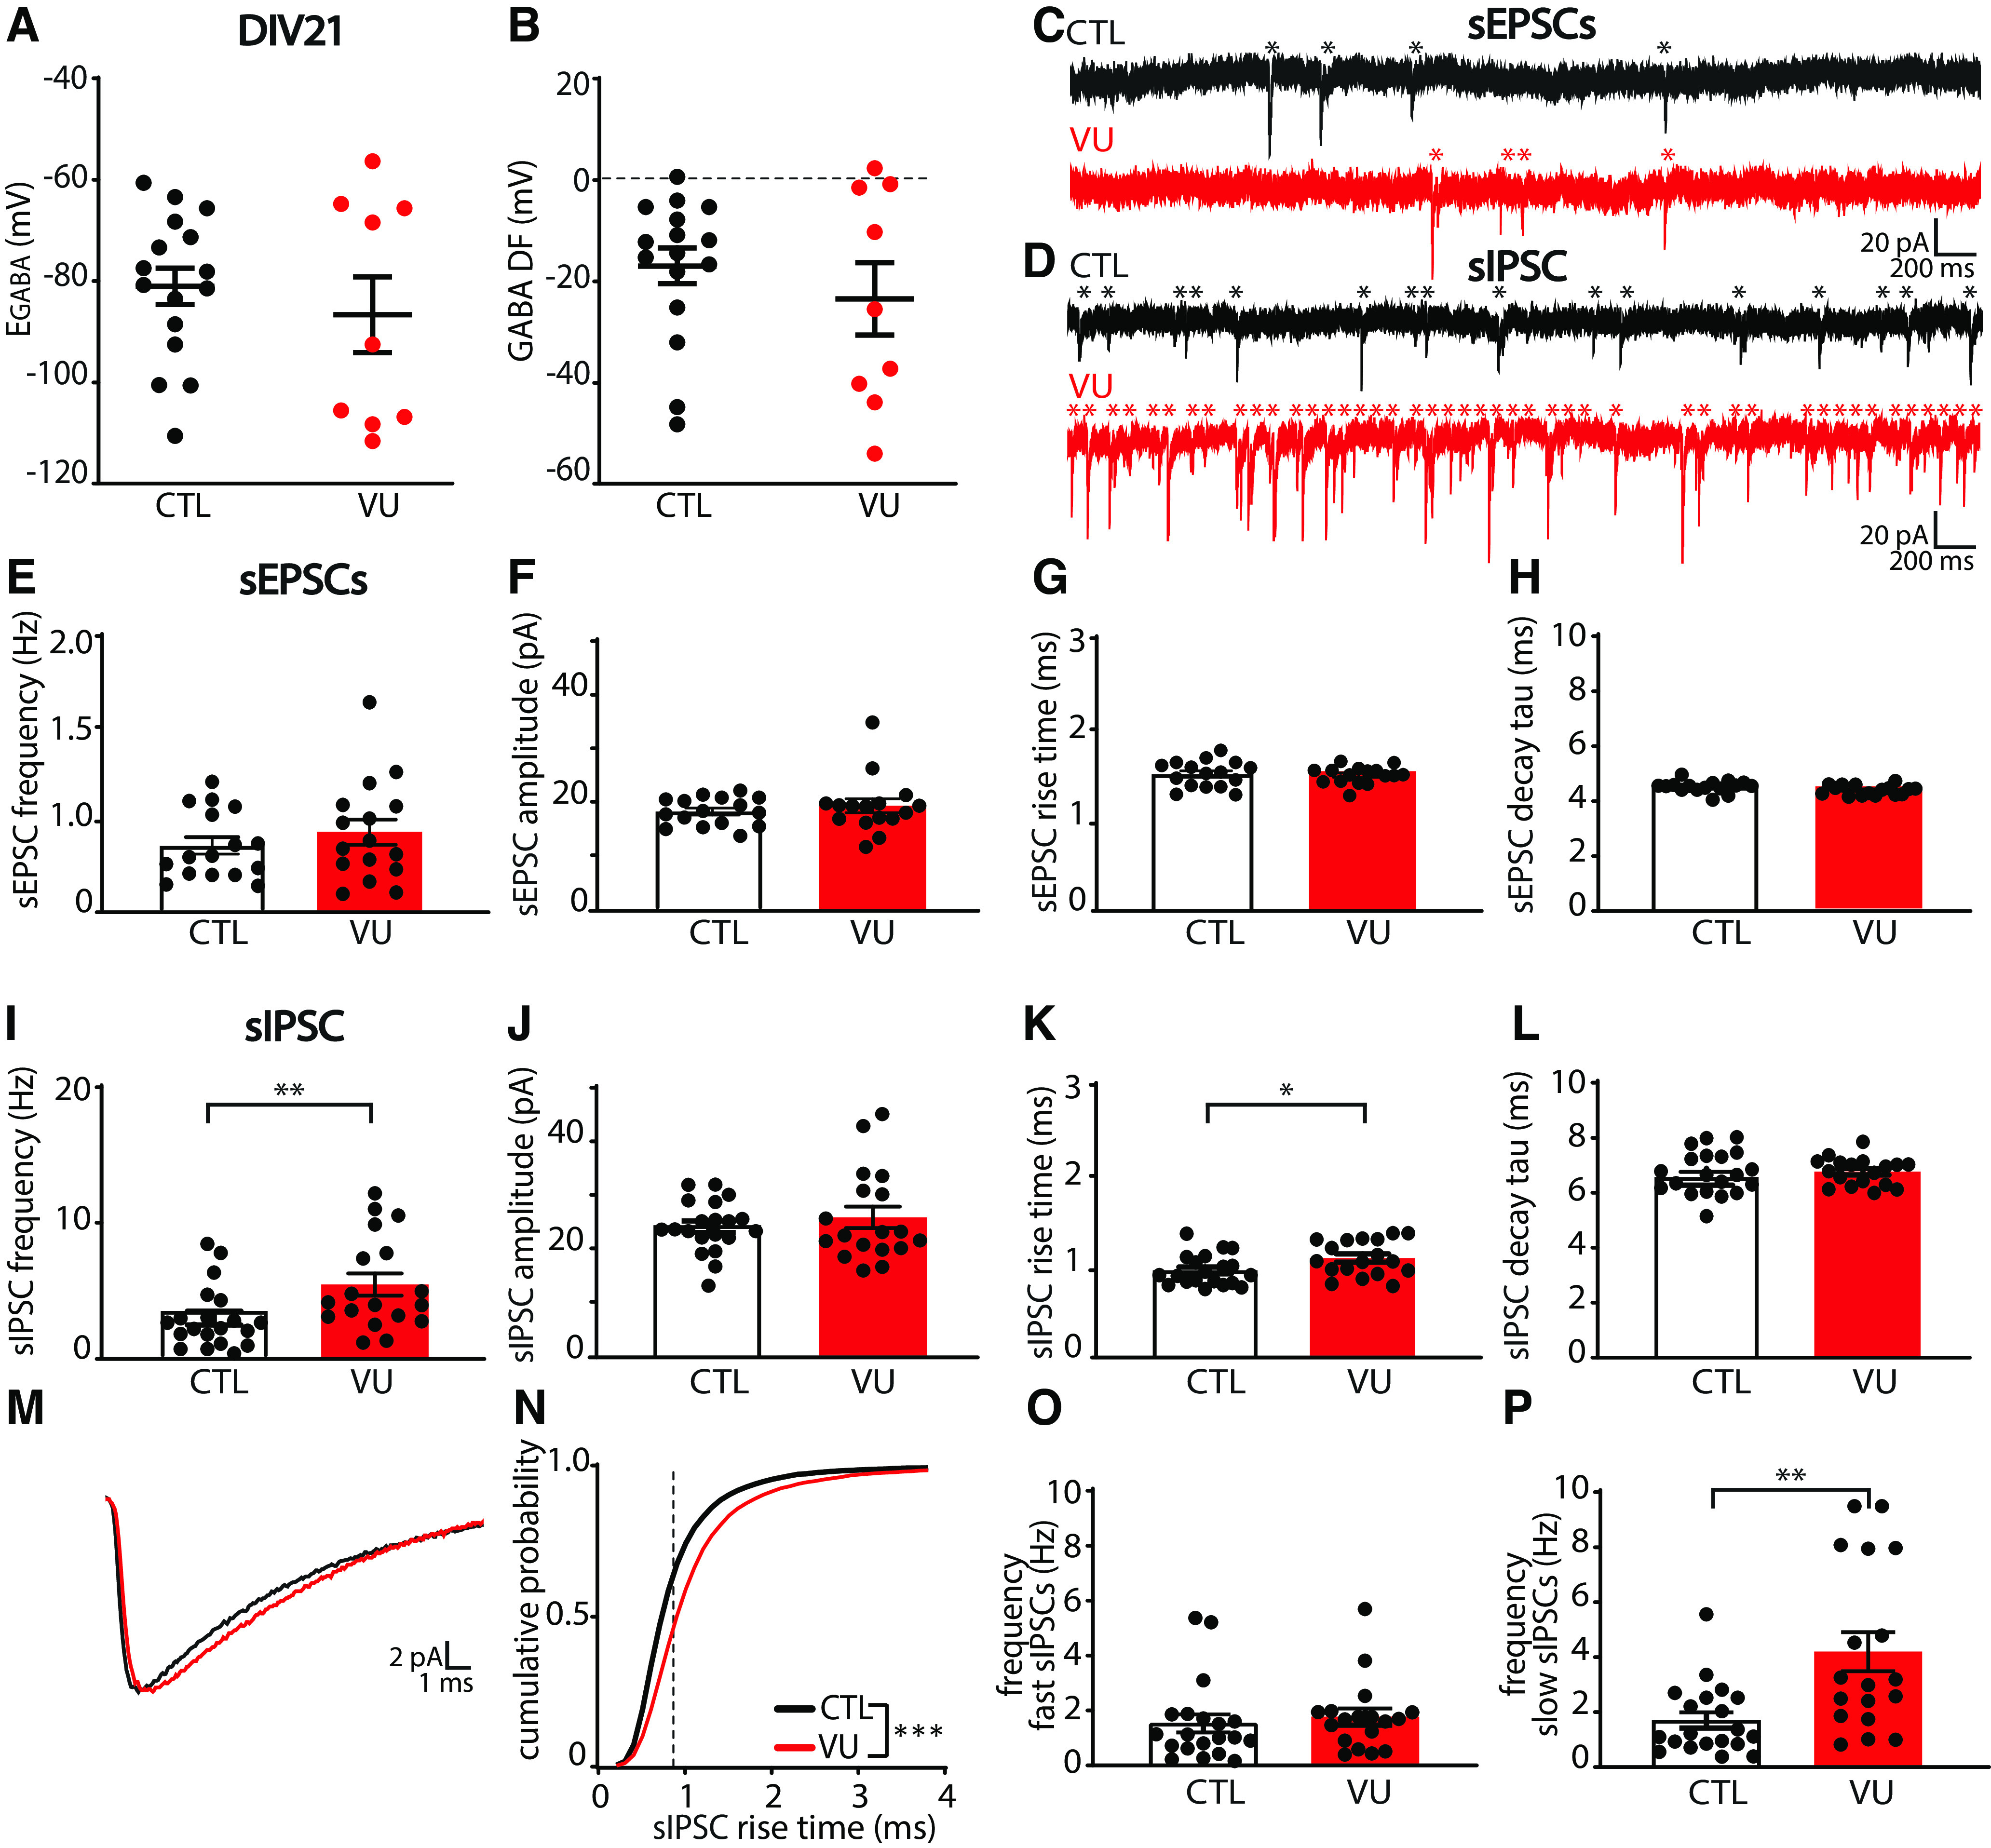
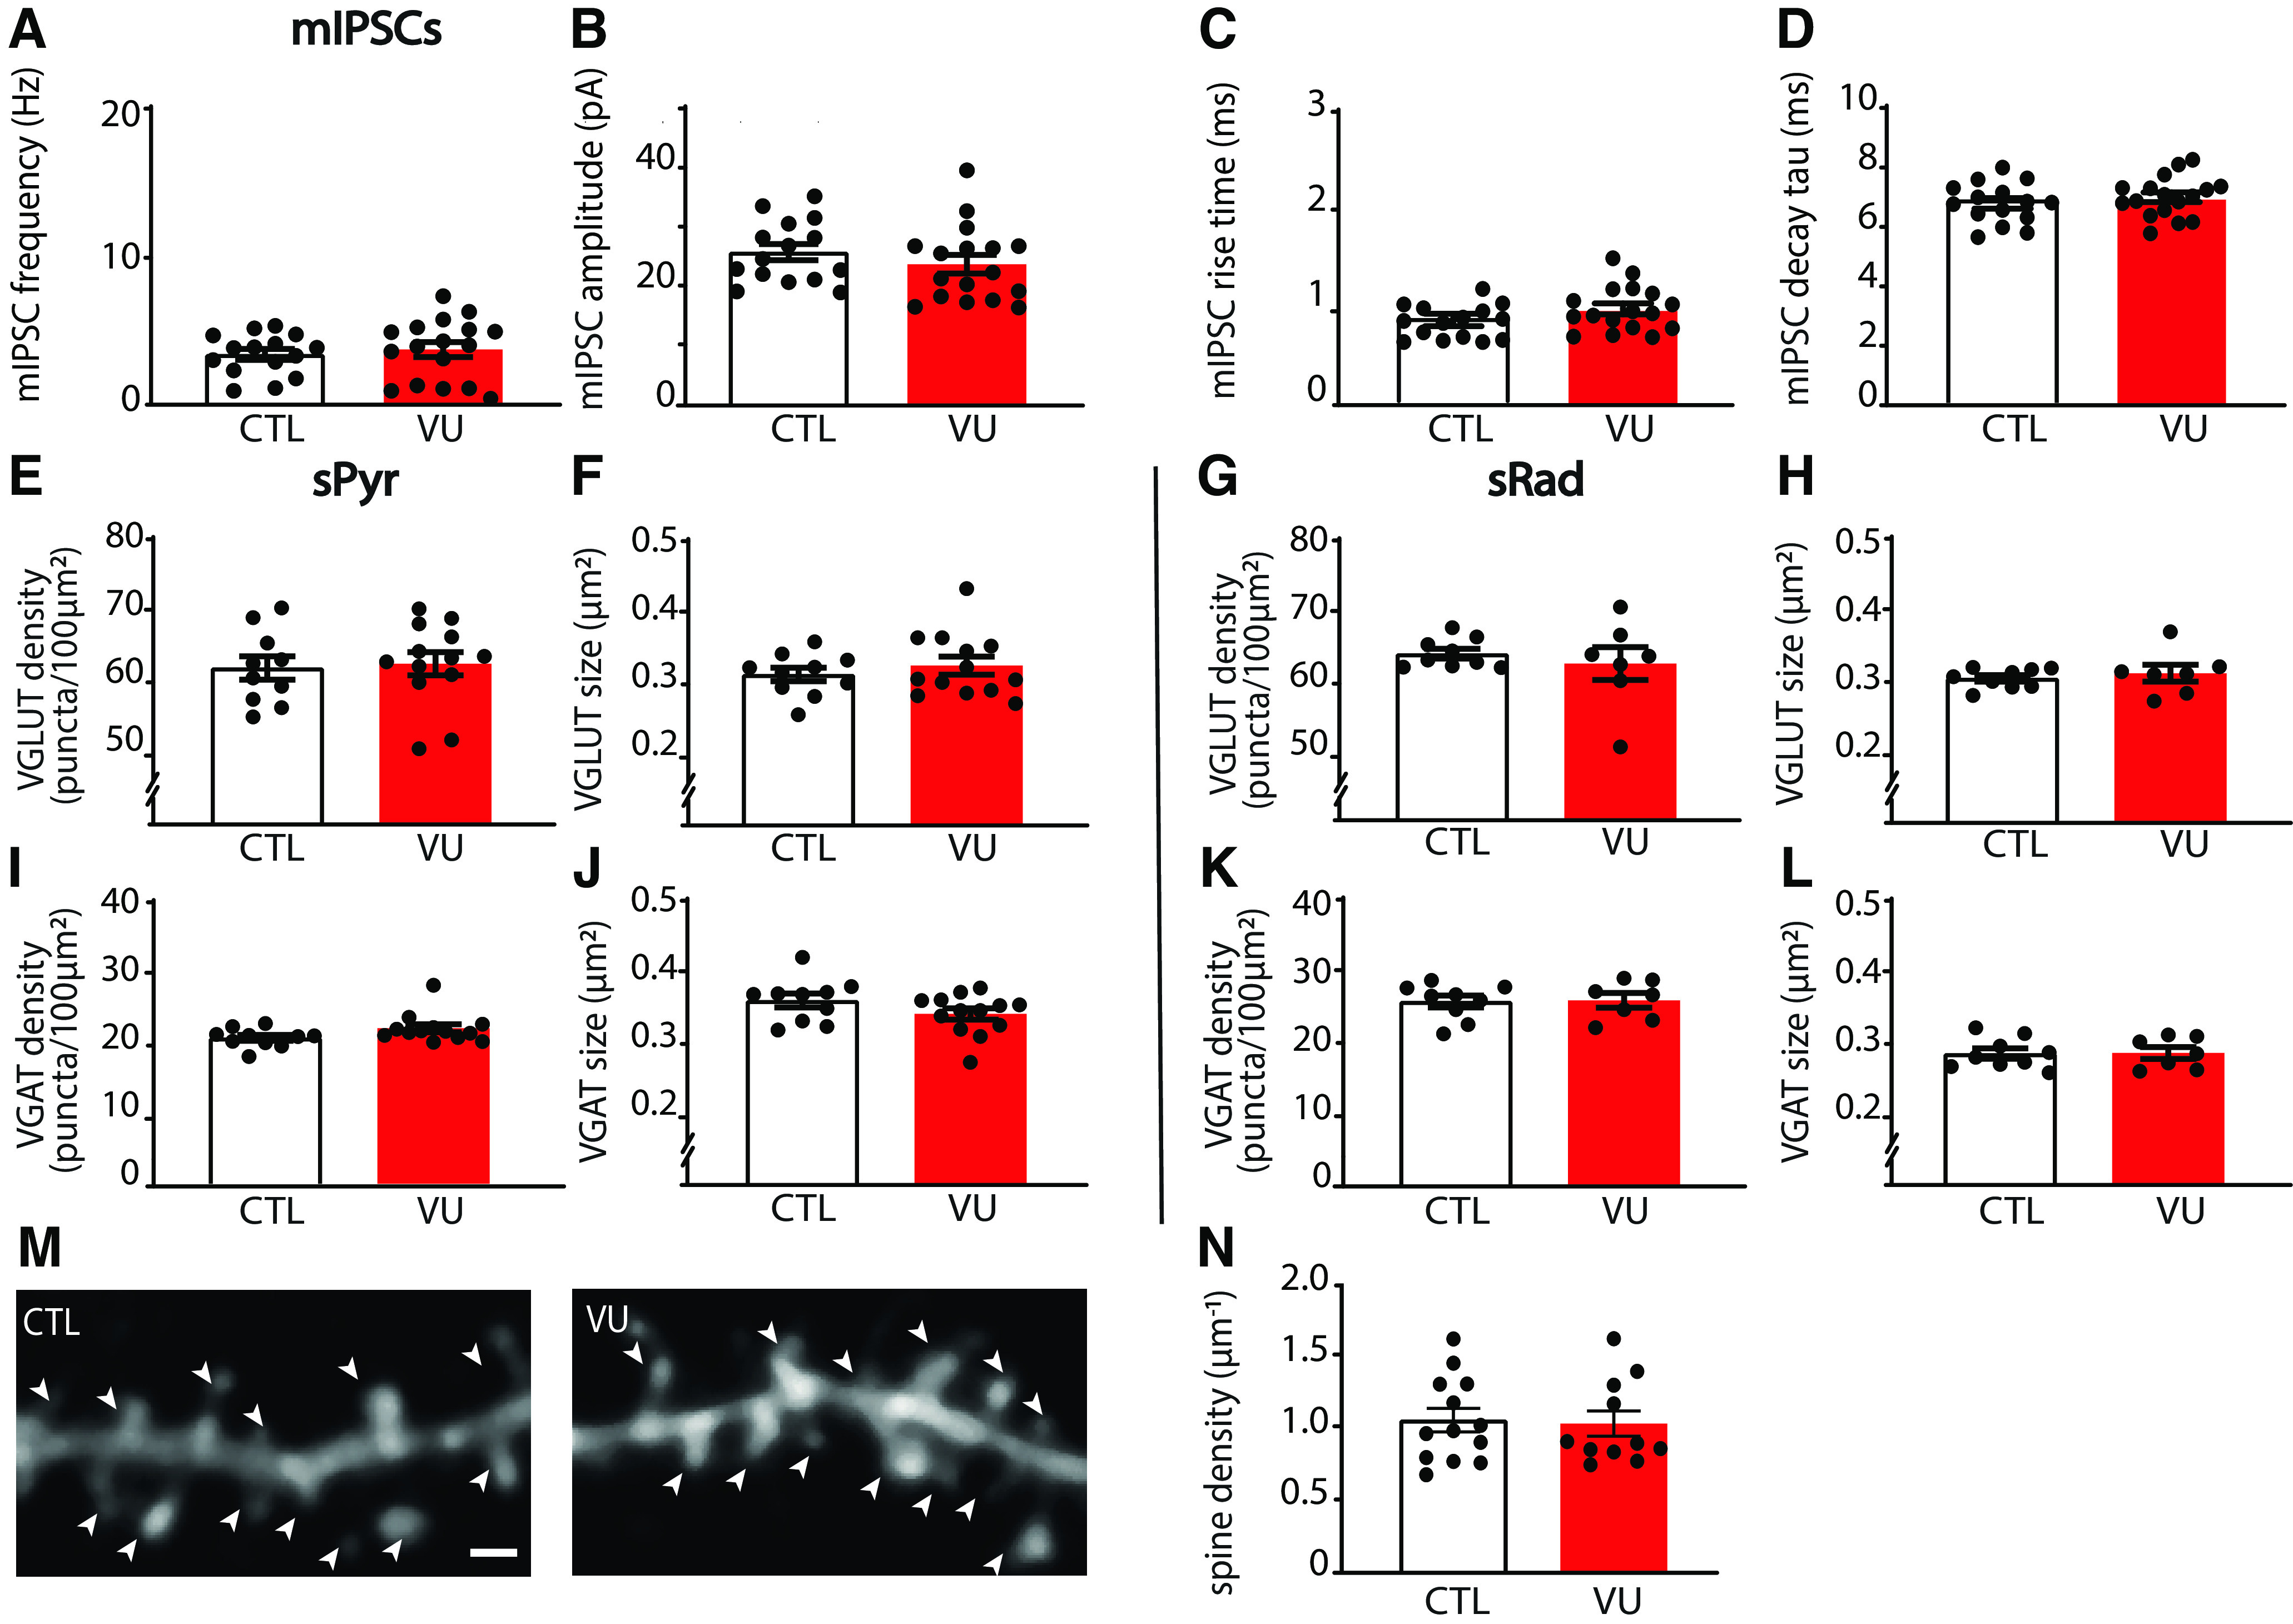
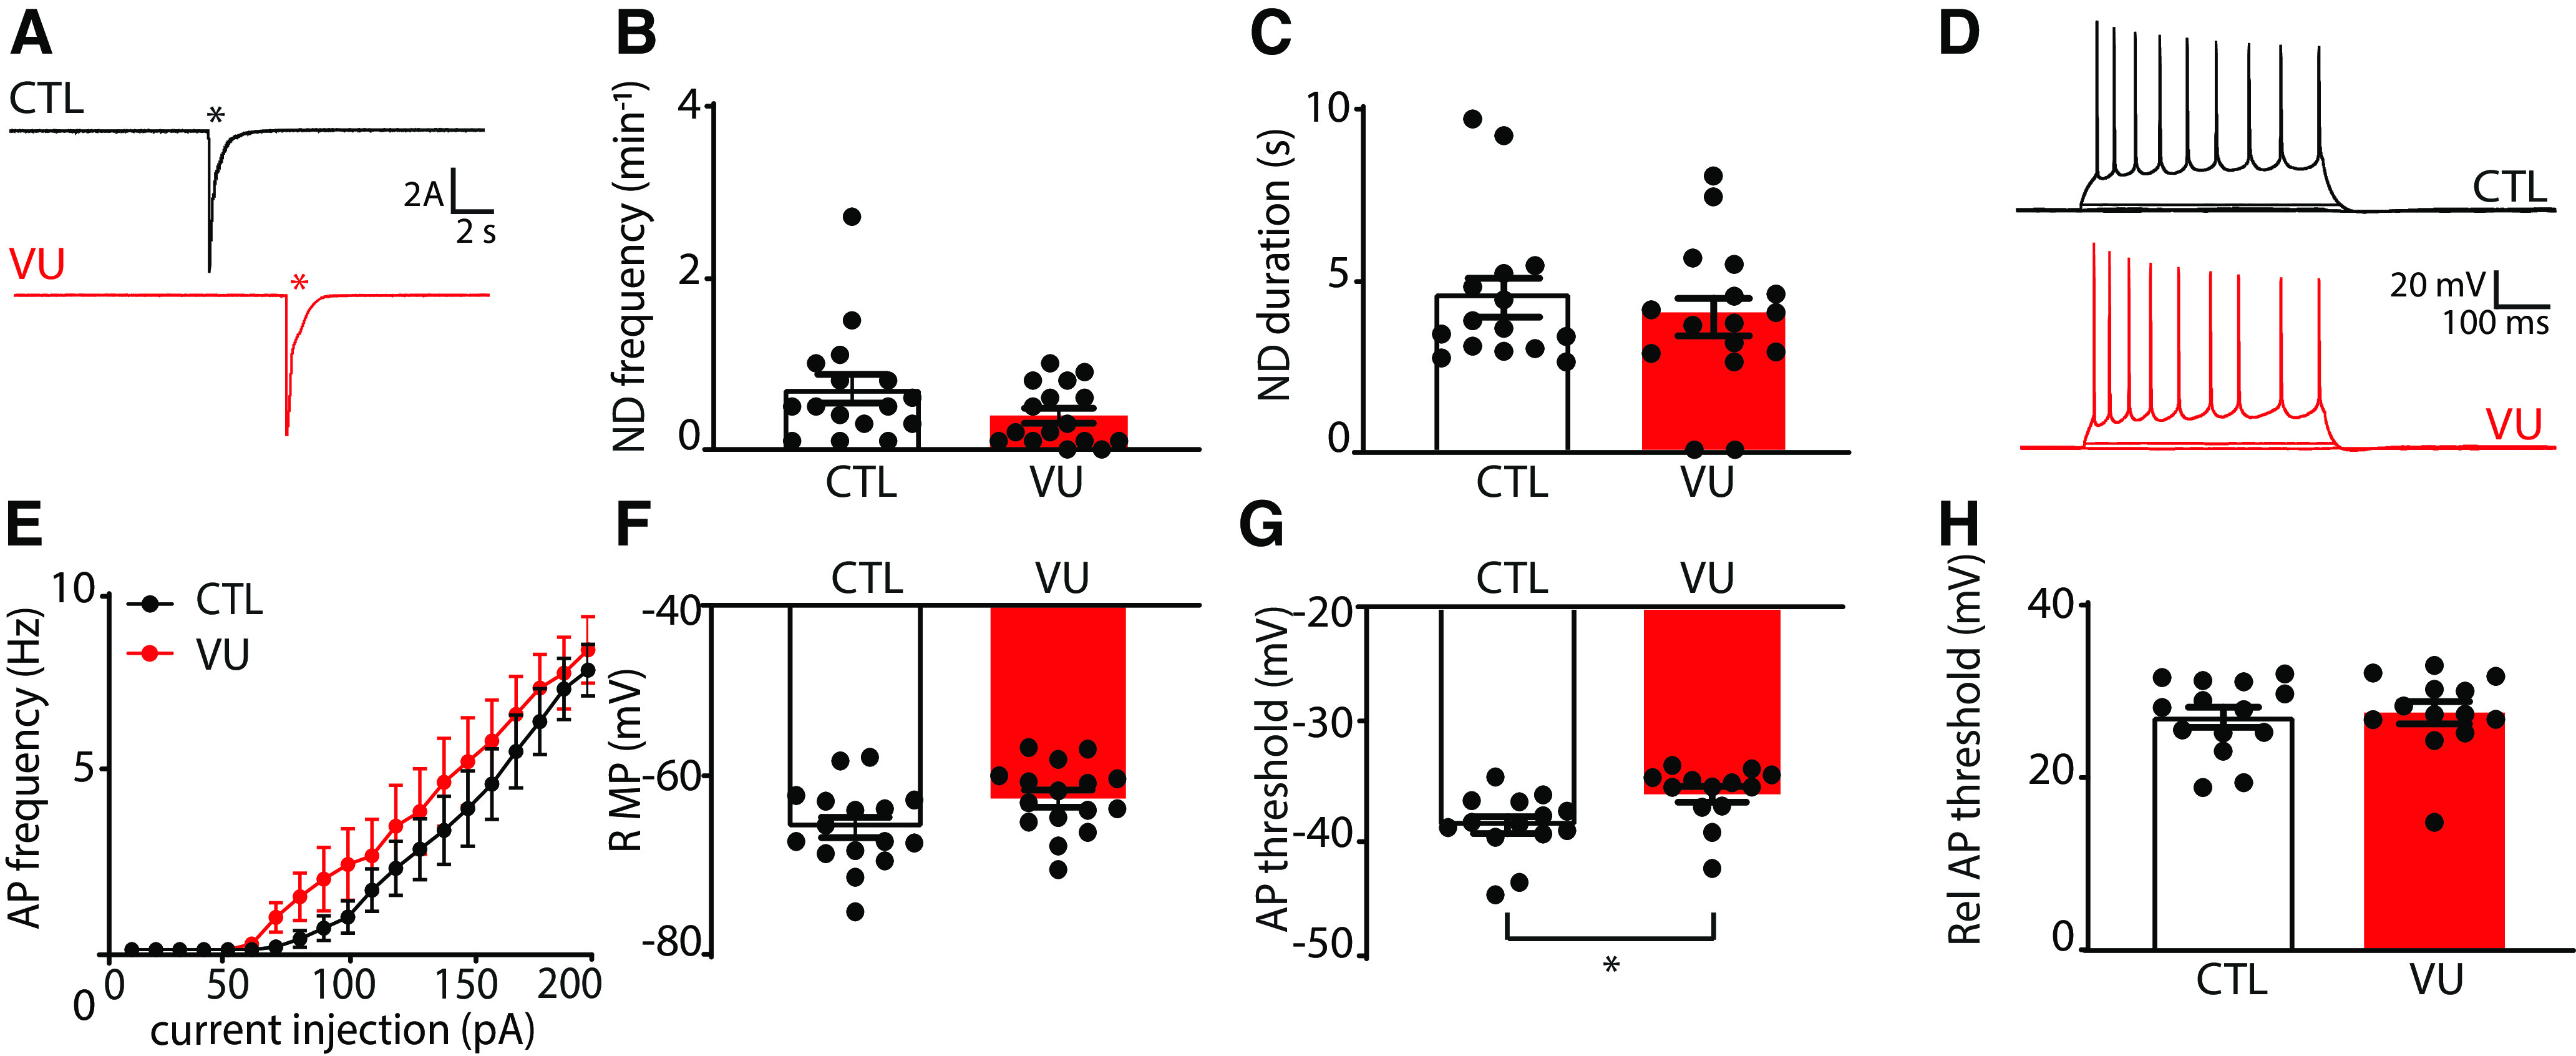
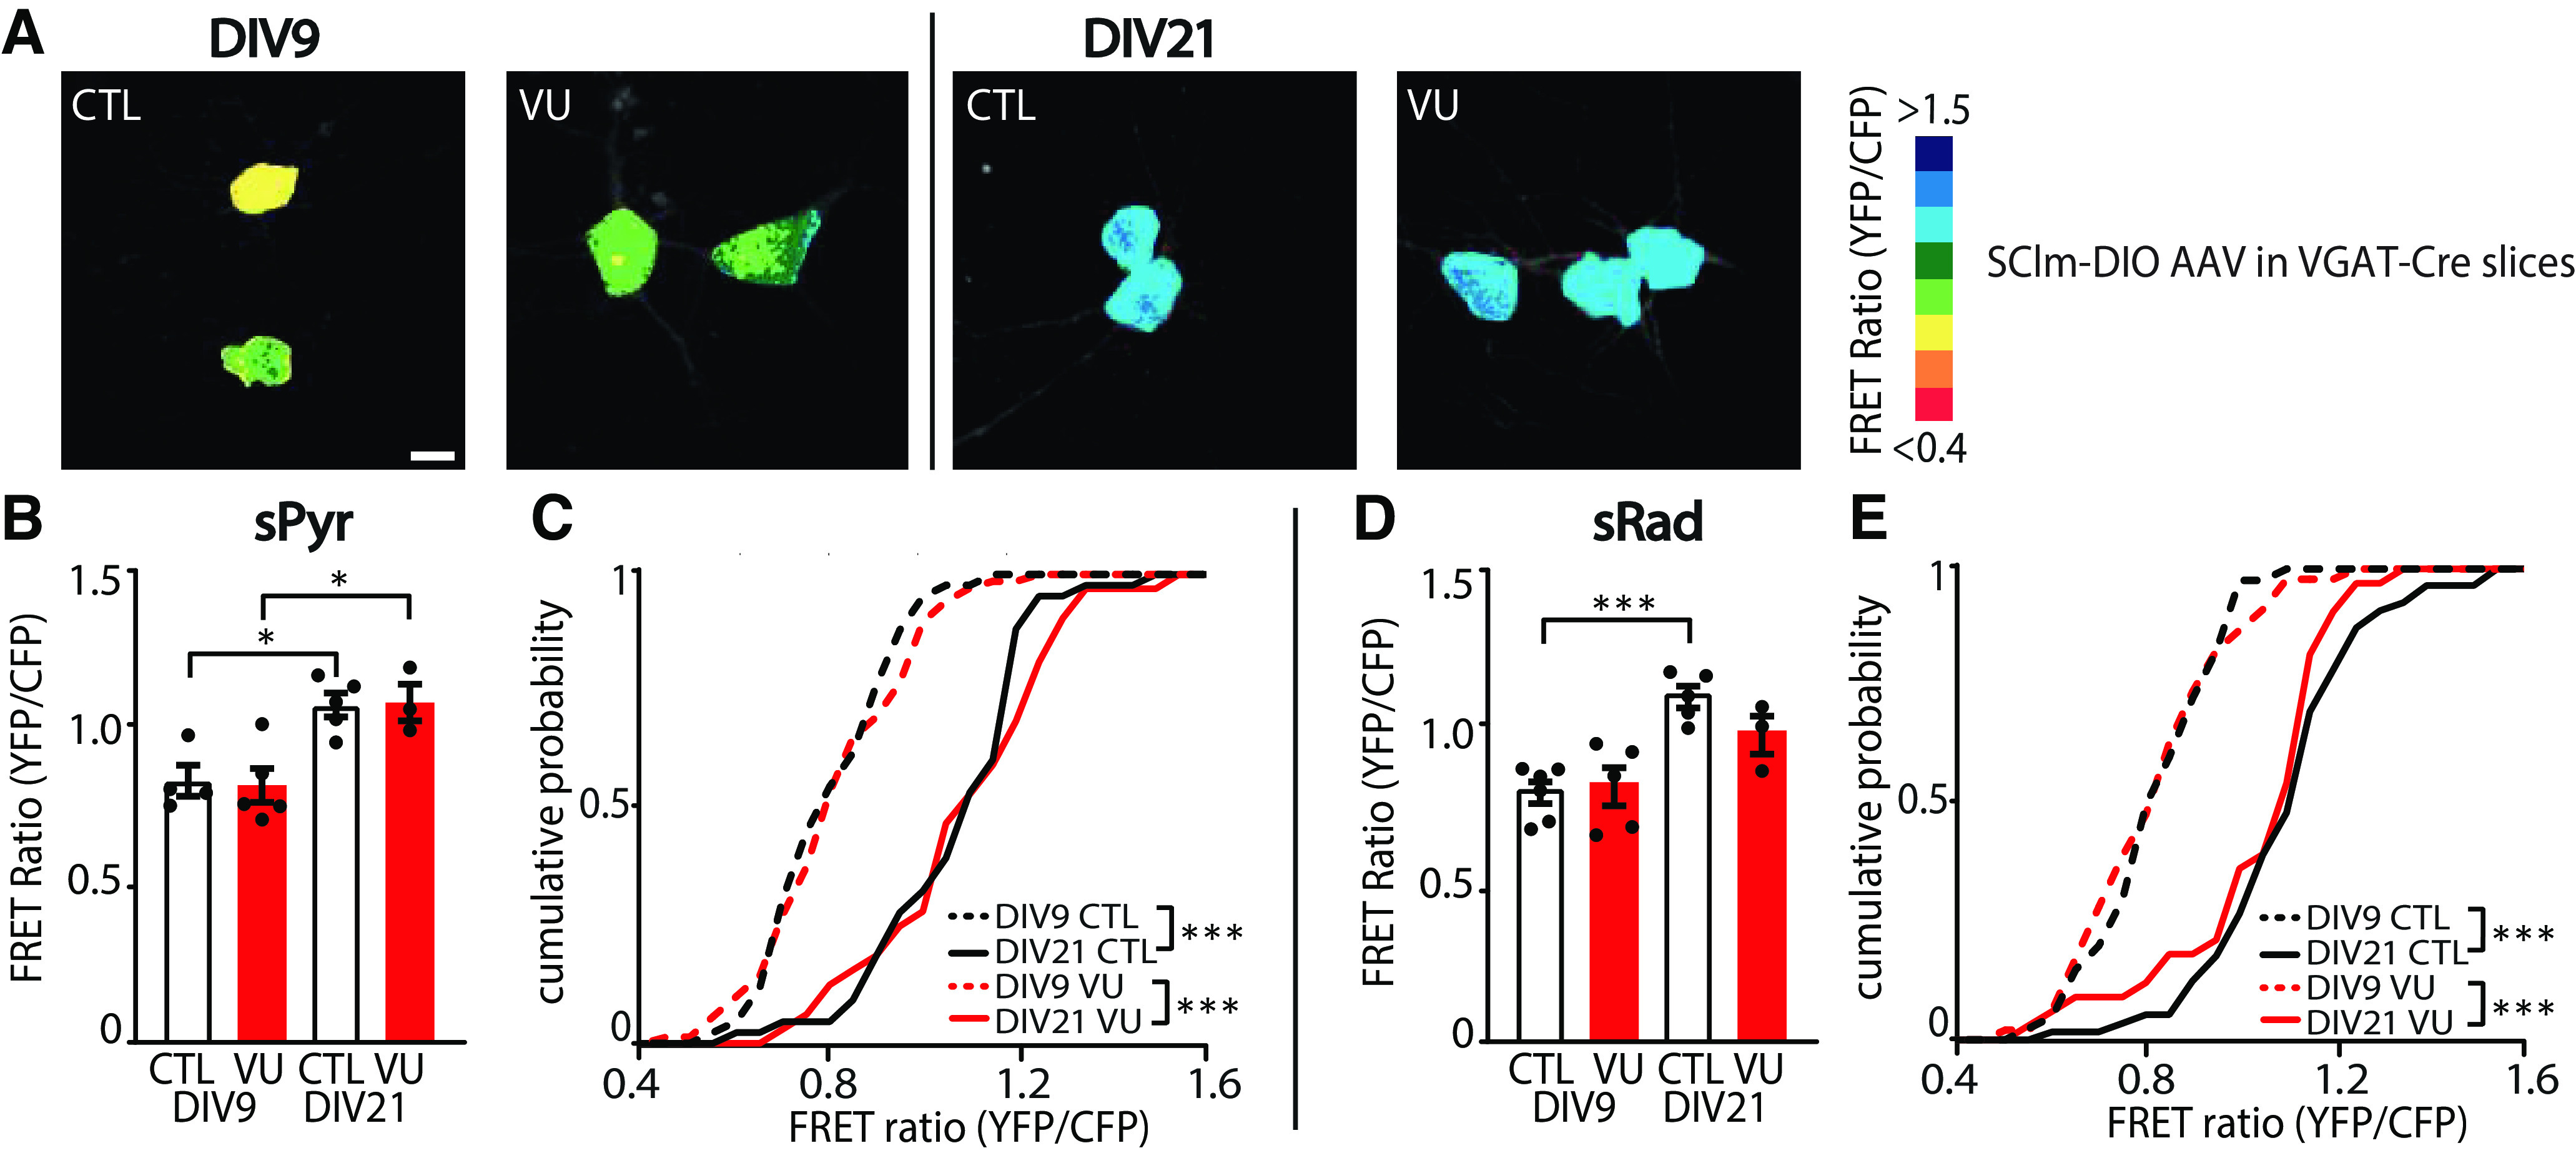
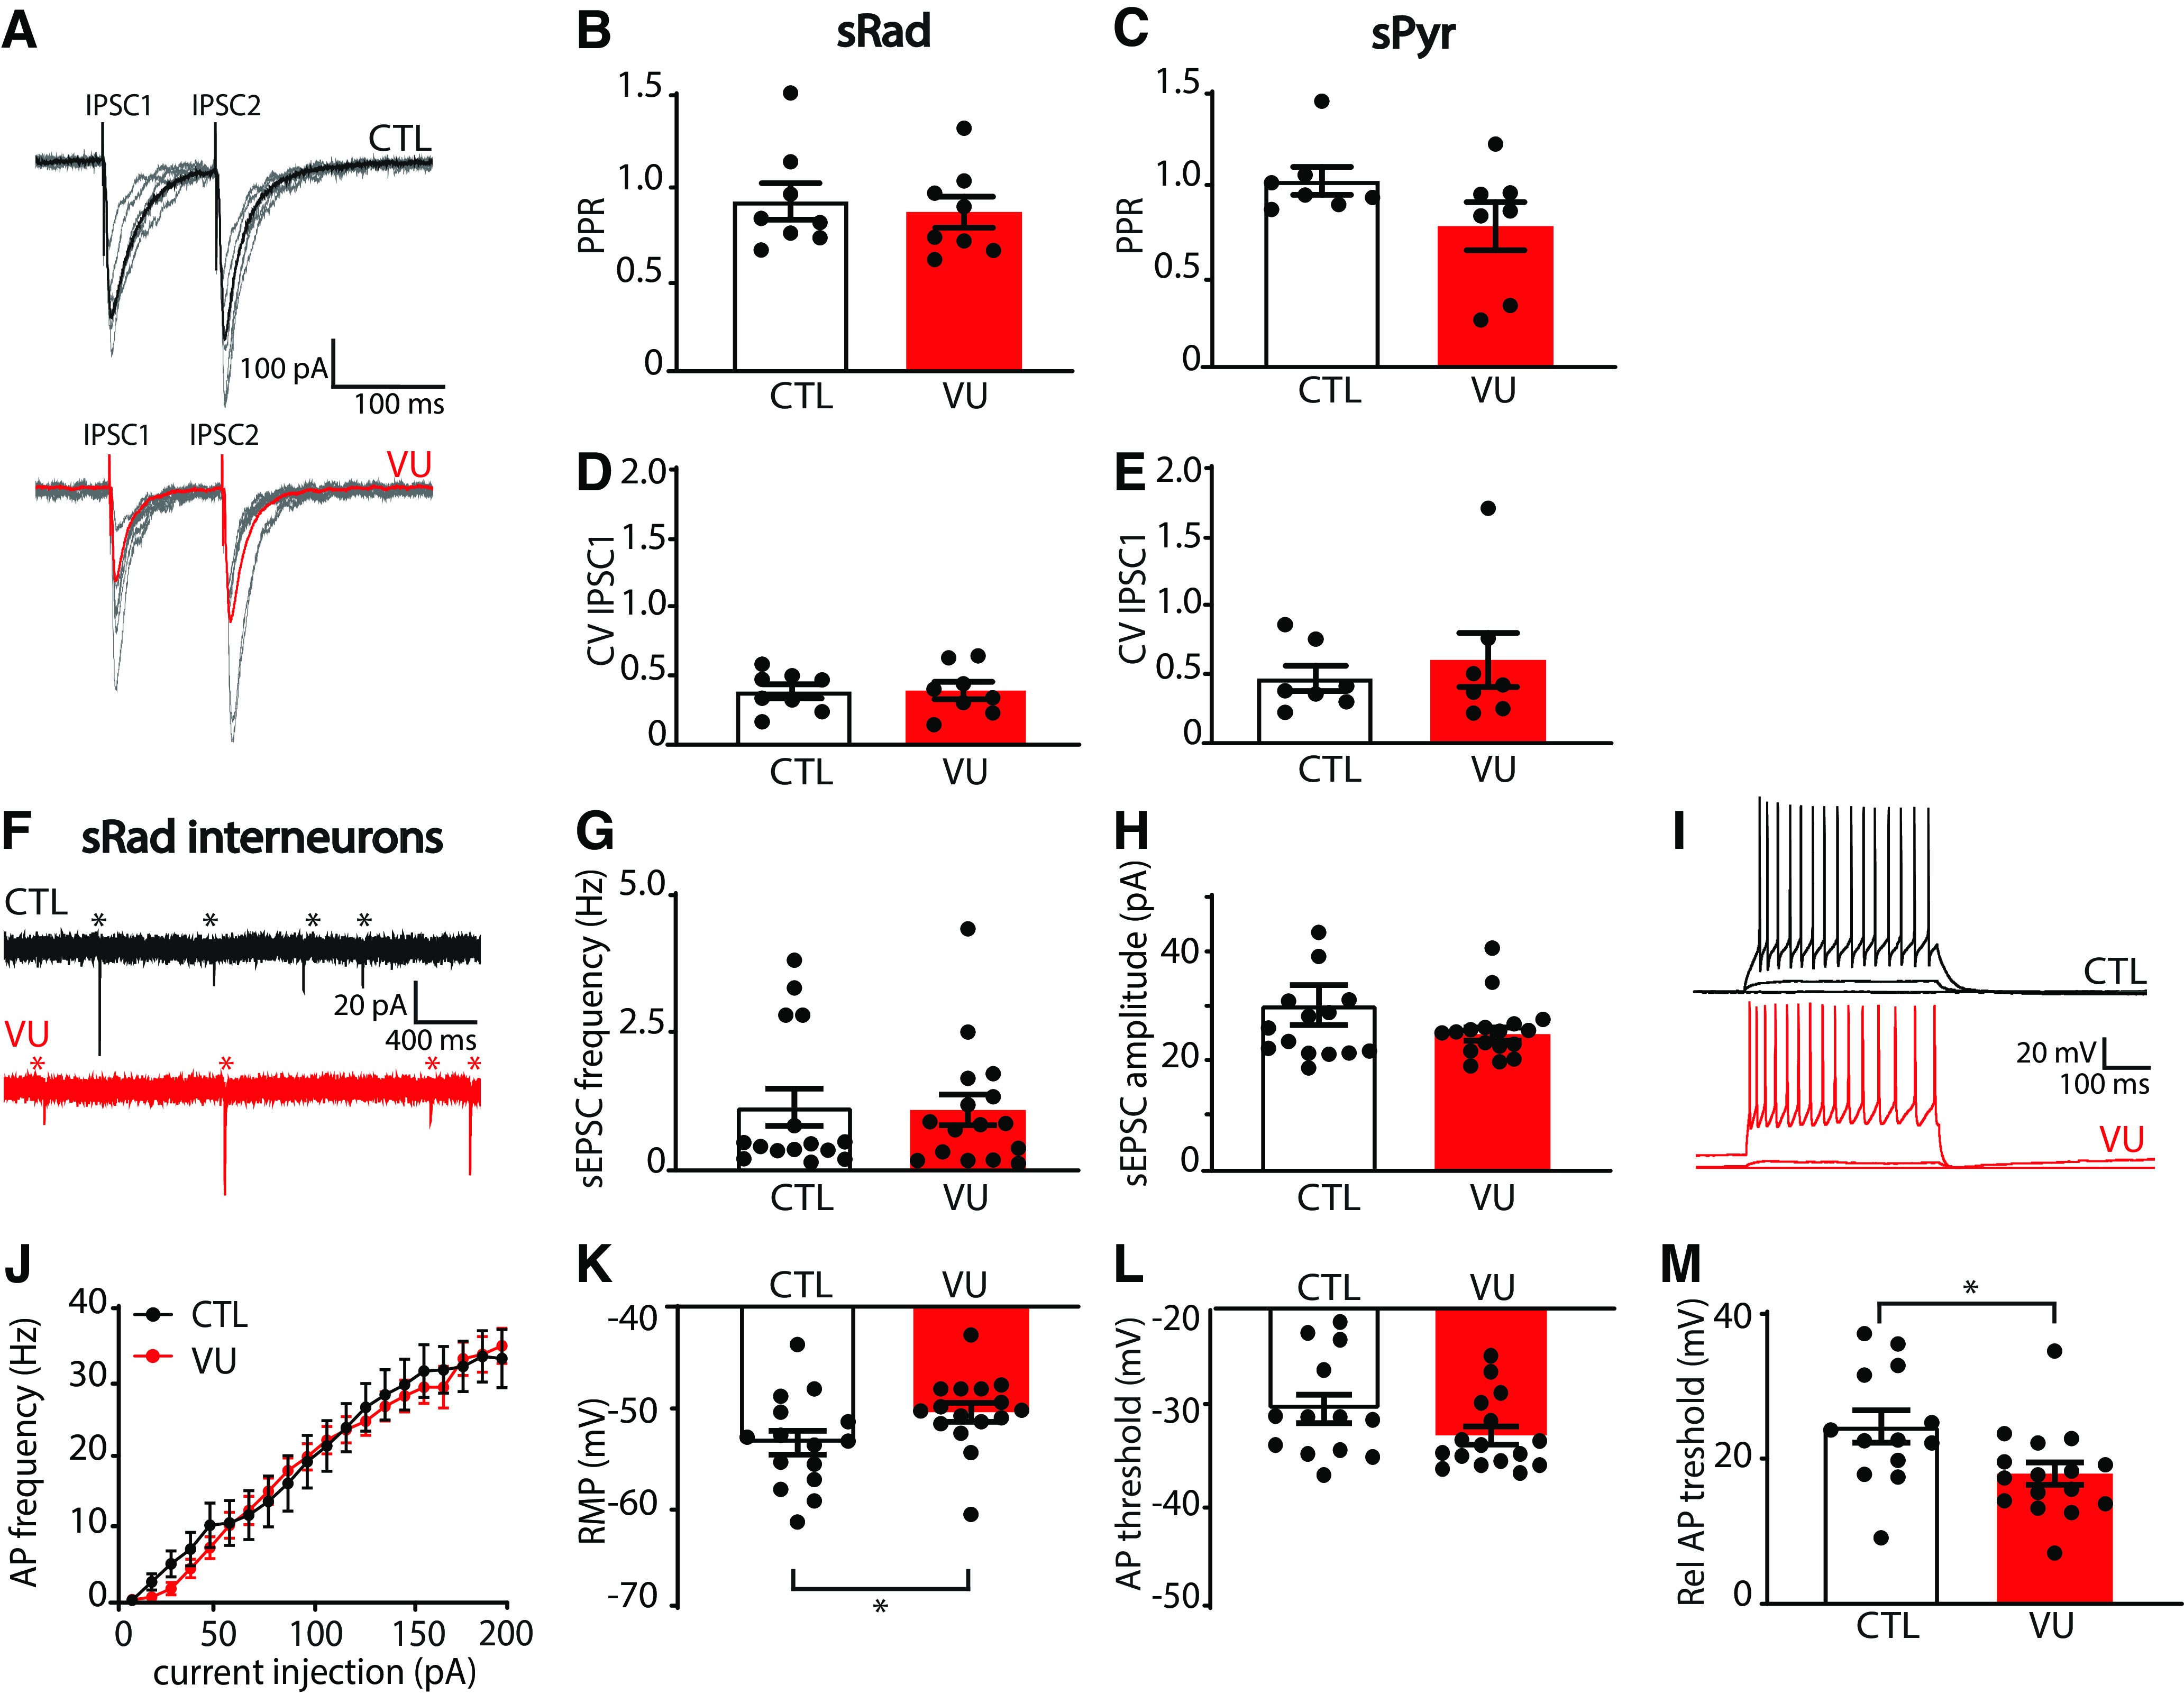
During the first two postnatal weeks, intraneuronal chloride concentrations in rodents gradually decrease, causing a shift from depolarizing to hyperpolarizing GABA responses. The postnatal GABA shift is delayed in rodent models for neurodevelopmental disorders and in human patients, but the impact of a delayed GABA shift on the developing brain remains obscure. Here we examine the direct and indirect consequences of a delayed postnatal GABA shift on network development in organotypic hippocampal cultures made from 6- to 7-d-old mice by treating the cultures for 1 week with VU0463271, a specific inhibitor of the chloride exporter KCC2. We verified that VU treatment delayed the GABA shift and kept GABA signaling depolarizing until DIV9. We found that the structural and functional development of excitatory and inhibitory synapses at DIV9 was not affected after VU treatment. In line with previous studies, we observed that GABA signaling was already inhibitory in control and VU-treated postnatal slices. Surprisingly, 14 d after the VU treatment had ended (DIV21), we observed an increased frequency of spontaneous inhibitory postsynaptic currents in CA1 pyramidal cells, while excitatory currents were not changed. Synapse numbers and release probability were unaffected. We found that dendrite-targeting interneurons in the stratum radiatum had an elevated resting membrane potential, while pyramidal cells were less excitable compared with control slices. Our results show that depolarizing GABA signaling does not promote synapse formation after P7, and suggest that postnatal intracellular chloride levels indirectly affect membrane properties in a cell-specific manner.SIGNIFICANCE STATEMENT During brain development, the action of neurotransmitter GABA shifts from depolarizing to hyperpolarizing. This shift is a thought to play a critical role in synapse formation. A delayed shift is common in rodent models for neurodevelopmental disorders and in human patients, but its consequences for synaptic development remain obscure. Here, we delayed the GABA shift by 1 week in organotypic hippocampal cultures and carefully examined the consequences for circuit development. We find that delaying the shift has no direct effects on synaptic development, but instead leads to indirect, cell type-specific changes in membrane properties. Our data call for careful assessment of alterations in cellular excitability in neurodevelopmental disorders.

Keywords: brain development; chloride; homeostasis; membrane excitability; neurodevelopmental disorders; synapse formation.


Figures

Figure 1.
Figure 1.
GABA shift is ongoing in organotypic hippocampal slice cultures. A, Perforated patch-clamp recordings in CA1 pyramidal cells in hippocampal slice cultures at DIV2 and DIV21. Responses to muscimol application were recorded at holding potentials from −100 to −30 mV with 10 mV increments, and GABA reversal potential was determined from the intersection of the linear current–voltage curve with the x axis. B, The GABA reversal potential (EGABA) recorded in cultured slices at DIV2, DIV9, and DIV21 (KW, p = 0.019; DMC: DIV2 vs DIV9, p = 0.13; DIV9 vs DIV 21, p = 0.65; DIV2 vs DIV21, p = 0.001). C, GABA DF during in vitro slice development (KW, p = 0.017; DMC: DIV2 vs DIV9, p = 0.35; DIV9 vs DIV21, p = 0.85; DIV2 vs DIV21, p = 0.013). D, The RMP during in vitro slice development (KW, p = 0.23). B-D, Data are from 9-13 cells, 8-11 slices, and 5-10 mice per group. E, F, EGABA (PT, p = 0.038) and GABA DF (PT, p = 0.18) values recorded in CA1 pyramidal cells at DIV2 before and after acute application of VU. Data are from 3 cells, 3 slices, and 3 mice per group. G, H, EGABA (PT, p = 0.009) and GABA DF (PT, p = 0.006) values recorded in CA1 pyramidal cells at DIV21 before and after acute application of VU. Data are from 4 cells, 4 slices, and 4 mice per group. I, Western blot for NKCC1 protein content, measured in hippocampal slices cultures at DIV2, DIV9, and DIV21, and in acute slices from P6 and adult (P57) mice. Tubulin (Tub) was used as loading control. J, Summary of data for NKCC1 expression levels. Protein levels were normalized to DIV21 values (one-way ANOVA, p = 0.0003; SMC: DIV2 vs DIV9, p > 0.99; DIV9 vs DIV21, p = 0.019; DIV2 vs DIV21, p = 0.023; DIV21 vs P57, p = 0.26; P6 vs P57, p = 0.003). K, Western blot for KCC2 protein content, measured in hippocampal slice cultures at DIV2, DIV9, and DIV21, and in acute slices from P6 and adult (P57) mice. Tubulin (Tub) was used as loading control. L, Summary of data for KCC2 expression levels. Protein levels were normalized DIV21 values (one-way ANOVA, p < 0.0001; SMC: DIV2 vs DIV9, p = 0.045; DIV9 vs DIV21, p > 0.99; DIV2 vs DIV21, p = 0.10; DIV21 vs P57, p = 0.0007; P6 vs P57, p = 0.0001). M, Western blot for S940-pKCC2 (pKCC2) protein content, measured in hippocampal slice cultures at DIV2, DIV9, and DIV21, and in acute slices from P6 and adult (P57) mice. Tubulin (Tub) was used as loading control. N, Summary of data for s940-pKCC2 (pKCC2) expression levels. Protein levels were normalized to DIV21 values (one-way ANOVA, p = 0.006; SMC: DIV2 vs DIV9, p > 0.99; DIV9 vs DIV21, p > 0.99; DIV2 vs DIV21, p = 0.99; DIV21 vs P57, p = 0.020; P6 vs P57, p = 0.033). I-N, Data are from 3-5 experiments and 2-5 mice per group. *p < 0.05. **p ≤ 0.01. ***p ≤ 0.001.
Figure 2.
Figure 2.
VU depolarizes GABA DF and increases intracellular chloride levels at DIV9. A, B, GABA reversal potential (EGABA) (MW, p = 0.016) and GABA DF (MW, p = 0.005) recorded in CA1 pyramidal cells at DIV9 in control (CTL) and VU-treated slices. Data are from 7-9 cells, 6-8 slices, and 3-5 animals per group. C, Illustration of FRET from CFP donor to YFP acceptor of the SClm sensor. FRET ratios (YFP/CFP fluorescence) decrease with increasing chloride concentrations. D, Two-photon images of SClm FRET ratios in CA1 pyramidal neurons in CTL and VU-treated cultures at DIV9. Individual cells are color-coded to their FRET ratios. Scale bar, 10 μm. E, Average SClm FRET ratios in CTL and VU-treated cultures (UT, p = 0.041). Data are from 16-24 cells per slice, 13 or 14 slices, and 6-8 mice per group. F, Cumulative distribution of FRET ratios in individual cells in CTL and VU-treated cultures (KS, p < 0.0001). Data are from 15 cells per slice, 13 or 14 slices, and 6-8 mice per group. G, Western blot of NKCC1, KCC2, and S940-pKCC2 (pKCC2) expression in CTL and VU-treated cultures. Tubulin (Tub) was used as loading control. H, Summary of data for NKCC1, KCC2, and for s940-pKCC2 (pKCC2) expression levels at DIV9. Values in VU-treated cultures were normalized to the protein level in CTL cultures (NKCC1: MW, p > 0.99; KCC2: MW, p = 0.70; pKCC2: MW, p = 0.31). I, Confocal images of NeuN and KCC2 staining in CTL and VU-treated cultures with ROIs in yellow. Scale bar, 10 μm. J, Total KCC2 levels (UT, p = 0.78) and KCC2 levels in membrane (UT, p = 0.51) in CTL and VU-treated cultures at DIV9. Each data point represents the mean KCC2 intensity of the 5-15 ROIs in one image. Data are from 8-12 images, 4-6 slices, and 3 mice per group. K, Confocal images of NeuN and KCC2 staining in slices were infected with KCC2-SH-TetR-eGFP lentivirus. Expression of shKCC2 was induced in GFP+ cells by doxycycline (dox) treatment. L, Top, Total KCC2 intensity in KCC2-SH-TetR-GFP-positive and -negative CA1 pyramidal neurons in slice cultures with or without dox treatment at DIV9 (KW, p < 0.0001; DMC: GFP dox vs GFP dox+, p > 0.99; GFP dox vs GFP+ dox, p > 0.99; GFP dox vs GFP+ dox+, p = 0.0001; GFP dox+ vs GFP+ dox, p > 0.99; GFP dox+ vs GFP+ dox+, p = 0.0003; GFP+ dox vs GFP+ dox+, p = 0.009). Bottom, KCC2 intensity in membrane in KCC2-SH-TetR-GFP-positive and -negative CA1 pyramidal neurons in slice cultures with or without dox treatment at DIV9 (KW, p < 0.0001; DMC: GFP dox vs GFP- dox+, p = 0.20; GFP dox vs GFP+ dox, p > 0.99; GFP dox vs GFP+ dox+, p < 0.0001; GFP dox+ vs GFP+ dox, p > 0.99; GFP dox+ vs GFP+ dox+, p = 0.032; GFP+ dox vs GFP+ dox+, p = 0.0006). Data are from 23 or 24 cells, 3 or 4 slices, and 3 mice per group. *p < 0.05. **p ≤ 0.01. ***p ≤ 0.001.
Figure 3.
Figure 3.
VU treatment does not change excitatory or inhibitory transmission and firing properties at DIV9. A, sEPSC recordings from CA1 pyramidal cells in a control (CTL) and VU-treated culture at DIV9. Asterisks indicate sEPSCs. B, sIPSC recordings in CTL and VU-treated cultures at DIV9. Asterisks indicate sIPSCs. C-F, sEPSC frequency (MW, p = 0.36), amplitude (MW, p = 0.45), rise time (UT, p = 0.87), and decay tau (UT, p = 0.53) in CTL and VU-treated cultures at DIV9. Data are from 16-24 cells, 11-15 slices, and 10-12 mice per group. G-J, sIPSC frequency (UT, p = 0.32), amplitude (UT, p = 0.46), rise time (UT, p = 0.99), and decay tau (UT, p = 0.20) in in CTL and VU-treated cultures at DIV9. Data are from 12-13 cells, 4-7 slices, and 4-6 mice per group. K, Example recordings of APs during current injections in CA1 pyramidal neurons in CTL and VU-treated cultures at DIV9. L, AP firing rates in CTL and VU-treated cultures with increasing current injections at DIV9 (two-way ANOVA, current injection: p < 0.001, treatment: p = 0.24). Data are from 14-17 cells, 10 or 11 slices, and 9 or 10 mice per group. M, N, RMP (UT, p = 0.75) and AP threshold (UT, p = 0.98) in CTL and VU-treated cultures at DIV9. Data are from 14-20 cells, 10 or 11 slices, and 9 or 10 mice per group.
Figure 4.
Figure 4.
VU treatment does not change excitatory or inhibitory synapses at DIV9. A, B, Thresholded images of VGLUT and VGAT puncta in the CA1 sPyr and sRad of control (CTL) and VU-treated cultures at DIV9. Scale bar, 10 μm. C, D, Density (MW, p = 0.43) and size (MW, p = 0.33) of VGLUT puncta in the sPyr in CTL and VU-treated cultures at DIV9. E, F, Density (MW, p = 0.27) and size (MW, p = 0.83) of VGLUT puncta in the sRad. G, H, Density (MW, p = 0.96) and size (MW, p = 0.54) of VGAT puncta in the sPyr. I, J, Density (MW, p = 0.89) and size (MW, p = 0.84) of VGAT puncta in the sRad. C-J, Data are from 5 or 6 slices, and 4 or 5 mice per group. K, Example images of the apical dendrite of CA1 pyramidal neurons in CTL and VU-treated cultures at DIV9. Arrowheads indicate spines. Scale bar, 1 μm. L, The average density of dendritic spines (UT, p = 0.82) in CTL and VU-treated cultures at DIV9. Data are from 10 or 11 cells, 6-8 slices, and 6 mice per group.
Figure 5.
Figure 5.
GABA is inhibitory in control and VU-treated slice cultures at DIV8 and DIV9. A, Whole-cell voltage-clamp recordings from CA1 pyramidal cells in the presence of gabazine in control (CTL) and VU-treated cultures at DIV9. Asterisks indicate network discharges. B, C, Network discharge (ND) frequency (MW, p = 0.61) and duration (MW, p = 0.20) in CTL and VU-treated cultures at DIV9. Data are from 17-24 cells, 11-15 slices, and 10-12 mice per group. D, Cell-attached recordings from CA1 pyramidal cells showing AP firing in modified ACSF in CTL and VU-treated cultures at DIV8 before (baseline) and after muscimol wash-in. Asterisks indicate APs. E, F, Average AP frequency before and after muscimol wash-in in CTL and VU-treated cultures at DIV8. Muscimol decreases firing rates in CTL (WSR, p = 0.008) and VU-treated (WSR, p = 0.016) cultures at DIV8. Data are from 7 or 8 cells, 7 or 8 slices, and 3 or 4 mice per group. An MW was performed to compare baseline firing rates in CTL and VU-treated cultures (MW, p = 0.79). *p < 0.05. **p ≤ 0.01.
Figure 6.
Figure 6.
VU treatment does not affect excitatory transmission but increases spontaneous inhibitory transmission at DIV21. A, B, GABA reversal potential (EGABA) (MW, p = 0.56) and GABA DF (MW, p = 0.76) recorded in CA1 pyramidal cells in control (CTL) and VU-treated cultures at DIV21, 2 weeks after cessation of treatment. Data are from 9-16 cells, 3-10 slices, and 3-10 mice per group. C, D, sEPSC and sIPSC recordings from CA1 pyramidal cells in CTL and VU-treated cultures at DIV21. Asterisks indicate sEPSCs and sIPSCs. E-H, sEPSC frequency (UT, p = 0.26), amplitude (MW, p = 0.59), rise time (UT, p = 0.80), and decay tau (UT, p = 0.94) in CTL and VU-treated cultures at DIV21. Data are from 16 cells, 9 slices, and 9 mice per group. I-L, sIPSC frequency (MW, p = 0.006), amplitude (UT, p = 0.52), rise time (UT, p = 0.026), and decay tau (UT, p = 0.37) in CTL and VU-treated cultures at DIV21. M, Average sIPSC recorded in CA1 pyramidal cells in CTL and VU-treated cultures at DIV21. N, Cumulative distribution of sIPSC rise times in control and VU-treated cultures at DIV21 (KS, p < 0.0001). Dotted line indicates value used to split fast from slow rise time sIPSCs. O, Frequency of fast sIPSCs in CTL and VU-treated cultures at DIV21 (MW, p = 0.20). P, Frequency of fast slow sIPSCs in CTL and VU-treated cultures at DIV21 (MW, p = 0.003). I-P, Data are from 18-20 cells, 11 or 12 slices, and 8 or 9 mice per group. *p < 0.05. **p ≤ 0.01.
Figure 7.
Figure 7.
VU treatment does not affect mIPSCs, or excitatory and inhibitory synapses at DIV21. A-D, mIPSC frequency (UT, p = 0.60), amplitude (UT, p = 0.34), rise time (UT, p = 0.077), and decay tau (UT, p = 0.40) recorded from CA1 pyramidal cells in CTL and VU-treated cultures at DIV21. Data are from 15-17 cells, 9-12 slices, and 6-9 mice per group. E, F, Density (UT, p = 0.80) and size (UT, p = 0.61) of VGLUT puncta in the sPyr in CTL and VU-treated slices at DIV21. G, H, Density (MW, p = 0.91) and size (MW, p = 0.76) of VGLUT puncta in the sRad. I, J, Density (MW, p = 0.078) and size (UT, p = 0.14) of VGAT puncta in the sPyr. K, L, Density (MW, p = 0.76) and size (MW, p > 0.99) of VGAT puncta in the sRad. E-L, Data are from 10-13 slices and 6 or 7 mice per group. M, Maximal projection of confocal images of the apical dendrite of DIV21 CA1 pyramidal neurons in CTL and VU-treated cultures. Arrowheads indicate spines. Scale bar, 1 μm. N, Dendritic spine densities in control and VU-treated cultures at DIV21 (MW, p = 0.77). Data are from 10-11 cells, 8 slices, and 7 or 8 mice per group.
Figure 8.
Figure 8.
VU treatment increases the firing threshold of pyramidal neurons at DIV21. A, Whole-cell voltage-clamp recordings from CA1 pyramidal cells in control (CTL) and VU-treated cultures at DIV21, in the presence of gabazine. Asterisks indicate network discharges. B, C, Network discharge (ND) frequency (MW, p = 0.14) and duration (MW, p = 0.20) in CTL and VU-treated cultures at DIV21. Data are from 16 cells, 9 slices, and 9 mice per group. D, Whole-cell current-clamp recordings of APs after current injections in CA1 pyramidal neurons in CTL and VU-treated cultures at DIV21. E, AP firing rates in CTL and VU-treated cultures with increasing current injections at DIV21 (two-way ANOVA, current injection: p < 0.001, treatment: p = 0.36). Data are from 13 or 14 cells, 9 slices, and 9 mice per group. F-H, RMP (UT, p = 0.75), AP threshold (MW, p = 0.006), and relative AP (Rel AP) threshold (MW, p = 0.72) in CTL and VU-treated cultures at DIV21. Data are from 13-16 cells, 9 slices, and 9 mice per group. *p < 0.05.
Figure 9.
Figure 9.
VU treatment does not change chloride concentrations in VGAT-positive interneurons. A, Images of SClm FRET ratios in CA1 sRad GABAergic interneurons in control (CTL) and VU-treated slices from VGAT-Cre mice at DIV9 and DIV21. Scale bar, 10 μm. B, Average SClm FRET ratio in interneurons in the CA1 sPyr in CTL and VU-treated cultures at DIV9 and DIV21 (one-way ANOVA, p = 0.002; SMC: DIV9 DMSO vs DIV9 VU, p = 0.99; DIV9 DMSO vs DIV21 DMSO, p = 0.015; DIV9 VU vs DIV21 VU, p = 0.015; DIV21 DMSO vs DIV21 VU, p = 0.97). C, Cumulative distribution of FRET ratios in individual sPyr interneurons in CTL and VU-treated cultures (KS, p < 0.0001). B, C, Data are from 32-69 cells, 3-5 slices, and 3 mice per group. D, Average SClm FRET ratio in interneurons in the CA1 sRad in CTL and VU-treated cultures at DIV9 and DIV21 (one-way ANOVA, p = 0.02; SMC: DIV9 DMSO vs DIV9 VU, p = 0.77; DIV9 DMSO vs DIV21 DMSO, p = 0.0007; DIV9 VU vs DIV21 VU, p = 0.12; DIV21 DMSO vs DIV21 VU, p = 0.23). An additional one-way ANOVA was performed to compare FRET ratios of individual cells in DIV9 VU vs DIV21 VU cultures and DIV21 DMSO vs DIV21 VU cultures (one-way ANOVA, p < 0.0001; SMC: DIV9 VU vs DIV21 VU, p < 0.0001; DIV21 DMSO vs DIV21 VU, p = 0.37). E, Cumulative distribution of FRET ratios in individual interneurons the CA1 sRad VU-treated (KS, p < 0.0001) and VU-treated cultures (KS, p < 0.0001). An additional KS was performed to compare the distribution of FRET ratios in CTL and VU-treated cultures at DIV21 (KS, p = 0.63). D, E, Data are from 33-56 cells, 3-6 slices, and 2 or 3 mice per group. *p < 0.05. ***p ≤ 0.001.
Figure 10.
Figure 10.
VU treatment results in elevated RMPs in sRad interneurons at DIV21. A, Whole-cell voltage-clamp recordings of evoked IPSCs in control (CTL) and VU-treated cultures at DIV21. Stimulation electrode was placed in the sRad. Bold represents average evoked IPSCs. Gray represents individual traces. B, C, Paired-pulse ratios (IPSC2/IPSC1 amplitudes) evoked in sRad (MW, p = 0.65) and sPyr (MW, p = 0.21) in CTL and VU-treated cultures at DIV21. D, E, Coefficient of variation (CV) of the first IPSCs evoked in sRad (MW, p = 0.96) and sPyr (MW, p = 0.80) in CTL and VU-treated cultures at DIV21. B–E, Data are from 7 or 8 cells, 4-6 slices, and 3-5 mice per group. F, sEPSC recording in GFP-labeled interneurons in sRad from control (CTL) and VU-treated cultures from GAD65-GFP mice at DIV21. Asterisks indicate sEPSC. G, H, sEPSC frequency (MW; p = 0.85) and amplitude (MW; p = 0.38) in these interneurons. Data are from 15 or 16 cells, 11 slices, and 10 mice per group. I, Whole-cell current-clamp recordings of APs after current injections in sRad interneurons in CTL and VU-treated cultures at DIV21. J, AP firing rates in sRad interneurons in CTL and VU-treated cultures at DIV21 (two-way ANOVA, current injection: p < 0.001, treatment: p = 0.42). K–M, RMP (MW, p = 0.023), AP threshold (UT, p = 0.11), and relative AP (Rel AP) threshold (MW, p = 0.012) in sRad interneurons in CTL and VU-treated cultures at DIV21. J-M, Data are from 13-16 cells, 11 slices, and 10 mice per group. *p < 0.05.

Similar articles

Cited by

References

    1. Akerman CJ, Cline HT (2006) Depolarizing GABAergic conductances regulate the balance of excitation to inhibition in the developing retinotectal circuit in vivo. J Neurosci 26:5117–5130. 10.1523/JNEUROSCI.0319-06.2006 - DOI - PMC - PubMed
    1. Akita T, Fukuda A (2020) Intracellular Cl− dysregulation causing and caused by pathogenic neuronal activity. Pflugers Arch Eur Arch 472:977–987. 10.1007/s00424-020-02375-4 - DOI - PubMed
    1. Antoine MW, Langberg T, Schnepel P, Feldman DE (2019) Increased excitation-inhibition ratio stabilizes synapse and circuit excitability in four autism mouse models. Neuron: 101:648–661.e5. 10.1016/j.neuron.2018.12.026 - DOI - PMC - PubMed
    1. Awad PN, Amegandjin CA, Szczurkowska J, Carriço JN, Fernandes do Nascimento AS, Baho E, Chattopadhyaya B, Cancedda L, Carmant L, Di Cristo G (2018) KCC2 regulates dendritic spine formation in a brain-region specific and BDNF dependent manner. Cereb Cortex: 28:4049–4062. 10.1093/cercor/bhy198 - DOI - PMC - PubMed
    1. Banerjee A, Rikhye RV, Breton-Provencher V, Tang X, Li C, Li K, Runyan CA, Fu Z, Jaenisch R, Sur M (2016) Jointly reduced inhibition and excitation underlies circuit-wide changes in cortical processing in Rett syndrome. Proc Natl Acad Sci USA 113:E7287–E7296. 10.1073/pnas.1615330113 - DOI - PMC - PubMed

Publication types

LinkOut - more resources