. 2023 Jul 12;14(1):4130.
doi: 10.1038/s41467-023-39429-x.

Decoding a cryptic mechanism of metronidazole resistance among globally disseminated fluoroquinolone-resistant Clostridioides difficile

Affiliations

Decoding a cryptic mechanism of metronidazole resistance among globally disseminated fluoroquinolone-resistant Clostridioides difficile

Abiola O Olaitan et al. Nat Commun. .

Abstract

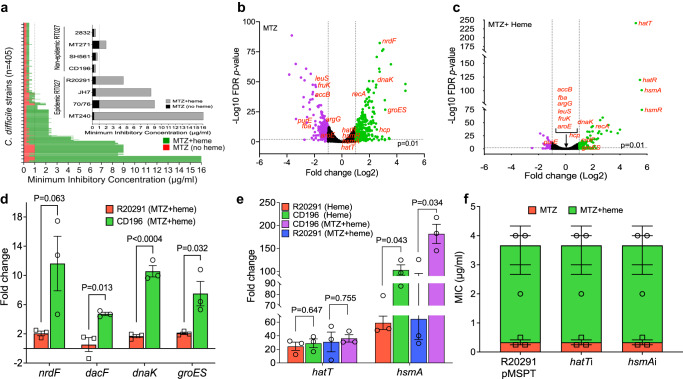
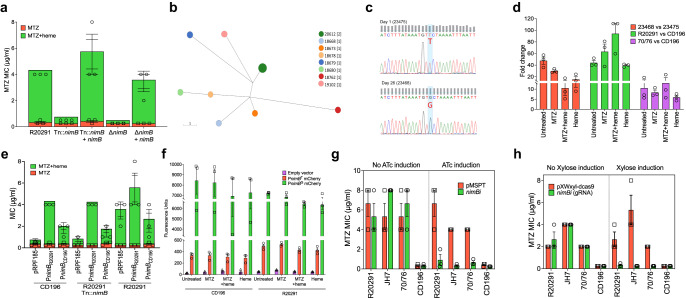
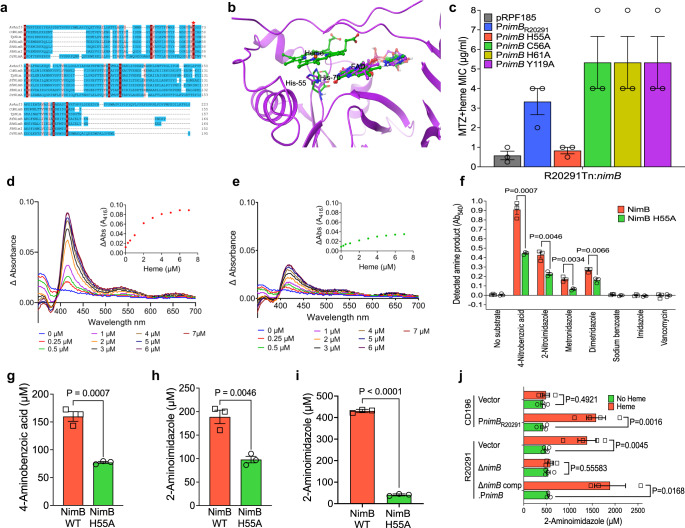
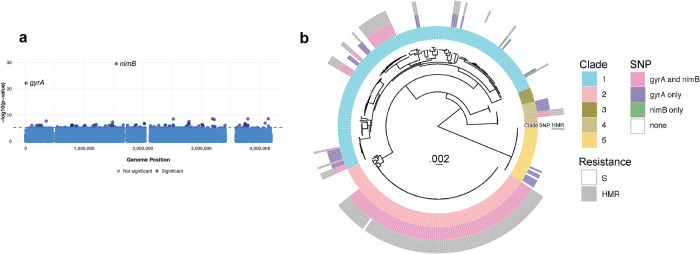
Severe outbreaks and deaths have been linked to the emergence and global spread of fluoroquinolone-resistant Clostridioides difficile over the past two decades. At the same time, metronidazole, a nitro-containing antibiotic, has shown decreasing clinical efficacy in treating C. difficile infection (CDI). Most metronidazole-resistant C. difficile exhibit an unusual resistance phenotype that can only be detected in susceptibility tests using molecularly intact heme. Here, we describe the mechanism underlying this trait. We find that most metronidazole-resistant C. difficile strains carry a T-to-G mutation (which we term PnimBG) in the promoter of gene nimB, resulting in constitutive transcription. Silencing or deleting nimB eliminates metronidazole resistance. NimB is related to Nim proteins that are known to confer resistance to nitroimidazoles. We show that NimB is a heme-dependent flavin enzyme that degrades nitroimidazoles to amines lacking antimicrobial activity. Furthermore, occurrence of the PnimBG mutation is associated with a Thr82Ile substitution in DNA gyrase that confers fluoroquinolone resistance in epidemic strains. Our findings suggest that the pandemic of fluoroquinolone-resistant C. difficile occurring over the past few decades has also been characterized by widespread resistance to metronidazole.


Conflict of interest statement

The authors declare no competing interests.

Figures

Fig. 1
Fig. 1. Heme attenuates cellular toxicity of metronidazole (MTZ) in epidemic C. difficile strains.
a Minimum inhibitory concentrations (MICs) of MTZ were determined against global clinical isolates of C. difficile (n = 405) in the presence and absence of heme. Isolates with heme-dependent MTZ resistance exhibited ≥4-fold higher MICs in BHI agars containing heme, compared to agars without heme. An MTZ MIC of 1 μg/ml (dashed line) was found to be associated with poor clinical outcomes, although the EUCAST resistance breakpoint is 2 μg/ml. Inset illustrates selected RT027 epidemic and non-epidemic strains that are resistant or susceptible to MTZ in heme, respectively. Non-epidemic RT027 were defined as previously described (i.e., lacking fluoroquinolone resistance SNPs in gyrase A and large transposons found in epidemic RT027). MICs were from two biological replicates with two technical replicates. Transcriptome response of epidemic R20291 (OD600 nm ≈ 0.2) exposed for 30 min to MTZ (2 μg/ml) in the absence (b) and presence (c) of heme (5 μg/ml). The volcano plots indicate differentially expressed genes and their statistical significance; the purple and green dots indicate significantly downregulated and upregulated genes, respectively; red-highlighted genes are cell stress-responsive and metabolic genes whose expression were altered by MTZ but were attenuated by heme. The RNA-seq is based on two biological replicates, as the third replicate was rejected in FastQC due to poor quality. Pearson correlation of R2 = 0.94 in Supplementary Fig. 2b shows RNA-seq transcriptional changes were validated by qPCR (three biological replicates). In (b) and (c), differential gene expression was determined with edgeR, an RNA-seq analysis tool with default statistical analysis of false discovery rate (FDR) ≤ 0.01 and Log2 fold change set to ≥1; output p values for each gene were converted to negative logarithm (−Log10) and plotted against Log2-fold change in Graphpad prism 9.4.1. d Transcriptional response of epidemic R20291 and non-epidemic CD196 to MTZ (2 μg/ml) in the presence of heme (5 μg/ml). qPCR analysis of transcription patterns of genes indicative of MTZ toxicity demonstrates heme is not protective for non-epidemic CD196. e Transcriptional analysis of heme sensing/detoxifying genes hatT and hsmA in heme with or without MTZ, indicate that CD196 and R20291 both highly express these genes, as determined by qPCR. Data from (d) and (e) were statistically analyzed in Graphpad prism 9.4.1 by two-tailed multiple unpaired t test with correction for multiple comparisons using the Holm-Šídák method and alpha set to 0.05; data in each plot were from three biological replicates. f Heme sensing and detoxifying systems do not mediate heme-dependent MTZ resistance. In R20291, silencing hatT or hsmA had no effect on heme-dependent resistance, indicating that these genes are unlikely to contribute to heme-dependent resistance; anti-sense RNA to hatT or hsmA was cloned into vector pMSPT and induced by 64 ng/ml of anhydrotetracycline; qPCR indicated hatT mRNA decreased by ~7-fold (i.e., −7.21 ± 1.95) and hsmA by ~18-fold (i.e., −18.46 ± 10.66). Data in (d), (e), and (f) are plotted as mean ± standard error of mean.
Fig. 2
Fig. 2. Constitutive transcription of nimB is associated with metronidazole (MTZ) resistance and results from a mutation in the −10 promoter.
a Screening of a transposon (Tn) library identified that insertional inactivation of nimB abrogated resistance in R20291. The allelic deletion of nimB confirmed its role in resistance; in both mutants, resistance was restored by complementation with wildtype nimB, expressed from its native promoter. b Sequential isolates from a patient failing MTZ therapy were collected on day 1 (before therapy) and on day 26 (after therapy ended); the day 1 isolate (23475, MIC = 0.25 μg/ml) and day 26 isolate (23468, MIC = 1.0 μg/ml) were MTZ-susceptible and -resistant, respectively. In Enterobase, core-genome multilocus sequence typing showed the two isolates had the same hierarchical clustering (HC0), indicating they have identical core genomes or at least do not differ by more than two SNPs. cgMLST Ninja Neighbor Joining GrapeTree of C. difficile belonging to ST350; 23475 and 23468 clustered in the same node. The scale bar indicates the number of allelic differences. c Sanger sequencing showed 23468 has a T to G mutation in the −10 nimB-promoter when compared to 23475, confirming a whole genome comparison; Sanger sequencing was done on a separate colony (i.e., n = 1 per strain) to that used for genome sequencing; this mutation is referred to as PnimBG in 23468, while the wildtype is designated PnimBT in 23475. d qPCR analysis of nimB transcription in resistant and susceptible strains carrying PnimBG and PnimBT, respectively. Resistant strains (23468, R20291, and 70/76) had higher levels of nimB mRNA than susceptible strains (23475 and CD196); nimB transcription was constitutive in resistant strains. Strains were cultured in various conditions (MTZ [2 μg/ml] and heme [5 μg/ml]); shown are fold mRNA amounts in resistant strains relative to susceptible strains. e Relationship between resistance and variations in nimB between non-epidemic CD196 and epidemic R20291. The nimBs of CD196 and R20291 were expressed from their native promoters in the indicated strains. f Comparison of the promoter strengths of PnimBG and PnimBT based on the transcription and fluorescence of mCherryOpt. Fluorescence was normalized to OD600nm culture density. PnimBG was associated with constitutive expression, reflected by higher fluorescence. Genetic silencing of nimB reverses resistance. nimB was silenced by an antisense RNA (asRNA) (g) and by CRISPR interference with two guide RNAs (gRNAs) (h). AsRNA was induced by anhydrotetracycline (64 ng/ml) from Ptet promoter in vector pMSPT, while gRNA was induced by xylose (1% w/v) from Pxyl promoter in vector pXWxyl-dcas9. Data in (a), (d), (e), (f), (g) and (h) are shown as the mean ± standard error of mean from three biological replicates.
Fig. 3
Fig. 3. CdNimB is a heme-binding nitroreductase.
a Sequence alignment of Nim proteins from C. difficile and other bacteria, with the structurally related heme binding flavocytochrome Anf3 nitrogenase from Azotobacter vinelandii (AvAnf3, accession no. 6RK0). Histidine-70 (red asterisk) is the proximal heme-binding ligand of Anf3 and is a conserved amino acid in Nim proteins e.g., histidine-55 in CdNimB. Other sequences and accession numbers are from: Tp, Terrisporobacter petrolearius WP_228108130 (https://www.ncbi.nlm.nih.gov/protein/2129663836); Bf, Bacterioides fragilis WP_063854490.1; Bh, Brachyspira hampsonii WP_039955657; Dr, Deinococcus radiodurans Q9RW27; and Pb, Prevotella baroniae ACR40098.1. b Structural alignment with Anf3 (green ball and stick), a CdNimB homology model (purple ribbons) shows close structural similarity. The CdNimB model was generated from the B. thetaiotaomicron NimB X-ray structure bound to FAD (PDB ID 2FG9) and aligned with Anf3, which has both FAD and heme bound (see Supplementary Fig. 5). The model shows CdNimB histidine-55 (purple) is structurally equivalent to histidine-70 (green) of Anf3; the FAD domains are also conserved in the two proteins. FAD and heme of Anf3 are represented as ball/stick with green carbons; the FAD of CdNimB is shown as ball/stick with purple carbons; for simplicity only histidine-70 of the Anf3 protein is shown. c Alanine mutagenesis identified histidine-55 mediates heme-dependent metronidazole resistance (MTZ). Among different alanine mutants, only His55Ala mutant did not exhibit resistance when expressed in R20291-Tn::nimB; the nimB variants were expressed in pRPF185 under PnimBG. Absorption spectra showing wildtype CdNimB (d) binds heme, but this is attenuated in the His55Ala CdNimB mutant (e). The spectra were obtained by adding increasing concentrations of heme (i.e., hemin, 1–7 µM) to 10 µM of protein (data are representative of three experimental replicates). Heme was titrated until saturation was reached, where there were no further significant changes in absorbance readings. The buffer was similarly titrated with heme and values subtracted from the protein spectral data. The insets show binding saturation curves based on the change in absorbance at 416 nm as a function of heme concentration. f Comparison of nitroreductase activities of wildtype CdNimB and Ala-55 mutant. Reduction of various nitroaromatics were tested in reaction containing CdNimB (10 μM), heme (10 μM), FAD (10 μM) and NADPH (3 mM). Reactions were incubated for 2 h, and formation of aromatic amines detected using Bratton-Marshall assay; imidazole, sodium benzoate and vancomycin were non-nitroaromatic negative controls. Corresponding assay development is shown in Supplementary Fig. 8. Data were statistically analyzed in Graphpad prism 9.4.1 by two-tailed multiple unpaired t test with correction for multiple comparisons using the Holm-Šídák method and alpha set to 0.05. Comparison of nitroreductase activities of wildtype CdNimB and His55Ala mutant, with quantification using the Bratton-Marshall assay. As shown in (g), 4-nitrobenzoic acid is reduced to 4-aminobenzoic acid, and 2-nitroimidazole is reduced to 2-aminoimidazole in (h). i LC-MS/MS quantification of 2-aminoimidazole formed from the reduction of 2-nitroimidazole in nitroreductase assays with wildtype or His55Ala CdNimBs. There are differences in relative amounts of 2-aminoimidazole quantified by the LC-MS/MS and Bratton-Marshall methods, but the results from both reached the same conclusion that the mutant is less effective in forming the amine product. j Cellular reduction of 2-nitroimidazole to 2-aminoimidazole. Concentrated cultures of various isogenic strains were treated with 2-nitroimidazole (2 mM) alone or with heme and incubated for 3 h, before 2-aminoimidazole were quantified. Plots show the mean ± standard error of mean from four replicates, except for three biological replicates for R20291ΔnimB comp.PnimB. Statistical analyses in (g)–(j) were done by two-tailed unpaired t test in Graphpad prism 9.4.1. Data in (c), (f)–(i) are from three biological replicates. Data in (d) and (e) show one of three biological replicates tested; the other two replicates behaved as shown in (d) and (e).
Fig. 4
Fig. 4. PnimBG-associated metronidazole (MTZ) resistance co-occurs with fluroquinolone resistance and pandemic spread.
a Manhattan plot showing SNPs significantly associated with heme-induced metronidazole resistance (HMR). Adjusted, log-transformed p values calculated by pySEER are plotted by genome position; default statistical analyses built in pySEER were used. Both gyrA and nimB SNPs are very significantly associated with HMR. b Maximum likelihood phylogeny based on whole genome sequences from 348 isolates. Multi-locus sequence type (MLST) Clades 1-5 (inner circle), gyrA and nimB-promoter mutations (middle circle), and metronidazole susceptibility (outer circle), either heme-induced metronidazole resistant (HMR) or metronidazole susceptible (S), are shown. The gyrA, nimB-promoter mutations and associated HMR are associated with clonal groups in Clades 2 and 1, suggesting that bacteria carrying these variants have spread rapidly and/ or are sampled more densely in this population.
Fig. 5
Fig. 5. Individual clade phylogenies.
Maximum-likelihood phylogenies of individual Clades 1–5 with tips colored according to gyrA and nimB SNP presence or co-occurrence from this study as well as ref. . a Clade 1; b Clade 2, including “global” isolates from ref.  and those in this study. The pink triangle represents the clonal group of which all but one have both SNPs; (c) Inset showing detail of the clonal group within Clade 2 (with one exception (blue dot; gyrA only), isolates with the gyrA mutation also encoded the nimB mutation; d Clade 3; e Clade 4; and f Clade 5. g Heat map showing SNP presence/co-occurrence and MTZ resistance phenotype frequencies within each Clade of only our sample. Each row corresponds to a single Clade. Each column presents a summary of gyrA and nimB SNP presence and MTZ resistance phenotype. Heat map is shaded by the percentage of each condition within each Clade, such that the sum across a single row is 100%. 88% of Clade 2 isolates are HMR with both gyrA and nimB SNPs, while 100% of Clade 3 isolates are MTZ susceptible and have neither SNP of interest.

References

    1. McDonald LC, et al. An epidemic, toxin gene-variant strain of Clostridium difficile. N. Engl. J. Med. 2005;353:2433–2441. doi: 10.1056/NEJMoa051590. - DOI - PubMed
    1. Loo VG, et al. A predominantly clonal multi-institutional outbreak of Clostridium difficile-associated diarrhea with high morbidity and mortality. N. Engl. J. Med. 2005;353:2442–2449. doi: 10.1056/NEJMoa051639. - DOI - PubMed
    1. Freeman J, et al. The changing epidemiology of Clostridium difficile infections. Clin. Microbiol. Rev. 2010;23:529–549. doi: 10.1128/CMR.00082-09. - DOI - PMC - PubMed
    1. Weese JS. Clostridium (Clostridioides) difficile in animals. J. Vet. Diagn. Investig. 2020;32:213–221. doi: 10.1177/1040638719899081. - DOI - PMC - PubMed
    1. Dingle KE, et al. Clinical Clostridium difficile: clonality and pathogenicity locus diversity. PLoS ONE. 2011;6:e19993. doi: 10.1371/journal.pone.0019993. - DOI - PMC - PubMed

Publication types