. 2023 Jul 12;14(7):414.
doi: 10.1038/s41419-023-05855-4.

Tolerance of repeated toxic injuries of murine livers is associated with steatosis and inflammation

Affiliations

Tolerance of repeated toxic injuries of murine livers is associated with steatosis and inflammation

Seddik Hammad et al. Cell Death Dis. .

Abstract

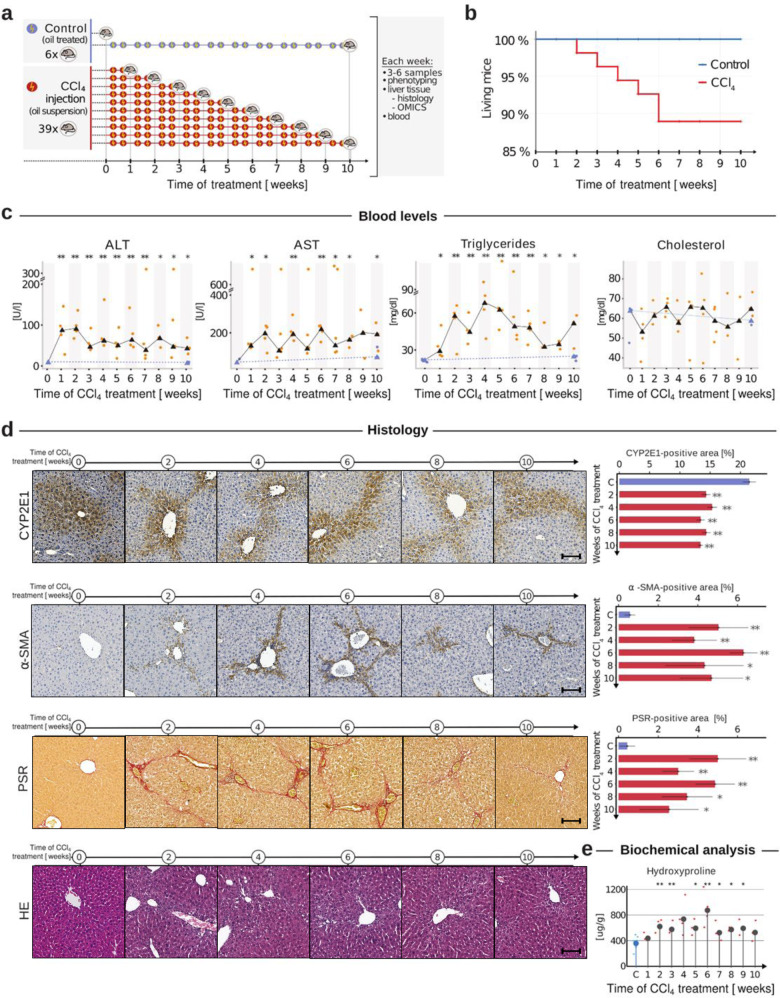
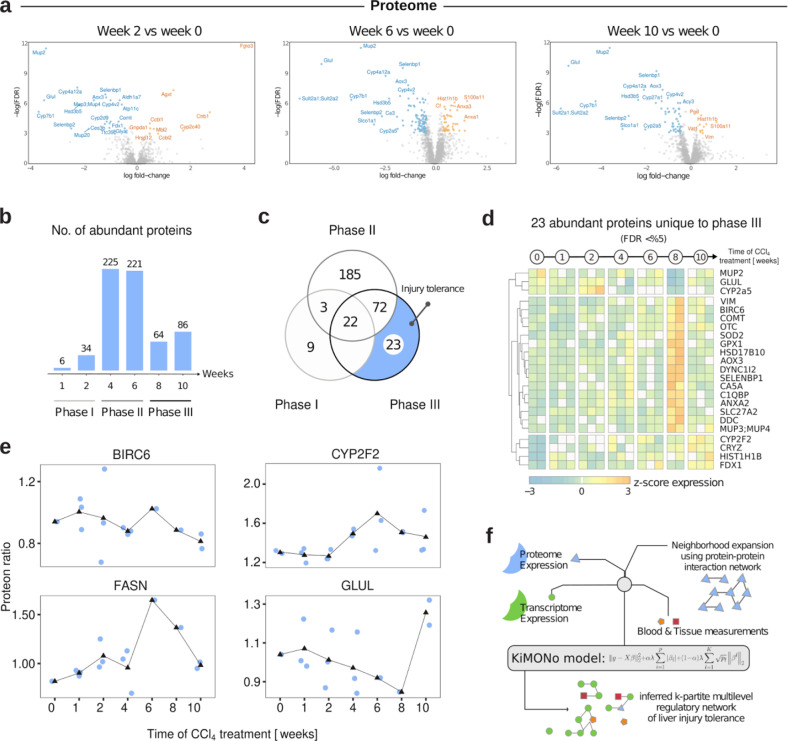
The human liver has a remarkable capacity to regenerate and thus compensate over decades for fibrosis caused by toxic chemicals, drugs, alcohol, or malnutrition. To date, no protective mechanisms have been identified that help the liver tolerate these repeated injuries. In this study, we revealed dysregulation of lipid metabolism and mild inflammation as protective mechanisms by studying longitudinal multi-omic measurements of liver fibrosis induced by repeated CCl4 injections in mice (n = 45). Based on comprehensive proteomics, transcriptomics, blood- and tissue-level profiling, we uncovered three phases of early disease development-initiation, progression, and tolerance. Using novel multi-omic network analysis, we identified multi-level mechanisms that are significantly dysregulated in the injury-tolerant response. Public data analysis shows that these profiles are altered in human liver diseases, including fibrosis and early cirrhosis stages. Our findings mark the beginning of the tolerance phase as the critical switching point in liver response to repetitive toxic doses. After fostering extracellular matrix accumulation as an acute response, we observe a deposition of tiny lipid droplets in hepatocytes only in the Tolerant phase. Our comprehensive study shows that lipid metabolism and mild inflammation may serve as biomarkers and are putative functional requirements to resist further disease progression.


Conflict of interest statement

The authors declare no competing interests.

Figures

Fig. 1
Fig. 1. Longitudinal blood, histopathological and biochemical analysis of liver fibrosis dynamics.
a Experimental setup using carbon tetrachloride (CCl4) administration in mice twice per week for 10 weeks. Blood and liver were collected weekly for further multi-level analysis. Oil-treated mice of weeks zero and ten were used as control. b Kaplan–Meier curve for survival analysis. c Longitudinal blood-based analysis of alanine aminotransferase (ALT), aspartate aminotransferase (AST), triglycerides, and cholesterol. Results are presented as the mean of 3–6 mice ± SD per week, and a significant difference to control is denoted via *p < 0.05, **p < 0.01. d Cytochrome P4502e1 (CYP2E1), alpha-smooth muscle actin (α-SMA), picro-sirius red (PSR), and hematoxylin & eosin (HE) staining with positive quantified signals as a percentage of total area. Scale bars are 100 µm. e Biochemical analysis of the Hydroxyproline level development over the ten-week treatment period.
Fig. 2
Fig. 2. Time-resolved transcriptome analysis of liver exposed to CCl4.
a Volcano plots illustrate identified DE genes of weeks two, six, and ten of CCl4 exposure. b The number of DE genes is visualized in the bar chart. Time points are grouped into three phases characterized by the disease dynamics of liver fibrosis. c Venn diagrams show the unique and shared amount of genes between the phases. d Heatmap of 210 phase III specific DE genes (n = 3 mice per time point). e Diagram visualizing the regulation in a time-resolved manner of the genes; Acta2, Col1a1, Col1a2, and Fasn.
Fig. 3
Fig. 3. Time-resolved proteomic analysis of liver exposed to CCl4.
a Volcano plots of differentially regulated proteins in weeks two, six, and ten. b The number of differentially regulated proteins is visualized via the bar charts. Time points are grouped into three phases characterizing the disease course of liver fibrosis. c Venn diagrams illustrate the unique and overlapping amount of proteins between the three phases. d Heatmap of uniquely deregulated proteins during phase III (n = 2–3 mice per time-point). e The longitudinal regulation of the proteins BIRC6, CYP2F2, FASN, and GLUL. f KiMONo models performed integration of proteomic, transcriptomic, blood, and tissue measurements.
Fig. 4
Fig. 4. Tolerance specific modules in CCl4-induced fibrosis.
a We identified 13 tolerance phase-specific modules within the multi-omic fibrosis network by extracting differential regulated genes, proteins, and network neighbors. Network nodes are only connected when statistical effects are detected within the data. Node sizes refer to their importance within the network, which relate to the high or low effects of CCl4 treatment. b Functional annotation and average regulation of network nodes for initiation, progression, and tolerance phase. Significant (FDR < 0.05) downregulation (blue) and upregulation (red) are visualized within the heatmap. Bold node names denote uniquely differential regulation within the tolerance phase. c Significantly (FDR < 0.05) differentially expressed genes of seven human studies investigating fatty liver disease (steatosis), non-alcoholic fatty liver disease (NASH), alcoholic liver disease (ALD), and hepatocellular carcinoma (HCC).
Fig. 5
Fig. 5. Validation of lipid metabolism induction during the liver response’s tolerance phase.
a Voids appeared as whitish areas in the liver tissue. The spatial distribution of these voids was along fibrotic regions. HE and PSR staining show the specific circular void structure and, in some cases, small nuclei. Additionally, we found that these voids are surrounded by α-SMA or F4/80 positive cells (arrowhead). b Using a specific lipid droplet staining, namely Bodipy, we show that these voids are part of hepatocytes overloaded with lipid droplets. c Longitudinal Bodipy staining to visualize and analyze lipid droplet accumulation in a time-resolved manner. Scale bars are 100 µm. d mRNA levels validated by RT-PCR of lipid metabolism-related targets Srbp-1c, Scd1, and Fasn. e Lower magnification images comparing CCl4-induced fibrosis week eight to week six Stellic animal model (steatosis-NASH based model as a positive control for lipid droplet recognition). f IF staining of lipid droplets with bodipy (green), microtubule-associated protein 1 A/1B-light (LC3, red), lysosomal-associated membrane protein (LAMP1, red), and prellipin 3 (PLIN3, red). Scale bars are 25 µm. g mRNA expression of LC3, PLIN3 and LAMP1 across the different time points.
Fig. 6
Fig. 6. A schematic diagram summarizes liver response to repetitive toxic injuries.
In the initiation phase, liver damage, fibrosis, and macrophages were accumulated while down regulating metabolizing enzymes. In the Progression phase, either further accumulation or no change of these parameters compared with the initiation phase. During the tolerance phase, except for dysregulation of lipid metabolism, all parameters had a trend to be normalized. Accumulation of intracellular lipid droplets is a key feature of the tolerant phase and will be studied in the future.

References

    1. Pellicoro A, Ramachandran P, Iredale JP, Fallowfield JA. Liver fibrosis and repair: immune regulation of wound healing in a solid organ. Nat Rev Immunol. 2014;14:181–94. doi: 10.1038/nri3623. - DOI - PubMed
    1. Zhou WC, Zhang QB, Qiao L. Pathogenesis of liver cirrhosis. World J Gastroenterol. 2014;20:7312–24. doi: 10.3748/wjg.v20.i23.7312. - DOI - PMC - PubMed
    1. Bataller R, Brenner DA. Liver fibrosis. J Clin Invest. 2005;115:209–18. doi: 10.1172/JCI24282. - DOI - PMC - PubMed
    1. Seki E, Schwabe RF. Hepatic inflammation and fibrosis: functional links and key pathways. Hepatology. 2015;61:1066–79. doi: 10.1002/hep.27332. - DOI - PMC - PubMed
    1. Friedman SL. Mechanisms of hepatic fibrogenesis. Gastroenterology. 2008;134:1655–69. doi: 10.1053/j.gastro.2008.03.003. - DOI - PMC - PubMed

Publication types