. 2023 Jul 12;14(1):4158.
doi: 10.1038/s41467-023-39787-6.

Cytosolic Ptbp2 modulates axon growth in motoneurons through axonal localization and translation of Hnrnpr

Affiliations

Cytosolic Ptbp2 modulates axon growth in motoneurons through axonal localization and translation of Hnrnpr

Saeede Salehi et al. Nat Commun. .

Abstract

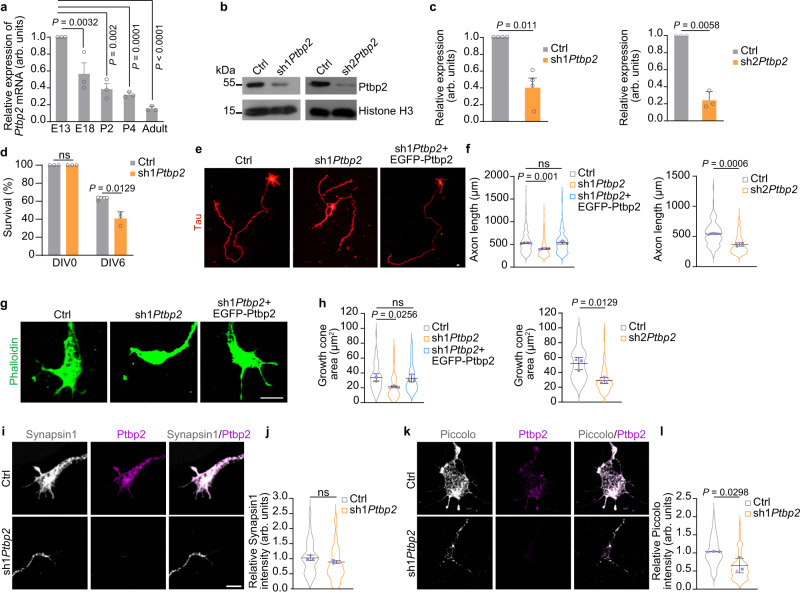
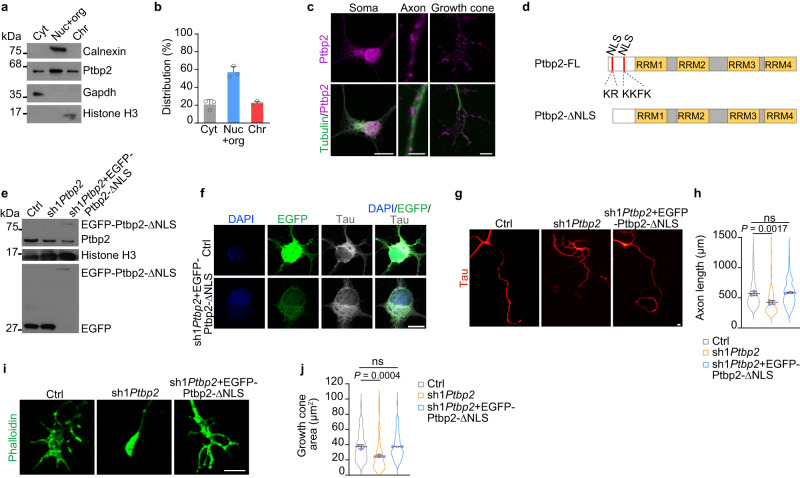
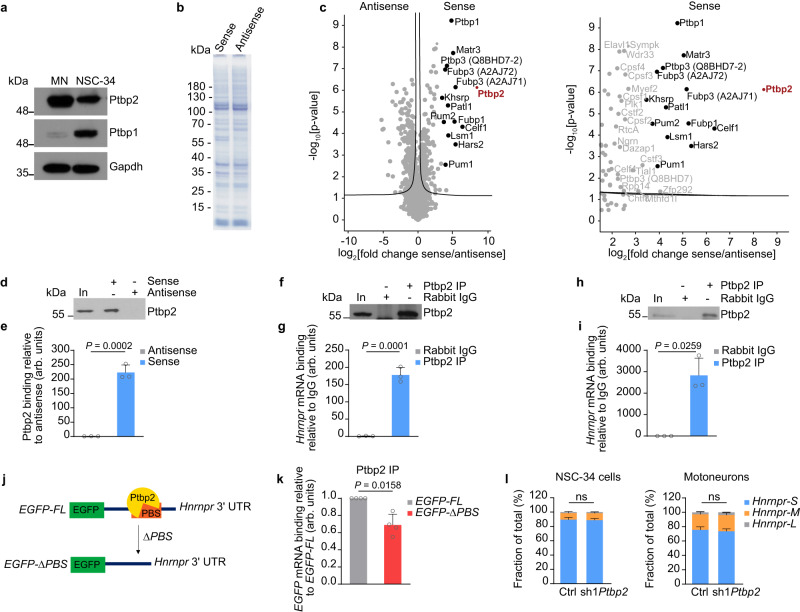
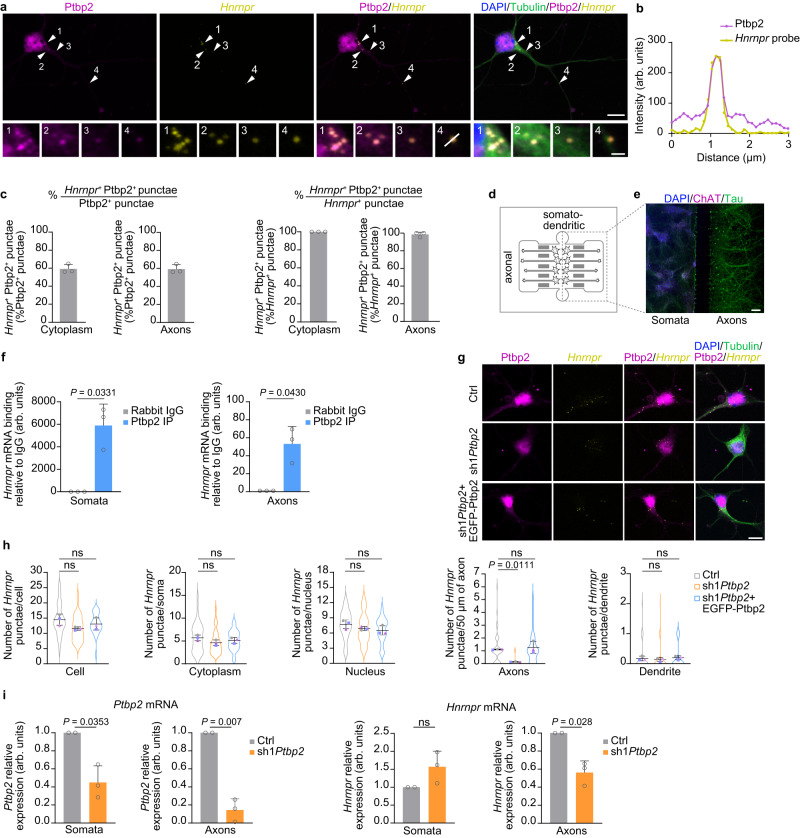
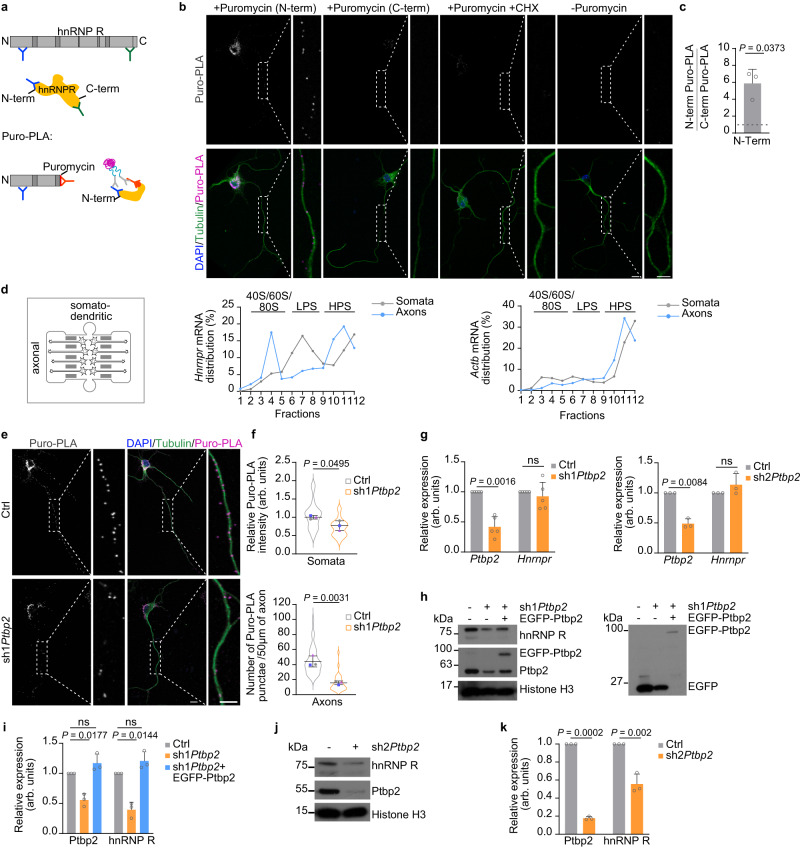
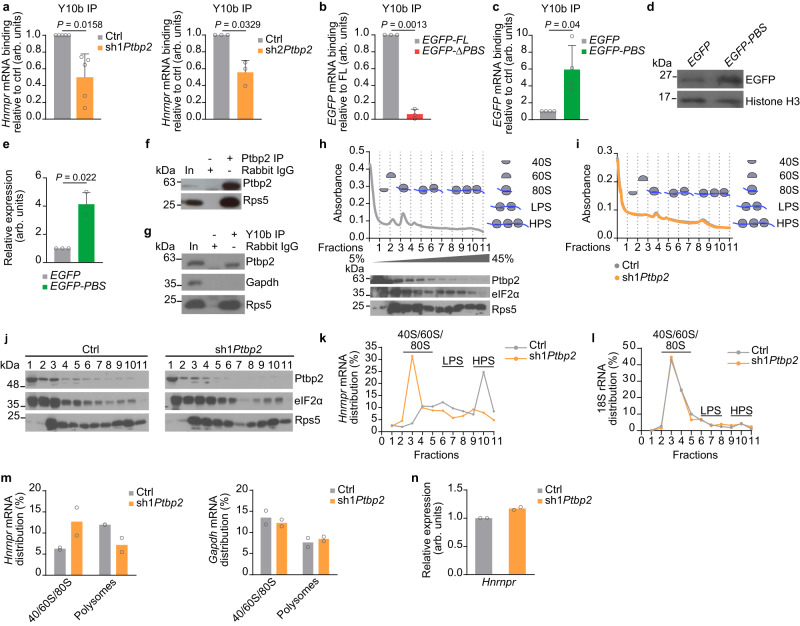
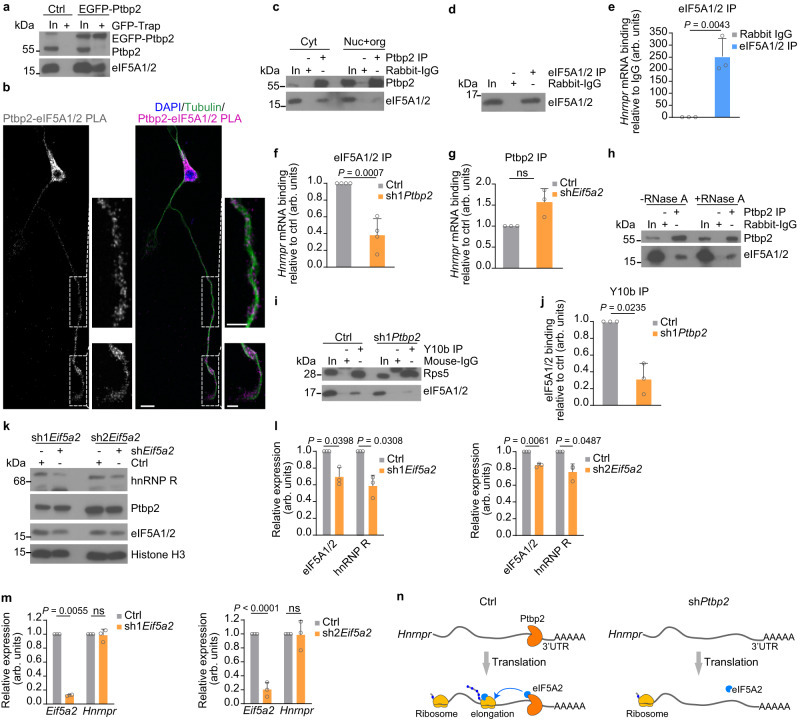
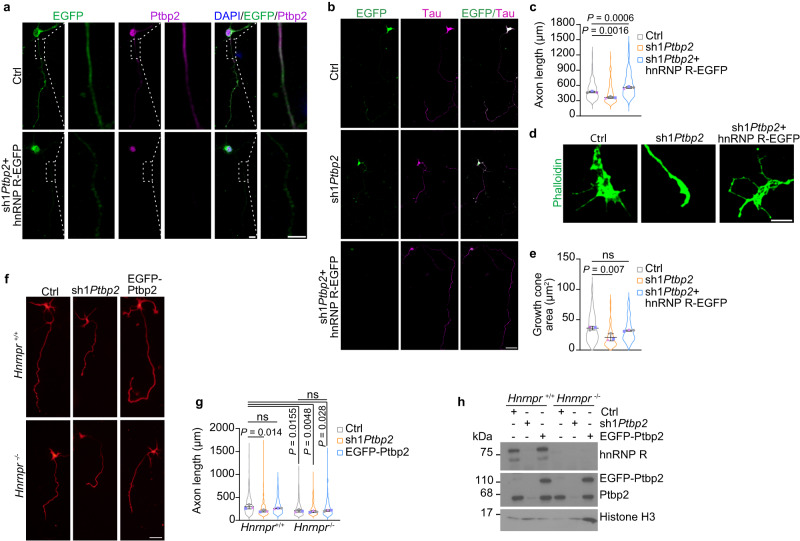
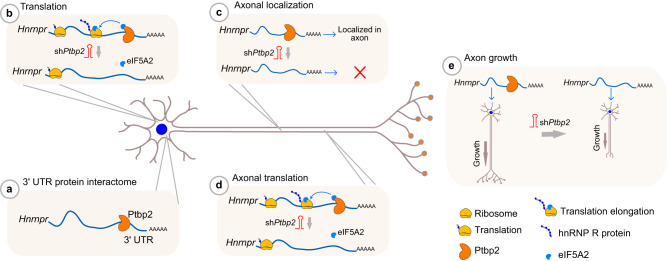
The neuronal RNA-binding protein Ptbp2 regulates neuronal differentiation by modulating alternative splicing programs in the nucleus. Such programs contribute to axonogenesis by adjusting the levels of protein isoforms involved in axon growth and branching. While its functions in alternative splicing have been described in detail, cytosolic roles of Ptbp2 for axon growth have remained elusive. Here, we show that Ptbp2 is located in the cytosol including axons and growth cones of motoneurons, and that depletion of cytosolic Ptbp2 affects axon growth. We identify Ptbp2 as a major interactor of the 3' UTR of Hnrnpr mRNA encoding the RNA-binding protein hnRNP R. Axonal localization of Hnrnpr mRNA and local synthesis of hnRNP R protein are strongly reduced when Ptbp2 is depleted, leading to defective axon growth. Ptbp2 regulates hnRNP R translation by mediating the association of Hnrnpr with ribosomes in a manner dependent on the translation factor eIF5A2. Our data thus suggest a mechanism whereby cytosolic Ptbp2 modulates axon growth by fine-tuning the mRNA transport and local synthesis of an RNA-binding protein.


Conflict of interest statement

The authors declare no competing interests.

Figures

Fig. 1
Fig. 1. Ptbp2 modulates axon growth in cultured motoneurons.
a Ptbp2 mRNA expression detected by qPCR in the spinal cord of mice at different time points. Nefl mRNA was used for normalization. One-way ANOVA with Dunnett’s multiple comparisons test. Data are mean ± standard deviation (s.d.) of n = 3 biological replicates. b Immunoblot analysis of Ptbp2 in control and Ptbp2-depleted motoneurons at DIV 6. Histone H3 was used as a loading control. c Quantitative analysis of Ptbp2 immunoblots as shown in (b). Two-tailed one-sample t test. Data are mean ± s.d. of n = 4 (sh1Ptbp2) and n = 3 (sh2Ptbp2) biological replicates. d Quantification of motoneuron survival at DIV 6. Two-way ANOVA with Sidak’s multiple comparisons tests. ns, not significant (P > 0.05). Data are mean ± s.d. of n = 3 biological replicates. e Representative images of motoneurons transduced with a control lentivirus (Ctrl), a lentivirus expressing a shRNA targeting Ptbp2 (sh1Ptbp2) and rescued motoneurons transduced with a lentivirus co-expressing sh1Ptbp2 and knockdown-resistant EGFP-Ptbp2 (sh1Ptbp2 + EGFP-Ptbp2) at DIV 6. Motoneurons were stained against tau as a specific axonal marker. Scale bar, 10 µm. f SuperPlots representing the quantification of axon lengths. One-way ANOVA with Tukey’s multiple comparisons test or unpaired two-tailed Student’s t test. Data are mean ± s.d. of n = 3 biological replicates. Representative images (g) and SuperPlots (h) of growth cone sizes of control, Ptbp2 knockdown and rescued motoneurons at DIV 6. Motoneurons were stained with phalloidin. Scale bar, 5 µm. One-way ANOVA with Tukey’s multiple comparisons test or unpaired two-tailed Student’s t test. Data are mean ± s.d. of n = 3 biological replicates. i Synapsin1 immunostaining in growth cones of control and Ptbp2-depleted motoneurons at DIV 6. Scale bar, 5 µm. j SuperPlots of Synapsin1 immunosignals in growth cones. Unpaired two-tailed Student’s t test. Data are mean ± s.d. of n = 3 biological replicates. k Immunofluorescence imaging of Piccolo in growth cones of control and Ptbp2 knockdown motoneurons. l SuperPlots of Piccolo immunosignals in growth cones. Unpaired two-tailed Student’s t test. Data are mean ± s.d. of n = 3 biological replicates. Source data are provided as a Source Data file.
Fig. 2
Fig. 2. Cytosolic Ptbp2 is involved in axon growth.
a Representative immunoblot of Ptbp2 levels in subcellular fractions of motoneurons. Cyt, cytosol; Nuc+org, nuclear soluble proteins and organelles; Chr, chromatin-associated proteins. b Quantification of Western blot signals in (a). Data are mean ± s.d. of n = 3 biological replicates. c Representative immunofluorescence images showing the distribution of Ptbp2 in the soma, axon and growth cone of a cultured motoneuron at DIV 6. Scale bars, 10 µm (soma), 2 µm (axon) and 5 µm (growth cone). The images are representative of at least three biological replicates. d Schematic representation of the constructs expressing full-length (FL) Ptbp2, or Ptbp2 harboring a deletion of the nuclear localization signal (NLS). Red bars represent the NLS located at the N-terminus of Ptbp2. e Immunoblot analysis of motoneurons transduced with control lentivirus, or lentiviruses expressing sh1Ptbp2 or an EGFP-Ptbp2 NLS deletion mutant together with sh1Ptbp2 (sh1Ptbp2 + EGFP-Ptbp2-ΔNLS). The immunoblot is representative of three biological replicates. f Immunofluorescence imaging of EGFP in motoneurons. Scale bars, 10 µm. The images are representative of three biological replicates. g Representative images of control, Ptbp2-depleted motoneurons and rescued motoneurons transduced with a lentivirus expressing sh1Ptbp2 + EGFP-Ptbp2-ΔNLS at DIV 6. Motoneurons were immunostained against tau. Scale bar, 10 µm. h SuperPlots representing the quantification of axon lengths. One-way ANOVA with Tukey’s multiple comparisons test. Data are mean ± s.d. of n = 3 biological replicates. Representative images (i) and SuperPlots (j) of growth cone sizes of control, Ptbp2 knockdown and rescued motoneurons at DIV 6. Motoneurons were stained with phalloidin. Scale bar, 5 µm. One-way ANOVA with Tukey’s multiple comparisons test. Data are mean ± s.d. of n = 3 biological replicates. Source data are provided as a Source Data file.
Fig. 3
Fig. 3. Ptbp2 interacts with the Hnrnpr 3′ UTR.
a Immunoblot analysis of Ptbp2 and Ptbp1 protein levels in NSC-34 cells and mouse motoneurons (MN). Gapdh was used as loading control. The immunoblot is representative of two biological replicates. b Coomassie-stained SDS-PAGE gel following pulldown with biotinylated sense or antisense control Hnrnpr 3′ UTR RNA. The gel is representative of at least two biological replicates. c Volcano plots of the Hnrnpr 3′ UTR interactome following pulldown with sense Hnrnpr 3′ UTR and antisense control from NSC-34 cell lysate. Uniprot IDs in brackets specify protein isoforms in cases of multiple detected isoforms. n = 4 biological replicates. d Immunoblot analysis of Ptbp2 following pulldown with sense or antisense control Hnrnpr 3′ UTR RNA from NSC-34 lysate. In, input. e Quantification of the pulldown of Ptbp2 in (d). Data are shown as enrichment of Ptbp2 by pulldown with sense RNA as compared to the antisense RNA control. Unpaired two-tailed Student’s t test. Data are mean ± s.d. of n = 3 biological replicates. f Immunoprecipitation of Ptbp2 from NSC-34 cell lysate. Immunoprecipitation with rabbit IgG antibody was used as a control. g qPCR analysis of Hnrnpr co-immunoprecipitated with anti-Ptbp2 from NSC-34 cells. Two-tailed one-sample t test. Data are mean ± s.d. of n = 3 biological replicates. h Immunoblot of Ptbp2 immunoprecipitation from motoneuron lysate. i qPCR analysis of Hnrnpr co-precipitated by anti-Ptbp2 from motoneurons. Two-tailed one-sample t test. Data are mean ± s.d. of n = 3 biological replicates. j Schematic of the EGFP reporter constructs used to investigate the specificity of Ptbp2 binding with the Hnrnpr 3′ UTR. EGFP-FL, full length; EGFP-ΔPBS, deletion mutant; PBS, Ptbp2 binding site. k qPCR analysis of EGFP co-precipitated by anti-Ptbp2 from motoneurons transduced with lentiviruses for expression of Hnrnpr 3′ UTR EGFP-FL and EGFP-ΔPBS constructs. Two-tailed one-sample t test. Data are mean ± s.d. of n = 4 biological replicates. l Quantification of abundance of the three 3′ UTR isoforms of Hnrnpr mRNA in control and Ptbp2-depleted NSC-34 cells and motoneurons. Two-way ANOVA with Sidak’s multiple comparisons tests. Data are mean ± s.d. of n = 3 biological replicates. Source data are provided as a Source Data file.
Fig. 4
Fig. 4. Ptbp2 regulates axonal localization of Hnrnpr mRNA in motoneurons.
a Representative images showing Ptbp2 immunofluorescence and Hnrnpr FISH in cultured motoneurons at DIV 6. An antibody against Tubulin was used for visualization of motoneuron morphology. Arrowheads indicate colocalization of Ptbp2 and Hnrnpr in granules. Scale bars, 10 μm and 1 µm (magnified areas). b Fluorescence intensity profiles of Ptbp2 and Hnrnpr at the location indicated by arrow 4 in (a). c Quantification of the percentage of Hnrnpr+Ptbp2+ punctae in motoneurons. Data are mean ± s.d. of n = 3 biological replicates. d Schematic of a microfluidic chamber for compartmentalized motoneuron cultures allowing separation of the somatodendritic from axonal compartments. e Immunofluorescence analysis of motoneurons cultured in a microfluidic chamber using antibodies against tau and ChAT. f qPCR analysis of Hnrnpr co-precipitated by anti-Ptbp2 from somatodendritic and axonal compartments. Two-tailed one-sample t test. Data are mean ± s.d. of n = 3 biological replicates. g Representative images of Ptbp2 immunofluorescence staining and Hnrnpr FISH in control, Ptbp2-depleted and rescued motoneurons at DIV 6. h SuperPlots of the number of Hnrnpr-positive punctae in the whole cell, cytoplasm of the soma, nucleus, axon and dendrite of control, Ptbp2 knockdown and rescued motoneurons. One-way ANOVA with Tukey’s multiple comparisons test. Data are mean ± s.d. of n = 3 biological replicates. i qPCR analysis of Ptbp2 and Hnrnpr mRNA from somatodendritic and axonal RNA of compartmentalized control and Ptbp2-depleted motoneurons at DIV 6. Statistical analysis was performed using a two-tailed one-sample t test. Data are mean ± s.d. of n = 2 (Ctrl) and n = 3 (sh1Ptbp2) independent experiments. Source data are provided as a Source Data file.
Fig. 5
Fig. 5. Ptbp2 regulates the axonal translation of Hnrnpr mRNA in motoneurons.
a Schematic representing the binding sites for anti-hnRNP R antibodies targeted against the N- and C-terminus (blue and green, respectively). In Puro-PLA experiments, close proximity between an N-terminal hnRNP R antibody and an anti-puromycin antibody (orange) allows signal amplification. b Representative images of Puro-PLA signal in cultured motoneurons at DIV 7 using either N-terminal (N-term) or C-terminal (C-term) anti-hnRNP R antibodies. Labeling without puromycin or with puromycin in the presence of cycloheximide (CHX) was used as controls. Boxed regions are magnified to the right of each image. Motoneurons were immunostained for Tubulin to visualize their morphology and nuclei were labeled with DAPI. Scale bars, 10 µm and 5 µm (magnified areas). The images are representative of three biological replicates. c Ratio of Puro-PLA signal obtained with an N-terminal anti-hnRNP R antibody to Puro-PLA with a C-terminal antibody. Two-tailed one-sample t-test. Data are mean ± s.d. of n = 3 biological replicates. d Relative levels of Hnrnpr and Actb as a control in fractions of somatodendritic and axonal lysate subjected to sucrose density gradient ultracentrifugation. Data are mean of n = 2 biological replicates. e Puro-PLA of hnRNP R of control and Ptbp2-depleted motoneurons. Scale bars, 10 µm and 5 µm (magnified areas). f Quantification of relative Puro-PLA intensity in somata and the number of Puro-PLA punctae in 50 µm of axons of control and Ptbp2 knockdown motoneurons. Unpaired two-tailed Student’s t test. Data are mean ± s.d. of n = 3 biological replicates. g Quantification of Hnrnpr and Ptbp2 mRNA levels by qPCR in control and Ptbp2-depleted motoneurons at DIV 6. 18S rRNA was used as housekeeping transcript. Two-tailed one-sample t test. Data are mean ± s.d. of n = 5 (sh1Ptbp2) and n = 3 (sh2Ptbp2) biological replicates. h Immunoblot analysis of hnRNP R and Ptbp2 in control, Ptbp2-depleted and rescued motoneurons at DIV 6. Histone H3 was used as a loading control. i Quantitative analysis of Western blots as shown in (h) for Ptbp2 and hnRNP R. Two-tailed one-sample t test. Data are mean ± s.d. of n = 3 biological replicates. j Immunoblot analysis of hnRNP R and Ptbp2 in control and Ptbp2-depleted motoneurons. k Quantitative analysis of Western blots as shown in (j) for Ptbp2 and hnRNP R. Two-tailed one-sample t test. Data are mean ± s.d. of n = 3 biological replicates. Source data are provided as a Source Data file.
Fig. 6
Fig. 6. hnRNP R translation efficiency is regulated by Ptbp2 in motoneurons.
a qPCR analysis of Hnrnpr co-precipitated by the anti-ribosomal RNA antibody Y10b from control and Ptbp2 depleted-motoneurons. Two-tailed one-sample t test. Data are mean ± s.d. of n = 5 (sh1Ptbp2) and n = 3 (sh2Ptbp2) biological replicates. b qPCR analysis of EGFP co-precipitated by Y10b from motoneurons transduced with lentiviruses for expression of EGFP fused to full-length (EGFP-FL) or ΔPBS Hnrnpr 3′ UTR (EGFP-ΔPBS). Two-tailed one-sample t test. Data are mean ± s.d. of n = 3 biological replicates. c qPCR analysis of EGFP co-precipitated by Y10b from motoneurons transduced with lentiviruses for expression of EGFP control or EGFP fused to the Ptbp2 binding site (PBS) present in the Hnrnpr 3′ UTR. Two-tailed one-sample t test. Data are mean ± s.d. of n = 4 biological replicates. d Immunoblot analysis of EGFP in control motoneurons and motoneurons transduced with a lentivirus expressing EGFP-PBS at DIV 6. Histone H3 was used as a loading control. e Quantitative analysis of Western blots as shown in (d) for EGFP protein. Two-tailed one-sample t test. Data are mean ± s.d. of n = 3 biological replicates. f Immunoblot analysis of Rps5 co-immunoprecipitated by anti-Ptbp2 from motoneurons. The immunoblot is representative of three biological replicates. g Co-immunoprecipitation of Ptbp2 by Y10b from motoneurons. Rps5 co-precipitation was used as a specificity control. The immunoblot is representative of two biological replicates. h Polysome analysis of motoneuron lysates by sucrose density gradient ultracentrifugation. LPS, light polysome fractions; HPS, heavy polysome fractions. Immunoblot analysis of Ptbp2, Rps5 and eIF2α. The immunoblot is representative of two biological replicates. i Polysome profiles of control and Ptbp2-depleted motoneurons. Absorbance profile is representative of two biological replicates. j Immunoblot analysis of Ptbp2, Rps5 and eIF2α across fractions from control and Ptbp2 knockdown motoneurons. For fractions 1 and 2, 10% were loaded for analysis. The immunoblot is representative of two biological replicates. Relative levels of Hnrnpr (k) and 18S rRNA (l) in fractions of control and Ptbp2-depleted motoneurons. Data are the mean of n = 2 biological replicates. m Quantification of the distribution of Hnrnpr and Gapdh mRNAs between ribosome subunits and polysomes in control and Ptbp2-depleted motoneurons. Data are mean of n = 2 biological replicates. n Quantification of the total levels of Hnrnpr mRNA. 18S rRNA was used for normalization. Data are mean of n = 2 biological replicates. Source data are provided as a Source Data file.
Fig. 7
Fig. 7. Ptbp2 regulates hnRNP R translation through interaction with eIF5A.
a Co-immunoprecipitation of eIF5A1/2 by GFP-Trap from motoneurons transduced with lentiviruses for expression of EGFP or EGFP-Ptbp2. The immunoblots are representative of two biological replicates. b Representative images of PLA signal in motoneurons at DIV 6 using anti-Ptbp2 and anti-eIF5A1/2 antibodies. Scale bars, 10 µm and 5 µm (magnified areas). The images are representative of three biological replicates. c Immunoblot analysis of eIF5A1/2 co-immunoprecipitated by anti-Ptbp2 from subcellular fractions of motoneurons. The immunoblots are representative of three biological replicates. d Immunoblot analysis of eIF5A1/2 immunoprecipitation from motoneurons. e qPCR analysis of Hnrnpr co-precipitated by anti-eIF5A1/2 from motoneurons. Two-tailed one-sample t test. Data are mean ± s.d. of n = 3 biological replicates. f qPCR analysis of Hnrnpr co-precipitated by anti-eIF5A/2 from control and Ptbp2 knockdown motoneurons. Two-tailed one-sample t test. Data are mean ± s.d. of n = 4 biological replicates. g qPCR analysis of Hnrnpr co-precipitated by anti-Ptbp2 from control and eIF5A2 knockdown motoneurons. Two-tailed one-sample t test. Data are mean ± s.d. of n = 3 biological replicates. h Co-immunoprecipitation of eIF5A1/2 by anti-Ptbp2 from motoneuron lysate treated with RNase A for 15 min. The immunoblot is representative of three biological replicates. i Co-immunoprecipitation of eIF5A1/2 by Y10b from control and Ptbp2-depleted motoneurons. j Quantification of eIF5A1/2 co-purification by Y10b in (i). Two-tailed one-sample t test. Data are mean ± s.d. of n = 3 biological replicates. k Immunoblot analysis of hnRNP R, Ptbp2 and eIF5A1/2 in control and eIF5A2-depleted motoneurons at DIV 6. Histone H3 was used as a loading control. The immunoblot is representative of three biological replicates. l Quantification of Western blot data in (k). Two-tailed one-sample t test. Data are mean ± s.d. of n = 3 biological replicates. m Quantification of Hnrnpr and Eif5a2 mRNA levels by qPCR in control and eIF5A2-depleted motoneurons. 18S rRNA was used for normalization. Two-tailed one-sample t test. Data are mean ± s.d. of n = 3 biological replicates. n Schematic representation of hnRNP R translation regulation by Ptbp2 through association with eIF5A2. Source data are provided as a Source Data file.
Fig. 8
Fig. 8. The function of Ptbp2 in axon growth is dependent on hnRNP R.
a Representative images of control and Ptbp2-depleted motoneurons expressing hnRNP R-EGFP (sh1Ptbp2+hnRNP R-EGFP) at DIV 7 immunostained for EGFP and Ptbp2. Scale bar, 10 µm and 5 µm (magnified areas). The images are representative of three biological replicates. b Representative images of control and Ptbp2-depleted motoneurons, and of Ptbp2-depleted motoneurons expressing hnRNP R-EGFP at DIV 7. Motoneurons were immunostained against tau and EGFP. Scale bar, 50 µm. c SuperPlots of axon length measurements. One-way ANOVA with Tukey’s multiple comparisons test. Data are mean ± s.d. of n = 3 biological replicates. Representative images (d) and SuperPlots (e) of growth cone sizes of control and Ptbp2 knockdown motoneurons, and of Ptbp2-depleted motoneurons expressing hnRNP R-EGFP at DIV 6. Motoneurons were stained with phalloidin. Scale bar, 5 µm. One-way ANOVA with Tukey’s multiple comparisons test. Data are mean ± s.d. of n = 3 biological replicates. f Tau immunostaining of cultured Hnrnpr+/+ and Hnrnpr-/- motoneurons at DIV 6. Scale bar, 50 µm. g SuperPlots of axon lengths. One-way ANOVA with Tukey’s multiple comparisons test. Data are mean ± s.d. of n = 3 biological replicates. h Immunoblot analysis of Ptbp2 and hnRNP R in Hnrnpr+/+ and Hnrnpr−/− motoneurons transduced with control lentivirus, and in Hnrnpr+/+ and Hnrnpr-/- motoneurons transduced with lentiviruses for Ptbp2 knockdown or overexpression. The immunoblots are representative of three biological replicates. Source data are provided as a Source Data file.
Fig. 9
Fig. 9. Schematic summary of cytosolic Ptbp2 functions in axon growth.
a Ptbp2 binds to the 3′ UTR of Hnrnpr mRNA in motoneurons. b Ptbp2 regulates hnRNP R translation in association with eIF5A2. Ptbp2 controls axonal localization (c) and translation (d) of Hnrnpr mRNA in motoneurons. e Ptbp2 modulates axon growth of motoneurons.

Similar articles

Cited by

References

    1. Goldberg JL. How does an axon grow? Genes Dev. 2003;17:941–958. doi: 10.1101/gad.1062303. - DOI - PubMed
    1. Bonanomi D, Pfaff SL. Motor axon pathfinding. Cold Spring Harb. Perspect. Biol. 2010;2:a001735. doi: 10.1101/cshperspect.a001735. - DOI - PMC - PubMed
    1. Andreassi C, Crerar H, Riccio A. Post-transcriptional processing of mRNA in neurons: the vestiges of the RNA world drive transcriptome diversity. Front. Mol. Neurosci. 2018;11:304. doi: 10.3389/fnmol.2018.00304. - DOI - PMC - PubMed
    1. Dalla Costa I, et al. The functional organization of axonal mRNA transport and translation. Nat. Rev. Neurosci. 2021;22:77–91. doi: 10.1038/s41583-020-00407-7. - DOI - PMC - PubMed
    1. Vuong CK, Black DL, Zheng S. The neurogenetics of alternative splicing. Nat. Rev. Neurosci. 2016;17:265–281. doi: 10.1038/nrn.2016.27. - DOI - PMC - PubMed

Publication types

Substances

LinkOut - more resources