. 2023 Jul 12;14(1):4144.
doi: 10.1038/s41467-023-39581-4.

AI-designed NMR spectroscopy RF pulses for fast acquisition at high and ultra-high magnetic fields

Affiliations

AI-designed NMR spectroscopy RF pulses for fast acquisition at high and ultra-high magnetic fields

V S Manu et al. Nat Commun. .

Abstract

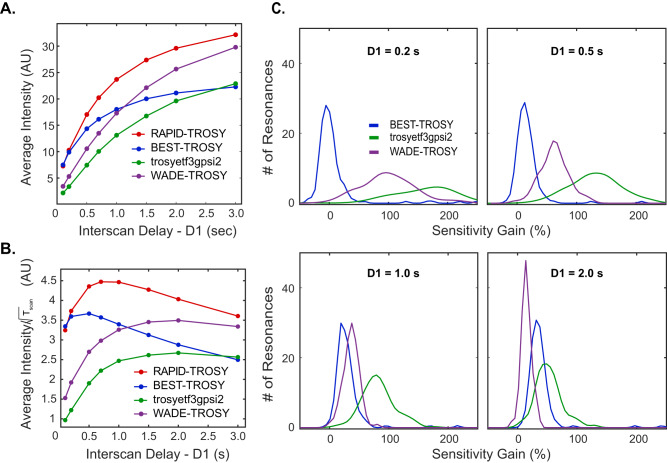
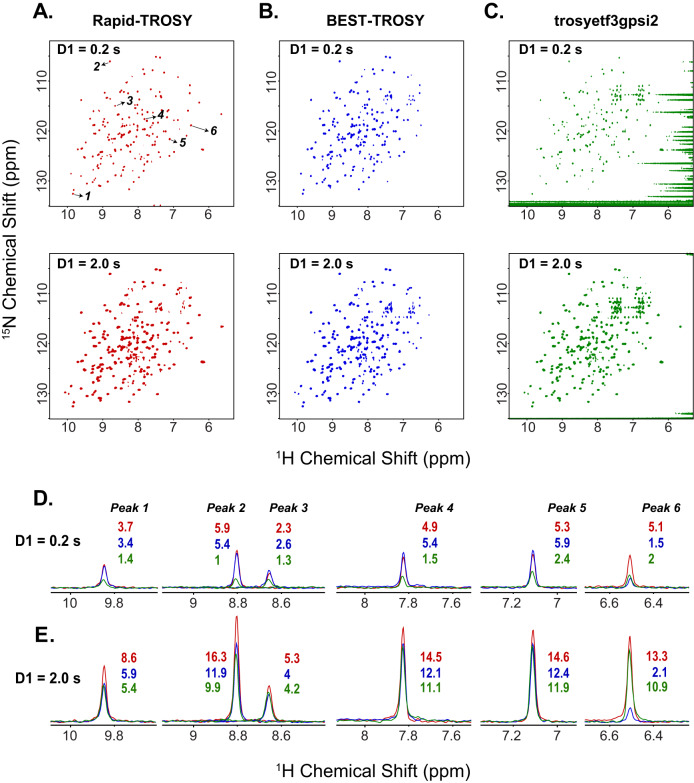
Nuclear magnetic resonance (NMR) spectroscopy is a powerful high-resolution tool for characterizing biomacromolecular structure, dynamics, and interactions. However, the lengthy longitudinal relaxation of the nuclear spins significantly extends the total experimental time, especially at high and ultra-high magnetic field strengths. Although longitudinal relaxation-enhanced techniques have sped up data acquisition, their application has been limited by the chemical shift dispersion. Here we combined an evolutionary algorithm and artificial intelligence to design 1H and 15N radio frequency (RF) pulses with variable phase and amplitude that cover significantly broader bandwidths and allow for rapid data acquisition. We re-engineered the basic transverse relaxation optimized spectroscopy experiment and showed that the RF shapes enhance the spectral sensitivity of well-folded proteins up to 180 kDa molecular weight. These RF shapes can be tailored to re-design triple-resonance experiments for accelerating NMR spectroscopy of biomacromolecules at high fields.


Conflict of interest statement

G.V. and M.V.S. are inventors of the GENETICS-AI software, patent US 11,221,384. G.V. is the founder of Kantika LLC. C.O. declares no competing interests.

Figures

Fig. 1
Fig. 1. RF pulse shapes designed using the GENETICS-AI software.
RF pulse amplitudes and shapes (left), offset responses (center), and J coupling evolution profiles (right) for A. the band-selective 90o pulse UA90ev1, B. the broadband 180o pulse URev1, C. the broadband 180o pulse URev2, and D. the band-selective 180o UARev1. The effects of the pulses on the magnetization components are color-coded in the graph with the offset response. The oscillations of the Mx and My components of the magnetization indicate the chemical shift evolution during the pulse. The J coupling evolution was calculated using the two spin operators, 2IxSz and 2IySz, during the pulse duration, with the UA90ev1 pulse starting from an initial magnetization ρinitial: Iz, the URev1 from ρinitial: Ix, the URev2 from ρinitial: Ix, and the UARev1 pulse from ρinitial: Ix. Note that pulsing on a single channel refocuses the J coupling evolution, whereas pulsing on both channels restores the J coupling evolution. The green traces indicate the offset response for ideal instantaneous pulses. The blue traces are the offset response for pulsing on a single channel (I or S), and the red traces are the offset response for pulsing on both channels (I and S). The duration and operational bandwidth of the pulses are reported in Supplementary Table 1, and the 2D response profiles are shown in Supplementary Fig. 1.
Fig. 2
Fig. 2. Pulse scheme for the [1H,15N] RAPID-TROSY experiment.
The pulses generated by the GENETICS-AI software for 1H and 15N channels are reported according to the optimized amplitude shapes generated. Open rectangular pulses in the 15N channel are 90° hard pulses and were not substituted in the original sequence. The pulse operations for the GENETICS-AI pulses are summarized in Table S1 and explained in the main text. The delay, Δ, associated with UARev1 is 0.75 times the length of the UARev1 pulse. The delay τ is equal to 1/(2JHN), where JHN is the coupling constant between 1H and 15N. The phase cycle φ1 = (y, −y, −x, x) for odd and φ1 = (−y, y, −x, x) for even t1 points. Receiver phase cycle φr = (x, −x, −y, y). The 1H magnetization of water (W) and aliphatic protons is kept along the z-axis throughout the pulse sequence. The amplitude of the gradient pulses, g1, g2, and g3, applied along the z-axis were 1.97, 2.96, and 3.29 Gauss.
Fig. 3
Fig. 3. Sensitivity comparison of the different TROSY schemes for RKIP.
A Buildup of the average sensitivity calculated for 187 amide peaks of U-15N labeled RKIP. B Sensitivity comparison of the different TROSY experiments as a function of the interscan delay. The average intensity was divided by the root square of the total scan duration, Tscan, which includes the duration of the pulse sequence, the acquisition time, and the interscan delay. C Sensitivity gain distribution of RAPID-TROSY for all the 187 resolved amide resonances of RKIP compared with the other three pulse sequences at different interscan delays. The sensitivity gain for each resonance is calculated using(IRAPIDI)/I, where IRAPID indicates the intensity of each RAPID-TROSY peak, and I indicates the intensity of the corresponding resonance in the other sequences.
Fig. 4
Fig. 4. Comparison of the performance of the different TROSY schemes with interscan delays of 0.2 and 2.0 s.
A RAPID-TROSY, B BEST-TROSY, and C conventional Bruker TROSY experiment (trosyetf3gpsi2). D, E 1D traces for the resonances 1–6 labeled in the A panel acquired with interscan delays of 0.2 and 2.0 s. The 1D spectra are analyzed at the same noise levels. The red, blue, and green 1D peaks correspond to the RAPID-TROSY, BEST-TROSY, and trosyetf3gpsi2 experiments.
Fig. 5
Fig. 5. Comparison of the different TROSY pulse sequences for MBP.
A RAPID-TROSY spectrum of U-15N labeled MBP with an interscan delay of 0.25 s. B Average intensity of the 279 amide peaks vs. interscan delay for the four TROSY pulse sequences. C Average intensity of the 139 low-intensity (lower half) peaks vs. interscan delay. D Sensitivity gain distribution of RAPID-TROSY for all resolved amide resonances compared with the other three pulse sequences at different interscan delays. The sensitivity gain for each resonance is calculated using(IRAPIDI)/I, where IRAPID indicates the intensity of each RAPID-TROSY peak, and I indicates the intensity of the corresponding resonance in the other sequences. All spectra at different interscan delays are shown in Supplementary Fig. 6.
Fig. 6
Fig. 6. Comparison of the different TROSY pulse sequences for RIIβ dimer.
A RAPID-TROSY of 1H,15N labeled PKA RIIβ dimer acquired with an interscan delay of 0.25 s. B Average intensity of the amide peaks vs. interscan delay for all resolved peaks (244); C Average intensity of the less intense peaks (122, lower half) vs. interscan delay. D Sensitivity gain distribution of RAPID-TROSY for all the resolved 390 amide resonances of RIIβ compared with the other three pulse sequences at different interscan delays. All spectra at different relaxation delays are shown in Supplementary Fig. 7.

References

    1. Wuthrich, K. NMR of Proteins And Nucleic Acids (Wiley, 1986).
    1. Pervushin K, Riek R, Wider G, Wuthrich K. Attenuated T2 relaxation by mutual cancellation of dipole-dipole coupling and chemical shift anisotropy indicates an avenue to NMR structures of very large biological macromolecules in solution. Proc. Natl. Acad. Sci. USA. 1997;94:12366–12371. doi: 10.1073/pnas.94.23.12366. - DOI - PMC - PubMed
    1. Xu Y, Matthews S. TROSY NMR spectroscopy of large soluble proteins. Top. Curr. Chem. 2013;335:97–119. doi: 10.1007/128_2011_228. - DOI - PubMed
    1. Rosenzweig R, Kay LE. Bringing dynamic molecular machines into focus by methyl-TROSY NMR. Annu. Rev. Biochem. 2014;83:291–315. doi: 10.1146/annurev-biochem-060713-035829. - DOI - PubMed
    1. Ruschak AM, Kay LE. Proteasome allostery as a population shift between interchanging conformers. Proc. Natl. Acad. Sci. USA. 2012;109:E3454–E3462. doi: 10.1073/pnas.1213640109. - DOI - PMC - PubMed

Publication types