. 2023 Jul 12;14(1):4154.
doi: 10.1038/s41467-023-39869-5.

Analysis of DIA proteomics data using MSFragger-DIA and FragPipe computational platform

Affiliations

Analysis of DIA proteomics data using MSFragger-DIA and FragPipe computational platform

Fengchao Yu et al. Nat Commun. .

Abstract

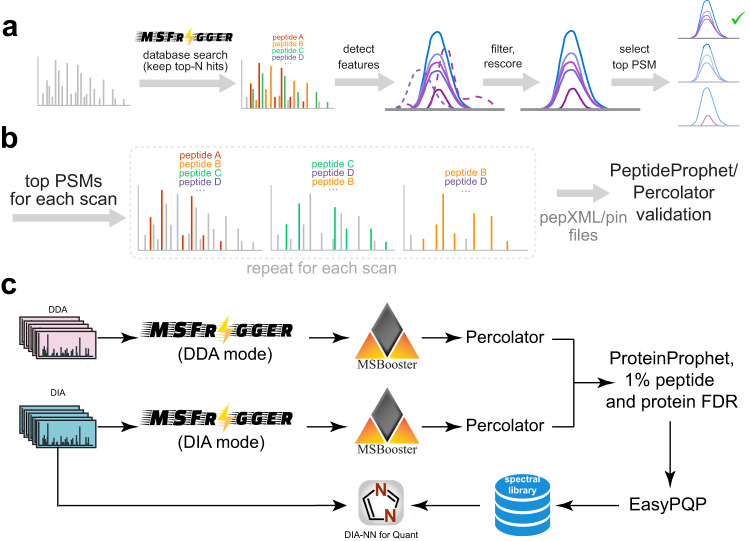
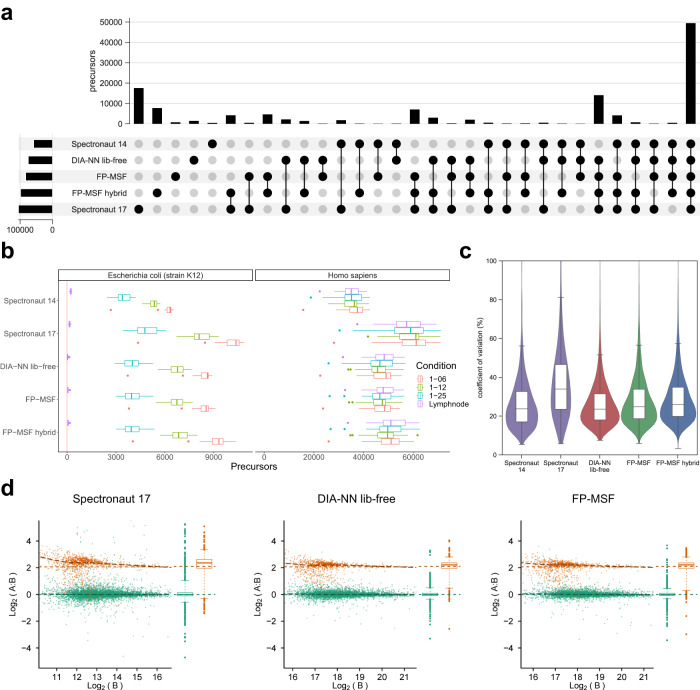
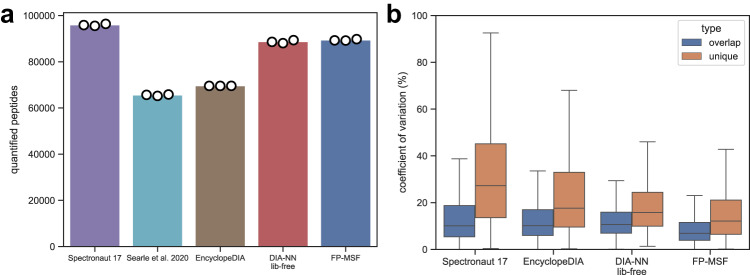
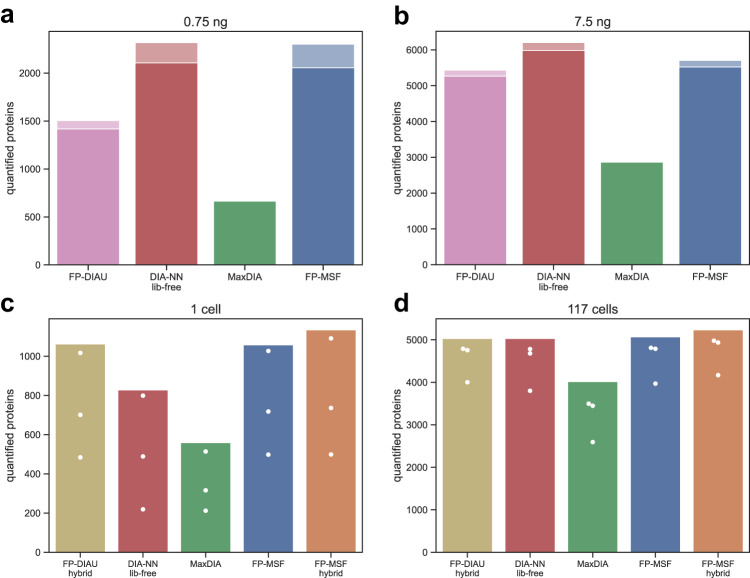
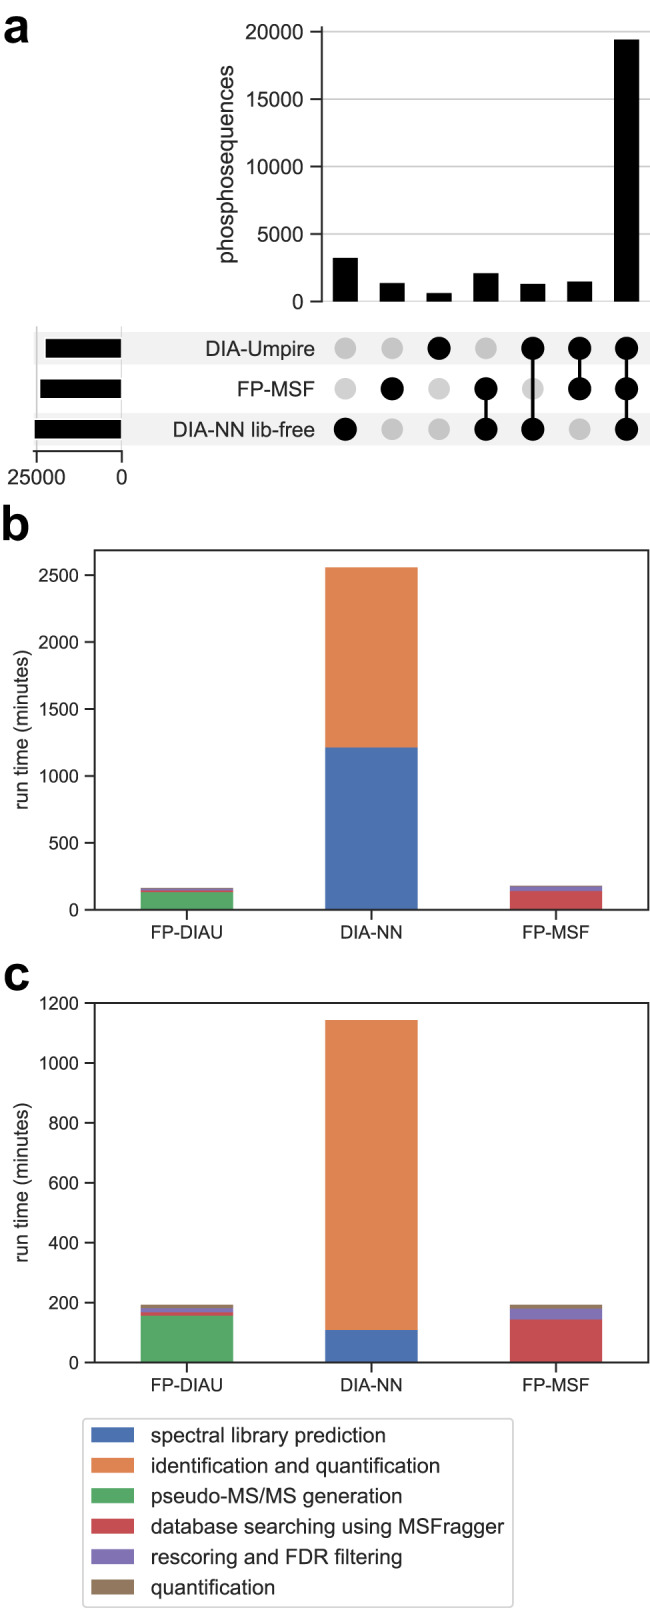
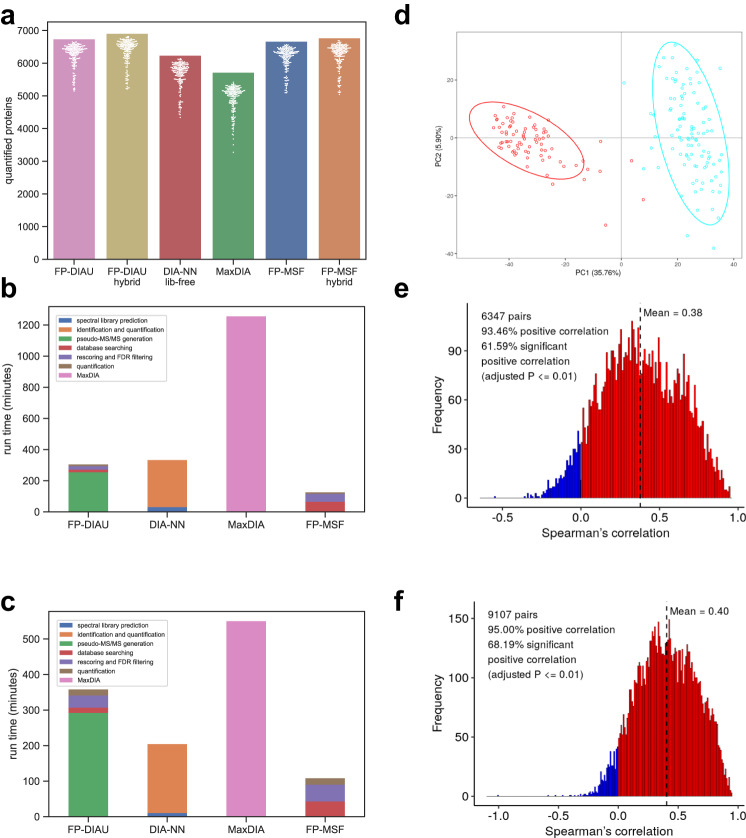
Liquid chromatography (LC) coupled with data-independent acquisition (DIA) mass spectrometry (MS) has been increasingly used in quantitative proteomics studies. Here, we present a fast and sensitive approach for direct peptide identification from DIA data, MSFragger-DIA, which leverages the unmatched speed of the fragment ion indexing-based search engine MSFragger. Different from most existing methods, MSFragger-DIA conducts a database search of the DIA tandem mass (MS/MS) spectra prior to spectral feature detection and peak tracing across the LC dimension. To streamline the analysis of DIA data and enable easy reproducibility, we integrate MSFragger-DIA into the FragPipe computational platform for seamless support of peptide identification and spectral library building from DIA, data-dependent acquisition (DDA), or both data types combined. We compare MSFragger-DIA with other DIA tools, such as DIA-Umpire based workflow in FragPipe, Spectronaut, DIA-NN library-free, and MaxDIA. We demonstrate the fast, sensitive, and accurate performance of MSFragger-DIA across a variety of sample types and data acquisition schemes, including single-cell proteomics, phosphoproteomics, and large-scale tumor proteome profiling studies.


Conflict of interest statement

The authors declare no competing interests.

Figures

Fig. 1
Fig. 1. Overview of MSFragger-DIA in FragPipe.
a DIA spectra are searched by MSFragger-DIA directly using precursor candidates determined from the isolation window. MSFragger-DIA builds MS1 and MS/MS spectral indexes, which are then used to detect extracted ion chromatogram (XIC) features for all fragment and precursor peaks in a peptide-spectrum match (PSM). Noisy fragment peaks are filtered out based on the XIC, PSMs are rescored, and only the top scoring PSM from each feature is kept. b Within each DIA MS/MS scan, a greedy method is used to remove matched peaks and iteratively rescore peptide candidates from the top-N list. Finally, MSFragger-DIA generates pepXML and pin files for PeptideProphet and Percolator to estimate the peptide probability in FragPipe. c Hybrid (combined DIA and DDA) data analysis workflow in FragPipe (“FP-MSF hybrid” in the main text). Both DDA and DIA data are used to build a combined spectral library. This spectral library is used to quantify peptides from the DIA data using DIA-NN.
Fig. 2
Fig. 2. Performance assessment of sensitivity, false discovery rate, precision, and accuracy using a benchmark dataset.
Source data are provided as a Source Data file. a Upset plot illustrating the quantified precursors. The precursors are from all four conditions of both H. sapiens and E. coli. b Box plots representing the counts of quantified precursors under four distinct conditions, each with a unique color. There are 4 independent conditions. Each condition consists of 23 single-shot DIA runs from 23 biological independent samples. The “Lymphnode” condition comprises samples from H. sapiens, while the remaining three conditions include both H. sapiens and E. coli spike-in samples. H. sapiens and E. coli precursors are displayed in separate panels. E. coli precursors in the “Lymphnode” condition are deemed false identifications. The box in each box plot captures the interquartile range (IQR), with the bottom and top edges representing the first (Q1) and third quartiles (Q3) respectively. The median (Q2) is marked by a horizontal line within the box. The whiskers extend to the minima and maxima within 1.5 times the IQR below Q1 or above Q3. Outliers, signified by individual dots, fall outside these bounds. c Violin plots showcasing the coefficient of variation (CV) based on E. coli precursors from the “1–06” condition. There are 23 replicates. Each violin plot contains an embedded box plot. The box plots’ edges, median, and whiskers are same as the previous ones. d Scatter plots depicting the relationship between protein log2 ratio and intensity, using proteins from the “1–06” (condition A) and “1–25” (condition B) conditions to compute log-ratios. There are 2 conditions. Each condition contains 23 replicates. E. coli proteins are colored orange, while H. sapiens proteins appear in green. Horizontal dashed lines indicate true log-ratios, while adjacent box plots display the marginal distribution of log-ratios on the right side of each scatter plot. The box plots’ edges, median, and whiskers are same as the previous ones.
Fig. 3
Fig. 3. Quantified peptides and coefficient of variation (CV) from the 2018-HeLa dataset.
Source data are provided as a Source Data file. a Bar plots of the quantified peptides. The bar height is the average number of three replicates. The white dots indicate the numbers from individual replicates. The results from the original publication (obtained using EncyclopeDIA version 0.8.3) are shown. We also re-analyzed the data using the latest EncyclopeDIA (version 2.12.30). b Box plots of peptide CVs. There are 3 single-shot DIA runs from 3 replicates. Blue box plots represent overlapping peptides shared among all tools, while brown box plots depict unique peptides quantified exclusively by each specific tool. The box in each box plot captures the IQR, with the bottom and top edges representing the Q1 and Q3 respectively. The median is marked by a horizontal line within the box. The whiskers extend to the minima and maxima within 1.5 times the IQR below Q1 or above Q3.
Fig. 4
Fig. 4. The number of quantified proteins from the low-input-cell and the single-cell datasets.
Source data are provided as a Source Data file. a, b Bar plots from analyzing the low-input-cell dataset with 0.75 ng and 7.5 ng of starting material. Proteins with missing values (zero intensities) were discarded. The dark color is from the proteins with CVs less than 20%, and the light color is from the proteins with CVs greater than or equal to 20%. c, d Same as above, for the single-cell dataset, for 1 cell and for 117 cell data.
Fig. 5
Fig. 5. The number of quantified phosphopeptide sequences and runtime for the melanoma-phospho dataset.
Source data are provided as a Source Data file. a An upset plot of the number of quantified phosphopeptide sequences. b The runtime analysis performed on a Windows desktop. c The runtime analysis performed on a Linux server.
Fig. 6
Fig. 6. Results from the ccRCC dataset.
Source data are provided as a Source Data file. a Bar plots of the number of quantified proteins in the ccRCC dataset. There are 187 independent biological samples. The bar height is the total number. The white dots are the numbers from individual runs. Proteins with more than 50% missing values are discarded. b The runtime of analyzing 20 runs of the ccRCC dataset on a Windows desktop. c The runtime of analyzing 20 runs on a Linux server. d PCA plot based on the FP-MSF hybrid results, showing tumor (blue) and normal (red) samples. e Histogram of Spearman’s correlation coefficients between the RNA-Seq and the DIA protein abundance data (FP-MSF hybrid pipeline). The adjusted p-value is from the two-sided test followed by the Benjamini-Hochberg procedure. f Histogram of the Spearman’s correlation coefficients between the RNA-Seq and the TMT DDA-based protein abundance data. The adjusted p-value is from the two-sided test followed by the Benjamini-Hochberg procedure.

Similar articles

Cited by

References

    1. Kitata, R. B., Yang, J. C. & Chen, Y. J. Advances in data-independent acquisition mass spectrometry towards comprehensive digital proteome landscape. Mass Spectrom. Rev. e21781 (2022). - PubMed
    1. Ludwig C, et al. Data-independent acquisition-based SWATH-MS for quantitative proteomics: a tutorial. Mol. Syst. Biol. 2018;14:e8126. doi: 10.15252/msb.20178126. - DOI - PMC - PubMed
    1. Robinson AE, et al. Lysine and arginine protein post-translational modifications by enhanced DIA libraries: quantification in murine liver disease. J. Proteome. Res. 2020;19:4163–4178. doi: 10.1021/acs.jproteome.0c00685. - DOI - PubMed
    1. Kitata RB, et al. A data-independent acquisition-based global phosphoproteomics system enables deep profiling. Nat. Commun. 2021;12:2539. doi: 10.1038/s41467-021-22759-z. - DOI - PMC - PubMed
    1. Steger M, et al. Time-resolved in vivo ubiquitinome profiling by DIA-MS reveals USP7 targets on a proteome-wide scale. Nat. Commun. 2021;12:5399. doi: 10.1038/s41467-021-25454-1. - DOI - PMC - PubMed

Publication types