. 2023 Jul 12;13(1):11294.
doi: 10.1038/s41598-023-36533-2.

Gut-microbiota in children and adolescents with obesity: inferred functional analysis and machine-learning algorithms to classify microorganisms

Affiliations

Gut-microbiota in children and adolescents with obesity: inferred functional analysis and machine-learning algorithms to classify microorganisms

Margherita Squillario et al. Sci Rep. .

Abstract

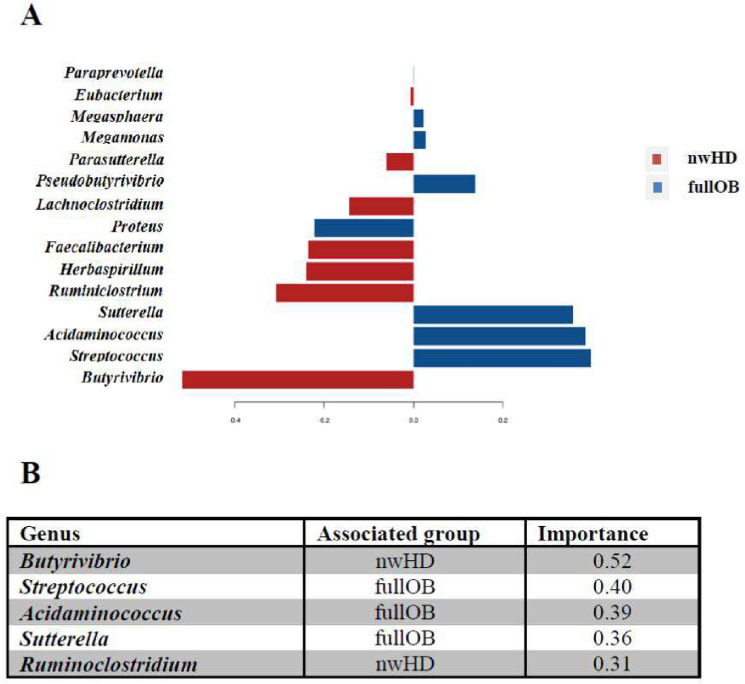
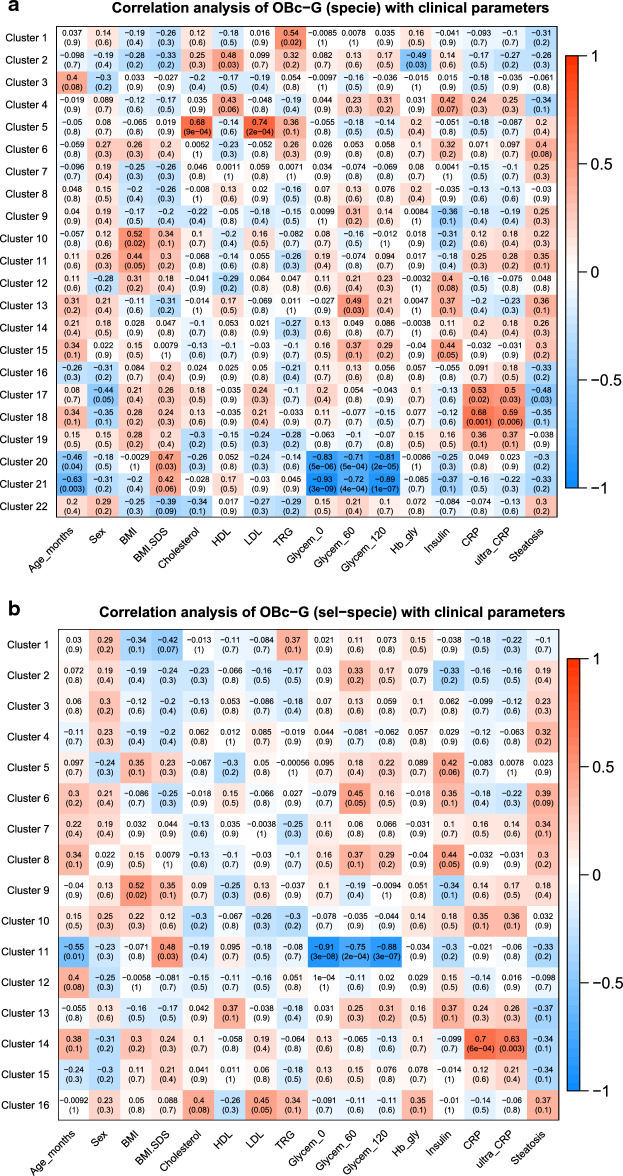
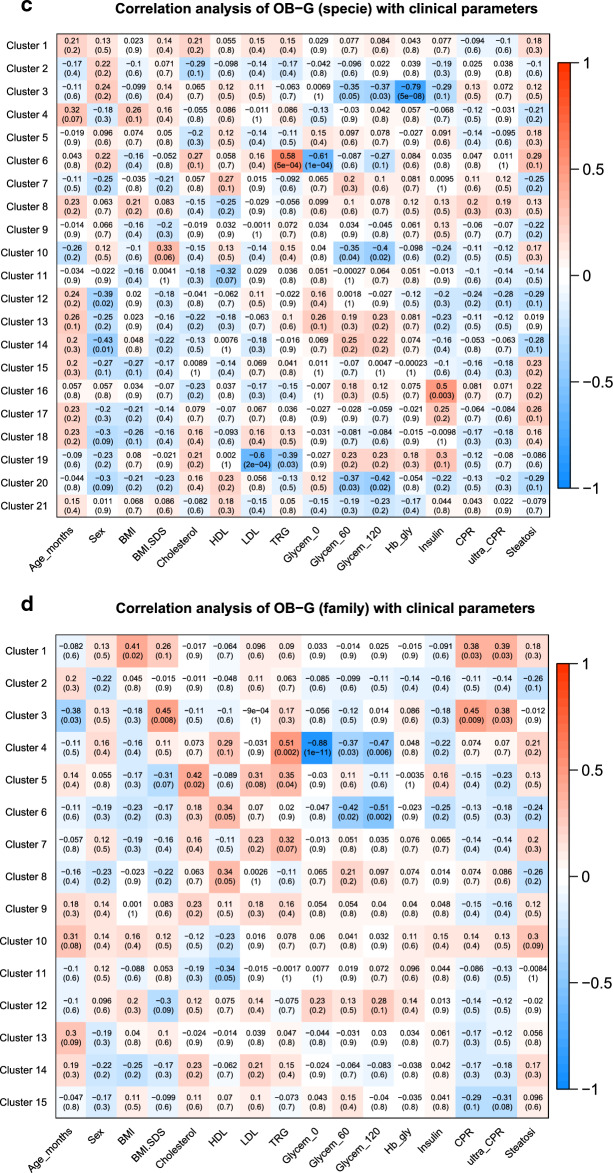
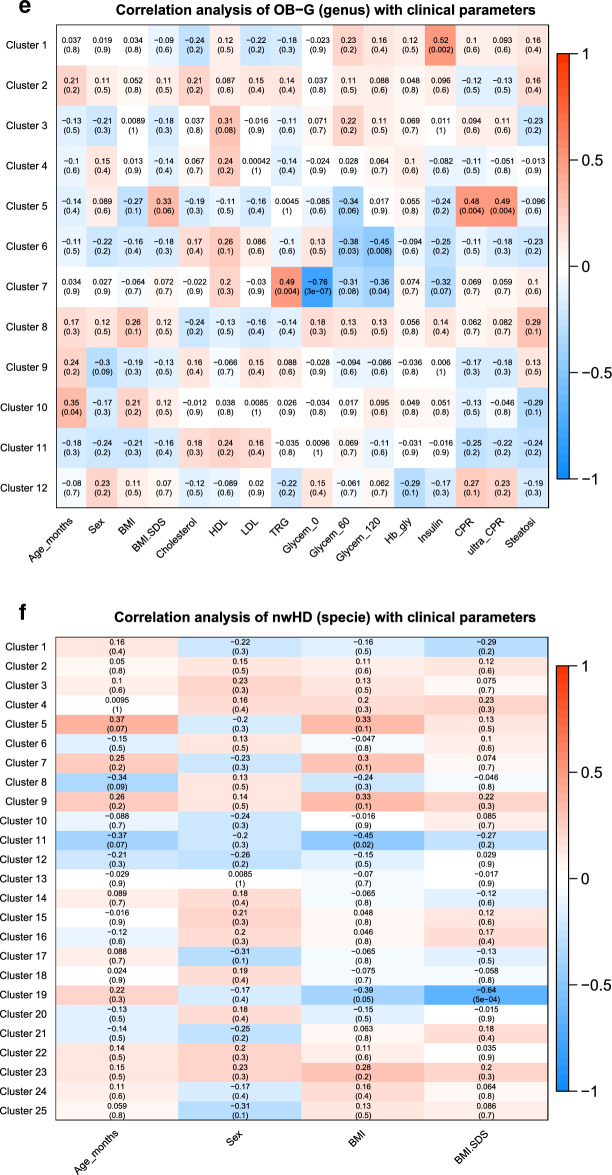
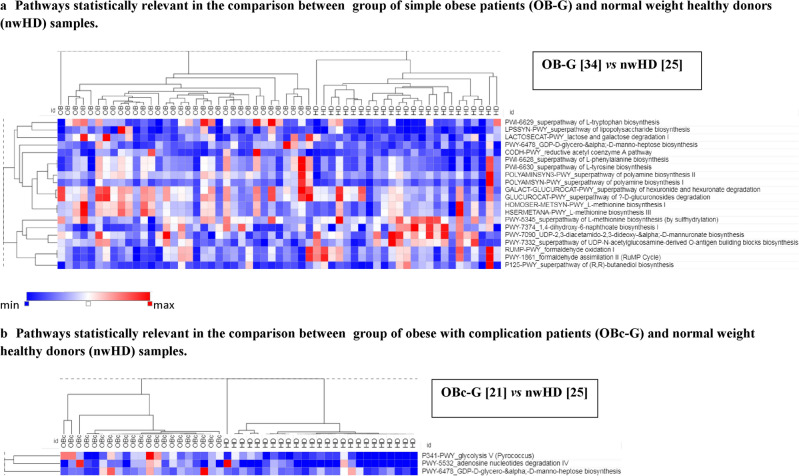
The fecal microbiome of 55 obese children and adolescents (BMI-SDS 3.2 ± 0.7) and of 25 normal-weight subjects, matched both for age and sex (BMI-SDS - 0.3 ± 1.1) was analysed. Streptococcus, Acidaminococcus, Sutterella, Prevotella, Sutterella wadsworthensis, Streptococcus thermophilus, and Prevotella copri positively correlated with obesity. The inferred pathways strongly associated with obesity concern the biosynthesis pathways of tyrosine, phenylalanine, tryptophan and methionine pathways. Furthermore, polyamine biosynthesis virulence factors and pro-inflammatory lipopolysaccharide biosynthesis pathway showed higher abundances in obese samples, while the butanediol biosynthesis showed low abundance in obese subjects. Different taxa strongly linked with obesity have been related to an increased risk of multiple diseases involving metabolic pathways related to inflammation (polyamine and lipopolysaccharide biosynthesis). Cholesterol, LDL, and CRP positively correlated with specific clusters of microbial in obese patients. The Firmicutes/Bacteroidetes-ratio was lower in obese samples than in controls and differently from the literature we state that this ratio could not be a biomarker for obesity.


Conflict of interest statement

The authors declare no competing interests.

Figures

Figure 1
Figure 1
The sPLS-DA results between fullOB (blue) vs nwHD (red) associated fecal microbiome. Loading plot from the sPLS-DA applied to the data to discriminate in the microbiome the Obese (fullOB) patient's associated taxa from the ones linked to controls (nwHD). Colors indicate the classes in which the median is maximum for each significant taxa (red) for regular weight Healthy Donors (nwHD) and blue for Obese (fullOB). The negative and positive values indicate positive and negative associations (importance) identified among the statistically significant identified taxa.
Figure 2
Figure 2
SparCC correlation networks. Taxa are connected by an edge when their correlation meets the p-value (< 0.05) and the correlation thresholds (0.3). The edge size reflects the magnitude of the correlation. These networks show significant positive (red edges) or negative (blue edges) Pearson correlations. The size of the rounded area for each node represents the abundance of that taxon, and the colors show the proportion of the associated group. (a) Green for normal-weight Healthy Donors (25 subjects) and orange for the complete case seriesof obese patients (55 cases). The MD-index was 1.5764, computed at the genus level for comparing the microbiome of obese patients over the normal weight controls. (b) Green for normal-weight Healthy Donors (25 subjects) and orange for the obese patients (34 cases) with no additional complication. The MD-index was 1.3993. (c) Green for normal-weight Healthy Donors (25 subjects) and orange for the obese with complication patients (21 cases). The MD-index was − 0.2786. In the analysis of the microbiome of plain obese patients (OB-G) compared with the microbial flora present in controls, there is a slightly unbalanced overrepresentation of some genera in the Obese samples rather than in control subjects. Whereas obese patients with complications showed an unbalance due to an underrepresentation of some genera confronted with the same population of controls (nwHD). Note that the MD index of a Eubiotic state is equal to 1.
Figure 3
Figure 3
Heatmaps of the correlations between taxa clusters and physiological parametersusing WGCNA. The heatmaps show the results of the multivariate clustering analysis considering the physiological parameters and the unadjusted p-values. The red rectangles highlight those correlations that remained statistically significant after the correction for multiple hypotheses with Benjamini–Hochberg. The colored bar aside from the heatmaps shows the color change associated with different Pearson correlation coefficients: the red color indicates positive correlations while the blue color indicates negative correlations. The “sel-specie” refers to the feature reduction step performed before the WGCNA analysis considering the most relevant specie found in our previous analysis (see “Methods” section).
Figure 3
Figure 3
Heatmaps of the correlations between taxa clusters and physiological parametersusing WGCNA. The heatmaps show the results of the multivariate clustering analysis considering the physiological parameters and the unadjusted p-values. The red rectangles highlight those correlations that remained statistically significant after the correction for multiple hypotheses with Benjamini–Hochberg. The colored bar aside from the heatmaps shows the color change associated with different Pearson correlation coefficients: the red color indicates positive correlations while the blue color indicates negative correlations. The “sel-specie” refers to the feature reduction step performed before the WGCNA analysis considering the most relevant specie found in our previous analysis (see “Methods” section).
Figure 4
Figure 4
Heatmaps of the significant inferred pathways identified with PICRUSt2. (a) Heat-map of the comparisons group of Obese with no complication (OB-G) vs controls (nwHD) and (b) group of Obese with complication (OBc-G) vs controls (nwHD).

Similar articles

Cited by

References

    1. Farpour-Lambert NJ, et al. Childhood obesity is a chronic disease demanding specific health care—A position statement from the Childhood Obesity Task Force (COTF) of the European Association for the Study of Obesity (EASO) Obes. Facts. 2015;8:342–349. doi: 10.1159/000441483. - DOI - PMC - PubMed
    1. Soderborg TK, Borengasser SJ, Barbour LA, Friedman JE. Microbial transmission from mothers with obesity or diabetes to infants: An innovative opportunity to interrupt a vicious cycle. Diabetologia. 2016;59:895–906. doi: 10.1007/s00125-016-3880-0. - DOI - PMC - PubMed
    1. Lascar N, et al. Type 2 diabetes in adolescents and young adults. Lancet Diabetes Endocrinol. 2018;6:69–80. doi: 10.1016/S2213-8587(17)30186-9. - DOI - PubMed
    1. Gao X, et al. A study of the correlation between obesity and intestinal flora in school-age children. Sci. Rep. 2018;8:14511. doi: 10.1038/s41598-018-32730-6. - DOI - PMC - PubMed
    1. Hu HJ, et al. Obesity alters the microbial community profile in Korean adolescents. PLoS ONE. 2015;10:e0134333. doi: 10.1371/journal.pone.0134333. - DOI - PMC - PubMed

Publication types

Substances