. 2023 Jul 12;14(1):4141.
doi: 10.1038/s41467-023-39849-9.

Abrupt perturbation and delayed recovery of the vaginal ecosystem following childbirth

Affiliations

Abrupt perturbation and delayed recovery of the vaginal ecosystem following childbirth

Elizabeth K Costello et al. Nat Commun. .

Erratum in

Abstract

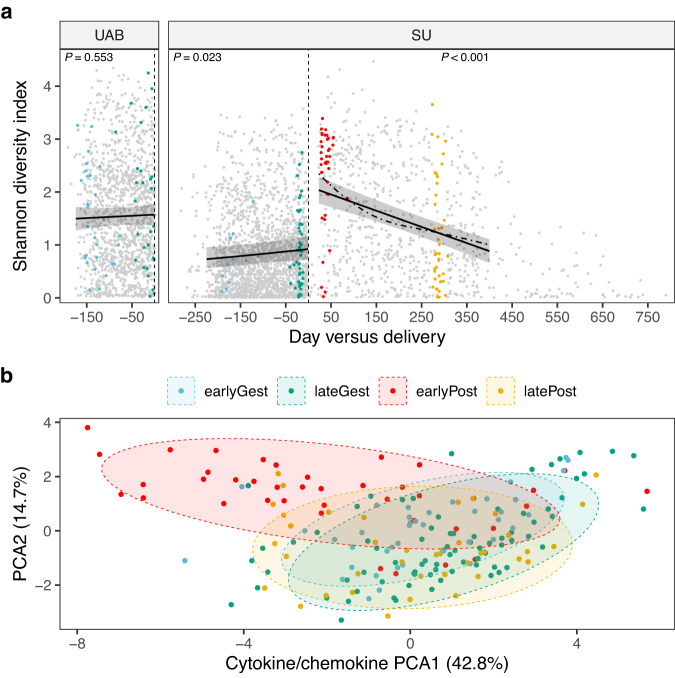
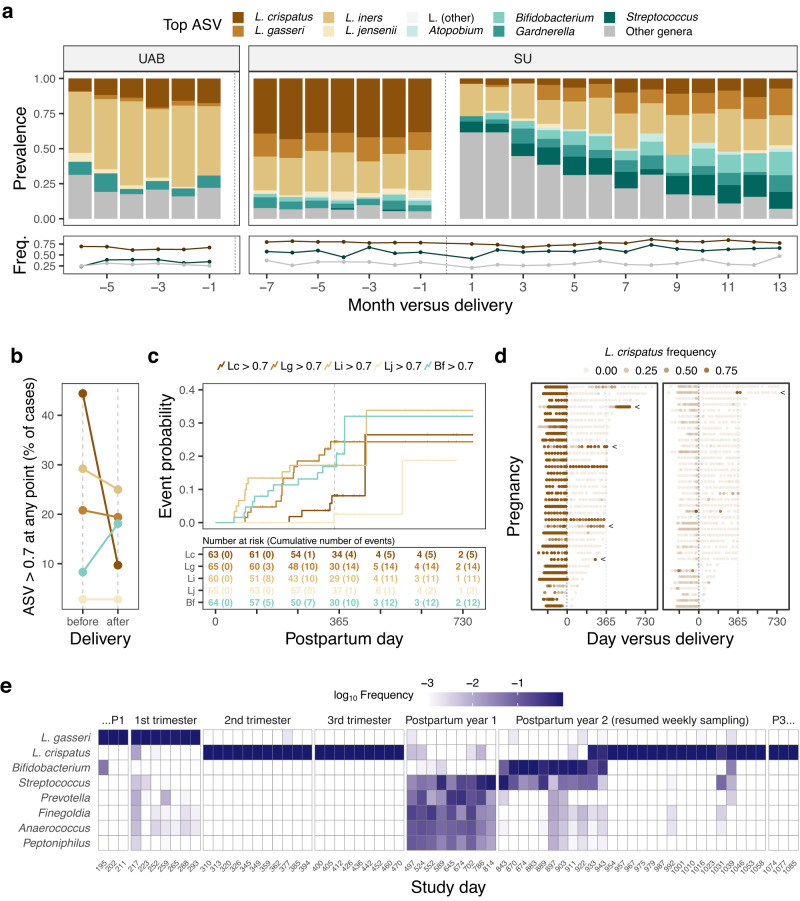
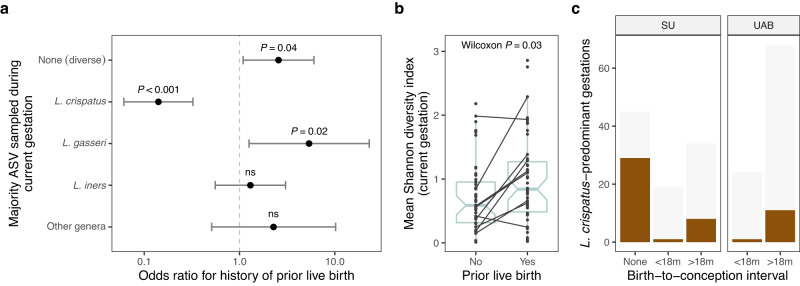
The vaginal ecosystem is closely tied to human health and reproductive outcomes, yet its dynamics in the wake of childbirth remain poorly characterized. Here, we profile the vaginal microbiota and cytokine milieu of participants sampled longitudinally throughout pregnancy and for at least one year postpartum. We show that delivery, regardless of mode, is associated with a vaginal pro-inflammatory cytokine response and the loss of Lactobacillus dominance. By contrast, neither the progression of gestation nor the approach of labor strongly altered the vaginal ecosystem. At 9.5-months postpartum-the latest timepoint at which cytokines were assessed-elevated inflammation coincided with vaginal bacterial communities that had remained perturbed (highly diverse) from the time of delivery. Time-to-event analysis indicated a one-year postpartum probability of transitioning to Lactobacillus dominance of 49.4%. As diversity and inflammation declined during the postpartum period, dominance by L. crispatus, the quintessential health-associated commensal, failed to return: its prevalence before, immediately after, and one year after delivery was 41%, 4%, and 9%, respectively. Revisiting our pre-delivery data, we found that a prior live birth was associated with a lower odds of L. crispatus dominance in pregnant participants-an outcome modestly tempered by a longer ( > 18-month) interpregnancy interval. Our results suggest that reproductive history and childbirth in particular remodel the vaginal ecosystem and that the timing and degree of recovery from delivery may help determine the subsequent health of the woman and of future pregnancies.


Conflict of interest statement

The authors declare no competing interests.

Figures

Fig. 1
Fig. 1. Vaginal ecosystem dynamics before and after childbirth: a 10,000-foot view.
This figure provides a high-level view of the study, as every sample is displayed. In a, alpha diversity, measured using the Shannon diversity index, is plotted against day relative to the end of gestation (vertical dashed line). For each point (n = 3,848 unique vaginal swabs), 16S rRNA genes were amplified, sequenced, and resolved to amplicon sequence variants (ASVs). For each non-gray point, a paired swab was analyzed for cytokine/chemokine concentrations (n = 198 unique vaginal swabs; panel b). The data are facetted by cohort (left, UAB cohort; right, SU cohort). Solid lines depict linear mixed-effects regressions and shaded areas represent 95% confidence intervals for the fixed effect term (i.e., day). Per-pregnancy slopes and intercepts were modeled as random effects. Three datasets were modeled, each limited to pregnancies ending in delivery with >1 timepoint available for analysis (UAB before, n = 93; SU before, n = 98; SU after, n = 65). P values correspond to the estimated slopes of the fixed effect term and were evaluated by t-test. The rate of postpartum recovery was also explored using local smoothing (loess fit; dot-dashed line). Congruent results were obtained using Faith’s phylogenetic diversity as the alpha diversity metric. b, Ordination of vaginal samples based on their cytokine/chemokine content. Swabs were collected before and after delivery as highlighted in panel a. Principal components analysis (PCA) was applied to the log-transformed concentrations of 16 analytes: IFN-γ, IL-1α, IL-1β, IL-5, IL-6, IL-10, IL-17, IL-21, IL-23, IP-10, ITAC, MIG, MIP-1α, MIP-1β, MIP-3α, and TNF-α. Normal data ellipses (75%) are plotted to aid in visualization. The effect of temporal phase on the cytokine/chemokine content of vaginal samples was tested using a permutational MANOVA based on Canberra distances (P < 0.001).
Fig. 2
Fig. 2. Delivery is accompanied by a strong shift in the diversity and composition of the vaginal microbiota that is unsurpassed across the reproductive cycle.
Panels a to c focus on pairs of samples immediately flanking delivery (SU cohort, n = 70 pregnancies). Pairs consist of a last gestational sample (lastGest) and a first postpartum sample (firstPost). These samples were collected a median of 7 days before (IQR 5-10) and 38 days after delivery (IQR 29-47), respectively, and 44 days apart (IQR 35-61). In a, the Shannon diversity index, a measure of alpha diversity, is plotted for each pair. For the postpartum samples, color corresponds to the mode of delivery (vaginal or cesarean). ****, P = 2e-10, two-sided Wilcoxon signed rank test. In b, the relative abundance of each sample’s most abundant ASV (top ASV) is plotted, with postpartum color indicating a change in the identity of the top ASV with delivery. ****, P = 3e-10, two-sided Wilcoxon signed rank test. Boxplots depict the median, approximate 95% CI (notches), IQR (hinges), and most extreme values within 1.5 * IQR of the hinges (whiskers). c, Relative abundance of individual ASVs before and after delivery. Selected for display are ASVs with super-majority status in any lastGest or firstPost sample. Panel d quantifies and contextualizes the observed levels of delivery-associated compositional instability. In d, the average within-participant Bray-Curtis dissimilarity, a measure of beta diversity, is plotted against month versus delivery. Pairwise dissimilarities between same-pregnancy samples collected 3.5 to 9 weeks apart were binned to the start month (the earliest month in the pair) and averaged. Intervals spanning delivery were manually placed at month 0 before averaging. Dissimilarities were calculated using fourth root transformed count data to moderate the influence of extremely dominant ASVs. Boxplots depict the median, IQR (hinges), and most extreme values within 1.5 * IQR of the hinges (whiskers). Results were robust to choice of alpha- and beta-diversity metrics.
Fig. 3
Fig. 3. An early postpartum nexus of diverse taxa and pro-inflammatory cytokines that persists in some women >9 months after delivery.
a Median frequencies of 31 ASVs in all high-diversity samples (Shannon diversity index (SDI) > 2) collected before or after delivery. Pregnancies were partitioned by cohort and status (UABgest, n = 75; SUgest, n = 31; SUpost, n = 54, delivery up to four months postpartum). The ASVs represent the union of the top 15 ASVs within each partition (triangles) and are ordered along the y-axis by median frequency in SUpost (decreasing; first 21) or UABgest (increasing; last 10). b Correlation network depicting relationships among taxa (red nodes) and cytokines (blue nodes) in 40 pregnancies, each sampled ~3 weeks before, ~6 weeks after, and ~9.5 months after delivery. Edges represent significant, positive, repeated measures correlations among node variables (Benjamini-Hochberg-adjusted P < 0.001; rrm > 0.35). Mixed edges (taxon-cytokine) are highlighted in purple. The frequencies of 22 bacterial genera and four Lactobacillus species, as well as the SDI, were input as taxa variables. Cytokine variables were the log10-transformed concentrations of the 16 cytokines/chemokines depicted in Supplementary Fig. 5a. Isolated nodes were removed from the graph. c Constrained correspondence analysis (CCA) of samples collected ~9.5 months after delivery (n = 40 pregnancies). The community data matrix contained the frequencies of 23 taxa: 20 bacterial genera and three Lactobacillus species. The constraining matrix consisted of the log10-transformed concentrations of the 10 cytokines/chemokines that responded to delivery (Supplementary Fig. 5a). The ordination tri-plot depicts samples (black), taxa (red), and cytokines (blue). Forty percent of the inertia (variation) in taxa was constrained by (related to) the cytokines. The P value corresponds to an ANOVA-like permutation test for the joint effect of the constraints. To minimize crowding, several taxa were omitted from the upper right quadrant. d Shannon diversity index plotted against postpartum day for the pregnancies depicted in panel c. Samples up to and including the latePost sample are displayed. Pregnancies were divided into two groups: those appearing in the upper right quadrant of panel c (CCA1 > 0.5 and CCA2 > 0; n = 12; right facet) or not (n = 28; left facet). Color indicates the summed frequencies of Lactobacillus and Bifidobacterium. Linear fits are shown for the two groups.
Fig. 4
Fig. 4. A postpartum year characterized by an expanded cast of dominant taxa and poor recovery of L. crispatus.
a Stacked bar plots depicting the proportion of samples in which the most abundant ASV (top ASV) belonged to the given taxa. Among same-pregnancy, same-month samples, the sample closest to delivery is shown. Plotted below are the average frequencies of the top ASVs binned to Lactobacillus (high; brown); Atopobium, Bifidobacterium, Gardnerella, or Streptococcus (intermediate; teal); or other genera (low; gray). Panel a includes all study pregnancies that ended in delivery (n = 194). b For the given timeframe, percentage of pregnancies with at least one sample dominated (frequency > 0.7) by an ASV classified as Lactobacillus crispatus (Lc), L. gasseri (Lg), L. iners (Li), L. jensenii (Lj), or Bifidobacterium (Bf) (color as in panels a and c; n = 72 SU pregnancies with postpartum follow-up). c Postpartum time-to-dominance curves for the five taxa depicted in panel b. Samples were defined as “dominated” if they contained an ASV classified to the focal taxon at a frequency > 0.7, and cases “at risk” if they were not dominated at the first postpartum sample and a follow-up sample was available for analysis. For each at-risk case, the first day on which the frequency of the ASV exceeded 0.7 (event) or, barring an event, the last sampled day (censor) was recorded. The curves are Kaplan-Meier step functions with tick marks indicating censored cases. d Timelines depicting L. crispatus frequency before and after delivery. On the left are gestations in which L. crispatus tended to be more abundant (n = 34), including two in which dominance was sustained across (or quickly recovered after) delivery. All others are shown at right (n = 38). Arrows mark the five timelines in which events (depicted in panel c) occurred. Panel d highlights the infrequency with which L. crispatus dominance establishes (right) or re-establishes (left) in the period following delivery. e Temporal dynamics in an individual participant. Heatmap displaying the log10-transformed frequencies of the most abundant taxa in samples collected throughout pregnancy (1st through 3rd trimesters) and the subsequent interpregnancy interval (Postpartum years 1 and 2). This was the participant’s second enrolled pregnancy. Also displayed are the last three consecutive samples (…P1) collected before the start of the focal pregnancy and the first three consecutive samples (P3…) collected after the start of the next pregnancy. The timeseries depicts two transitions to L. crispatus-dominance. The second was sustained until the delivery of the next pregnancy. Study day is relative to the participant’s first sample, which was collected prior to the start of her first enrolled pregnancy, which ended in miscarriage. Prior to log10-transformation, frequencies <0.001 were set to 0.001.
Fig. 5
Fig. 5. Lower odds of majority-L. crispatus vaginal microbiota in pregnant women with a history of prior live birth.
a Associations between vaginal bacterial community states (outcomes) and a history of prior live birth (exposure) in n = 98 SU gestations (n = 53 with a history of prior live birth). Six states were defined using features of the top ASV (majority status and taxonomic identity) and modeled separately as dichotomous outcomes (one-versus-rest). Wald 95% CIs were calculated using a clustered covariance matrix which accounts for correlation among longitudinal samples. Differences in sampling effort were addressed via repeated random draws of six samples per gestation (100 iterations; odds ratios, CIs, and P values represent means). Similar results were obtained for crude (shown) and maternal age- and race-adjusted models. Results for the uncommon L. jensenii-dominated state (top ASV frequency > 0.5 and identified as L. jensenii) were unstable and are not shown. b Average Shannon diversity index for SU gestations stratified by a history of prior live birth. The P value corresponds to a two-sided Wilcoxon rank sum test. Black lines connect gestations that occurred in the same person (n = 9 participants with no history of prior live birth at first enrollment). Boxplots depict the median, approximate 95% CI (notches), IQR (hinges), and most extreme values within 1.5 * IQR of the hinges (whiskers). c Number of L. crispatus-predominant gestations (brown bars) stratified by cohort and birth-to-conception interval (time between conception of the current gestation and the prior live birth). Birth-to-conception intervals were binned to ≤18 or >18 months, the longer of which was associated with a higher incidence of L. crispatus-predominance (two-sided Fisher’s exact test, P = 0.04, SU and UAB cohorts combined). Those lacking an interval (None; because they had no history of prior live birth) are shown for reference. L. crispatus predominance was defined as a species-level average gestational frequency exceeding 0.5. Light gray bars indicate the total number of gestations.

References

    1. Mesiano, S. Chapter 11. Endocrinology of Human Pregnancy and Fetal-Placental Neuroendocrine Development. in Yen & Jaffe’s Reproductive Endocrinology, 8th Edition (eds. J. F. Strauss & R. L. Barbieri) 256–284 (Elsevier, 2019).
    1. Anahtar MN, Gootenberg DB, Mitchell CM, Kwon DS. Cervicovaginal microbiota and reproductive health: The virtue of simplicity. Cell Host Microbe. 2018;23:159–168. doi: 10.1016/j.chom.2018.01.013. - DOI - PubMed
    1. Goplerud CP, Ohm MJ, Galask RP. Aerobic and anaerobic flora of the cervix during pregnancy and the puerperium. Am. J. Obstet. Gynecol. 1976;126:858–868. doi: 10.1016/0002-9378(76)90674-8. - DOI - PubMed
    1. Anderson BL, et al. Pregnancy-induced changes in immune protection of the genital tract: Defining normal. Am. J. Obstet. Gynecol. 2013;208:321.e1–321.e9. doi: 10.1016/j.ajog.2013.01.014. - DOI - PMC - PubMed
    1. Huang Y-E, et al. Homogeneity of the vaginal microbiome at the cervix, posterior fornix, and vaginal canal in pregnant Chinese women. Microb. Ecol. 2015;69:407–414. doi: 10.1007/s00248-014-0487-1. - DOI - PubMed

Publication types