

Centripetal nuclear shape fluctuations associate with chromatin condensation in early prophase
- PMID: 37438411
- PMCID: PMC10338514
- DOI: 10.1038/s42003-023-05074-9
Centripetal nuclear shape fluctuations associate with chromatin condensation in early prophase
Abstract
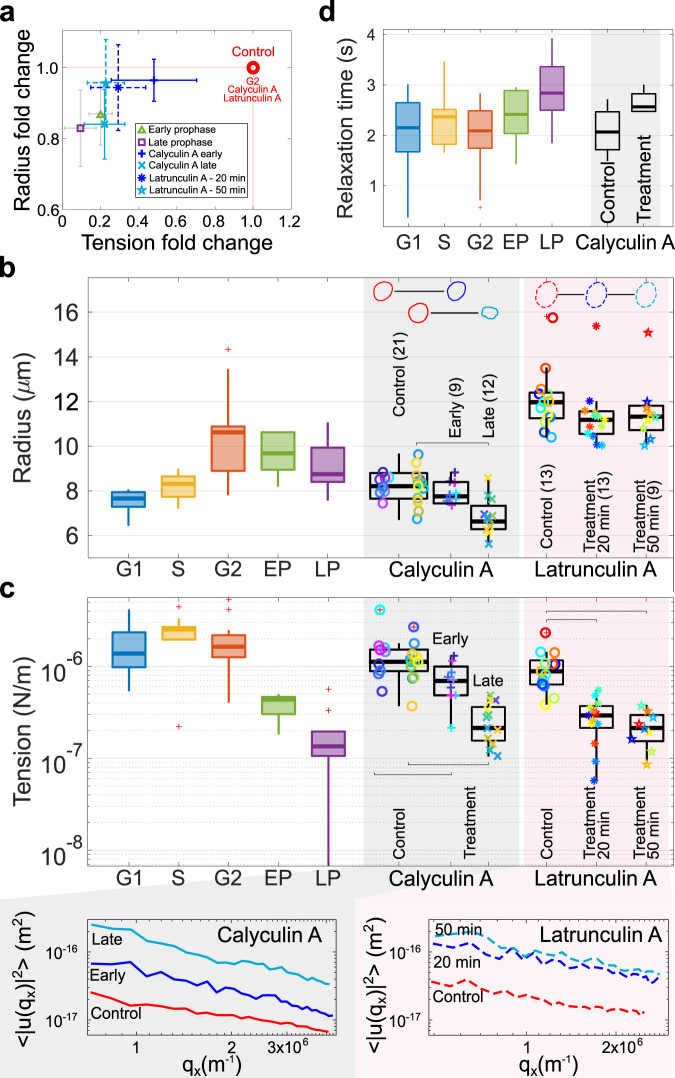
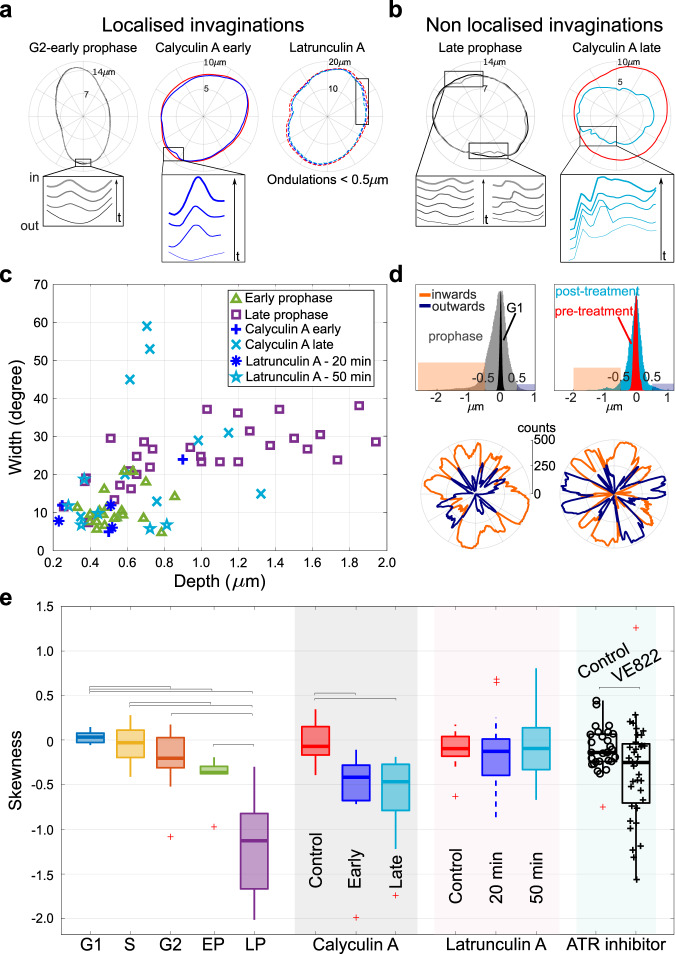
The nucleus plays a central role in several key cellular processes, including chromosome organisation, DNA replication and gene transcription. Recent work suggests an association between nuclear mechanics and cell-cycle progression, but many aspects of this connection remain unexplored. Here, by monitoring nuclear shape fluctuations at different cell cycle stages, we uncover increasing inward fluctuations in late G2 and in early prophase, which are initially transient, but develop into instabilities when approaching the nuclear-envelope breakdown. We demonstrate that such deformations correlate with chromatin condensation by perturbing both the chromatin and the cytoskeletal structures. We propose that the contrasting forces between an extensile stress and centripetal pulling from chromatin condensation could mechanically link chromosome condensation with nuclear-envelope breakdown, two main nuclear processes occurring during mitosis.
© 2023. The Author(s).
Conflict of interest statement
The authors declare no competing interests.
Figures

Similar articles
-
Mechanobiology of the nucleus during the G2-M transition.Nucleus. 2024 Dec;15(1):2330947. doi: 10.1080/19491034.2024.2330947. Epub 2024 Mar 27. Nucleus. 2024. PMID: 38533923 Free PMC article. Review.
-
Quantifying Nuclear Shape Fluctuations During Early Mitosis.Methods Mol Biol. 2025;2958:151-158. doi: 10.1007/978-1-0716-4714-1_10. Methods Mol Biol. 2025. PMID: 40833572
-
An electron microscopic study of mitosis in mouse duodenal crypt cells confirms that the prophasic condensation of chromatin begins during the DNA-synthesizing (S) stage of the cycle.Am J Anat. 1989 Sep;186(1):69-84. doi: 10.1002/aja.1001860106. Am J Anat. 1989. PMID: 2782289
-
Reorganization and condensation of chromatin in mitotic prophase nuclei of Allium cepa.Chromosoma. 1994 Oct;103(6):432-40. doi: 10.1007/BF00362288. Chromosoma. 1994. PMID: 7859564
-
Genome Organization and Chromosome Architecture.Cold Spring Harb Symp Quant Biol. 2015;80:83-91. doi: 10.1101/sqb.2015.80.027318. Epub 2016 Jan 22. Cold Spring Harb Symp Quant Biol. 2015. PMID: 26801160 Review.
Cited by
-
Mechanobiology of the nucleus during the G2-M transition.Nucleus. 2024 Dec;15(1):2330947. doi: 10.1080/19491034.2024.2330947. Epub 2024 Mar 27. Nucleus. 2024. PMID: 38533923 Free PMC article. Review.
-
Actin from within - how nuclear myosins and actin regulate nuclear architecture and mechanics.J Cell Sci. 2025 Feb 1;138(3):JCS263550. doi: 10.1242/jcs.263550. Epub 2025 Feb 10. J Cell Sci. 2025. PMID: 39927755 Free PMC article. Review.
-
Chromatin phase separation and nuclear shape fluctuations are correlated in a polymer model of the nucleus.Nucleus. 2024 Dec;15(1):2351957. doi: 10.1080/19491034.2024.2351957. Epub 2024 May 16. Nucleus. 2024. PMID: 38753956 Free PMC article.
-
Quantifying Nuclear Shape Fluctuations During Early Mitosis.Methods Mol Biol. 2025;2958:151-158. doi: 10.1007/978-1-0716-4714-1_10. Methods Mol Biol. 2025. PMID: 40833572
-
Current Methods and Pipelines for Image-Based Quantitation of Nuclear Shape and Nuclear Envelope Abnormalities.Cells. 2022 Jan 20;11(3):347. doi: 10.3390/cells11030347. Cells. 2022. PMID: 35159153 Free PMC article. Review.
References
-
- Brochard F, Lennon J. Frequency spectrum of the flicker phenomenon in erythrocytes. J. Phys. France. 1975;36:1035–1047. doi: 10.1051/jphys:0197500360110103500. - DOI
-
- Helfrich W, Servuss RM. Undulations, steric interaction and cohesion of fluid membranes. Il Nuovo Cim. D. 1984;3:137–151. doi: 10.1007/BF02452208. - DOI
Publication types
MeSH terms
Substances
Grants and funding
LinkOut - more resources
Full Text Sources
Research Materials
