. 2023 Jul 12;6(1):714.
doi: 10.1038/s42003-023-05092-7.

FAM201A encodes small protein NBASP to inhibit neuroblastoma progression via inactivating MAPK pathway mediated by FABP5

Affiliations

FAM201A encodes small protein NBASP to inhibit neuroblastoma progression via inactivating MAPK pathway mediated by FABP5

Mujie Ye et al. Commun Biol. .

Abstract

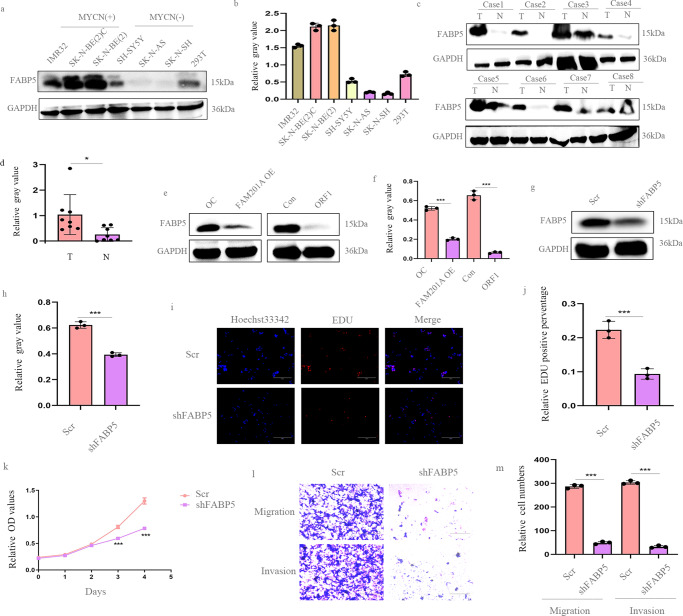
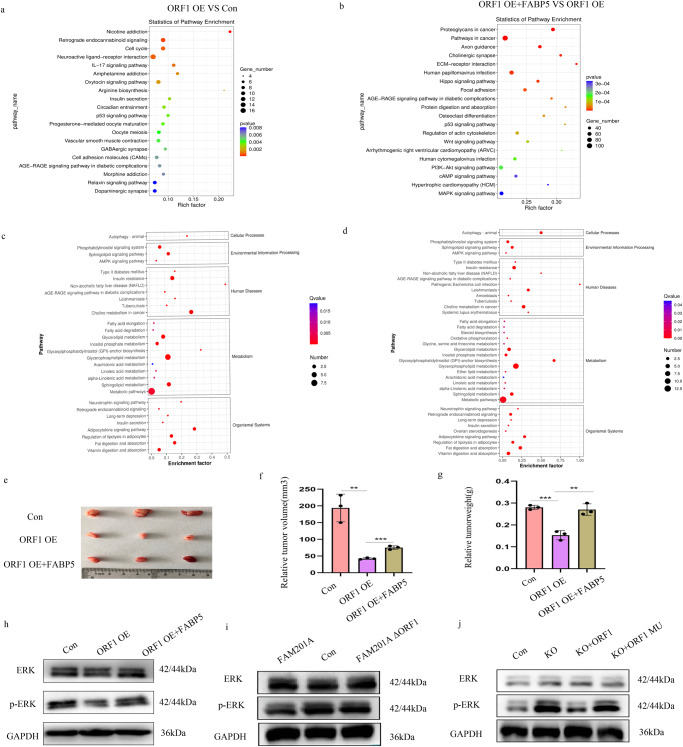
Increasing evidence indicates that long non-coding RNA (lncRNA) is one of the most important RNA regulators in the pathogenesis of neuroblastoma (NB). Here, we found that FAM201A was low expressed in NB and a variety of gain and loss of function studies elucidated the anti-tumor effects of FAM201A on the regulation of proliferation, migration and invasion of NB cells. Intriguingly, we identified the ability of FAM201A to encode the tumor-suppressing protein, NBASP, which interacted with FABP5 and negatively regulated its expression. In vivo assays also revealed NBASP repressed NB growth via inactivating MAPK pathway mediated by FABP5. In conclusion, our findings demonstrated that NBASP encoded by FAM201A played a tumor-suppressor role in NB carcinogenesis via down-regulating FABP5 to inactivate the MAPK pathway. These results extended our understanding of the relationship of lncRNA-encoded functional peptides and plasticity of tumor progression.


Conflict of interest statement

The authors declare no competing interests.

Figures

Fig. 1
Fig. 1. FAM201A over-expression represses NB cell proliferation, migration and invasion.
a Decreased expression of FAM201A expression was detected in NB tissues (NBC, n = 23) and adjacent normal tissues (NBP, n = 23) by Q-PCR analyses; b Q-PCR analysis showed the expressions of FAM201A in CHLA15, CHLA136, SH-N-SH, SH-SY5Y, SK-N-BE(2), SK-N-BE(2)C, and SK-N-AS cell lines; c and d SK-N-BE (2)C and SH-SY5Y cells were transfected with FAM201A over-expression vectors and a empty vector (OC represents over-expression control vectors), and the over-expression effect was verified by Q-PCR analysis; e and f Over-expression of FAM201A inhibited both SK-N-BE (2)C and SH-SY5Y cell proliferation, as shown by CCK8 assays; gj The number of colonies decreased dramatically after over-expression of FAM201A in the SK-N-BE (2)C and SH-SY5Y cells; kn Over-expression of FAM021A decreased SK-N-BE (2)C and SH-SY5Y cell proliferation, as shown by EdU assays, magnification, ×200, scale bar, 300 μm; or Transwell migration and matrigel invasion assays were used to determine the cell migration and invasion capabilities of SK-N-BE (2)C and SH-SY5Y cells transfected with the over-expression of FAM201A and empty vectors. Shown are quantitation of cell numbers from three independent experiments, magnification, ×100, scale bar, 300 μm. Results in (cr) are mean ± SD (n = 3). Statistical analysis was done by Student’s t test. (**p < 0.01, ***p < 0.001).
Fig. 2
Fig. 2. Loss of FAM201A triggers NB cell proliferation and metastasis.
a The effects of CRISPR Cas9 knockout of FAM201A expression; b Knockout of FAM201A on proliferation in SK-N-SH cells was determined by CCK8 assays; c and d Knockout of FAM021A accelerated SK-N-SH cell proliferation, as shown by EdU assays, magnification, ×200, scale bar, 300 μm; e and f The colonies increased after knockout of FAM201A in SK-N-SH cell lines; g and h Transwell migration and matrigel invasion assays were used to determine the cell migration and invasion capabilities of knockout of FAM201A in SK-N-SH cells. Shown are quantification of cell numbers from three independent experiments, magnification, ×100, scale bar, 300 μm. Results in (ah) are mean ± SD (n = 3). Statistical analysis was done by Student’s t test. (**p < 0.01, ***p < 0.001).
Fig. 3
Fig. 3. FAM201A encodes a small endogenous peptide expressed in NB cells.
a Data from the Coding Potential Assessment Tool database predicted six open reading frames (ORFs) using the ORF finder; b The start, stop location, and the length of these predicted ORFs are shown; c The 293 T cells were cloned with a FLAG epitope tag within the C-terminus (Flag knock-in) before the stop codons of the six candidate ORFs of FAM201A, and a empty vector (negative control). Only the ORF1 could encode peptides detected by western blotting; d Only ORF1-encoded peptides further confirmed by immunofluorescence staining, positive control represents a coding gene with FLAG; e A mutation of ATG (ΔATG, G-T) containing the FLAG fusion sequence was constructed as shown; f and g The expression of the ORF1-encoded peptide was abolished by mutating the ATG codons of ORF1, as evidenced by western blotting and immunofluorescence analysis, magnification, ×200, scale bar, 200 μm; h and i Results from mass spectrometry analysis confirmed the existence of the endogenous peptide encoded by ORF1 in NB cells; j CCK8 assay of FAM201A over-expression, FAM201A over-expression with ORF1 depletion, and control groups; k and l Colony formation experiments and statistics of FAM201A over-expression, FAM201A over-expression with ORF1 depletion and control groups; m and n Transwell assay of FAM201A over-expression, FAM201A over-expression with ORF1 depletion, and control groups, magnification, 100, scale bar, 300 μm. Results in (jn) are mean ± SD (n = 3). Statistical analysis was done by Student’s t test. (**p < 0.01, ***p < 0.001).
Fig. 4
Fig. 4. NBASP inhibits NB proliferation, migration and invasion in vitro.
a and b Over-expression of ORF1 in both SH-SY5Y and SK-N-BE (2)C cells inhibited proliferation, as shown by the CCK8 assay; cf Colony formation showed that over-expression of ORF1 decreased the proliferation in SH-SY5Y and SK-N-BE (2)C cells; gj The EdU staining further confirmed that a high level of NBASP suppressed the viability of NB cells, magnification, ×200, scale bar, 300 μm; kn Cell counts of the lower chamber in ORF1 over-expression groups were found to be decreased, when compared with the control group, magnification, ×100, scale bar, 300 μm. o CCK8 assay of FAM201A knockout, ORF1 restore, ORF1 mutation at start codon(ATG to ATT) restore, and control groups; p and q Colony formation experiments and statistics of FAM201A knockout, ORF1 restore, ORF1 mutant restore, and control groups; r and s Transwell assay of FAM201A knockout, ORF1 restore, ORF1 mutant restore, and control group, magnification, ×100, scale bar, 300 μm. Results in (as) are mean ± SD (n = 3). Statistical analysis was done by Student’s t test. (**p < 0.01, ***p < 0.001).
Fig. 5
Fig. 5. NBASP regulates FABP5 via ubiquitin proteasome pathway.
a and b Western blotting of NBASP protein expression upon over-expression and knockout of the FAM201A, ORF1, and ORF1-mutant in NB cells; c and d Down-regulation of NBASP was confirmed in tumor tissues when compared with adjacent normal tissues (n = 6) at the protein level by western blotting; e The interaction between NBASP and FABP5 was confirmed by a co-immunoprecipitation assay; f Western blotting was performed to detect FABP5 level in ORF1 over-expression and control group after 10 μm CHX treatment for 0 h, 4 h, 8 h; g Western blotting was performed to detect FABP5 level in ORF1 over-expression and control group after 10 μm MG132 treatment for 0 h, 4 h, 8 h; h Co-IP showed ORF1 over-expression bound to more ubiquitin than control group; i Down-regulation of FABP5 has no effect on NBASP. Statistical analysis was done by Student’s t test. (**p < 0.01).
Fig. 6
Fig. 6. FABP5 is highly expressed in NB and acts as oncogene in NB.
a and b FABP5 was up-regulated in NB cell lines with MYCN amplification, when compared with non-MYCN amplified NB cell lines and 293 T cell lines (negative control), as showed by western blotting. Shown is the quantitation of relative gray values; c and d Up-regulation of FABP5 was confirmed in tumor tissues when compared with normal tissues (n = 8) at the protein level by western blotting; e and f Western blotting of FABP5 protein expression upon over-expression of FAM201A and ORF1 in NB cells, which was quantified by relative gray values; g and h The knockdown efficiency of FABP5 was evaluated and quantified by western blotting analysis in NB cells; ik The effects of shFABP5 in NB cells were determined by EdU and CCK8 assays, magnification, ×200, scale bar, 300 μm; l and m A decrease in cell number in the transwell assay was observed in the FABP5 knockdown groups, magnification, ×100, scale bar, 300 μm. Results in (am except c,d)are mean ± SD (n = 3). Statistical analysis was done by Student’s t test. (*p < 0.05, ***p < 0.001).
Fig. 7
Fig. 7. Over-expression of FABP5 restores the tumor inhibitory effects of NBASP.
a Western blotting showed the restored efficiency; b In the CCK8, over-expression of NBASP suppressed the growth of cells, however, over-expression of FABP5 in NBASP stably transfected cells facilitated the impaired viability; cf The EdU (c and d) and colony formation (e and f) assays further validated and quantified the proliferative effect of FABP5 in NBASP over-expressed NB cells, magnification of EdU, ×200, scale bar, 300 μm; g and h The effects on migration and invasion of NBASP in NB cells was restored by FABP5, as shown by transwell experiments, magnification, ×100, scale bar, 300 μm. Results in (ah) are mean ± SD (n = 3). Statistical analysis was done by Student’s t test. (***p < 0.001).
Fig. 8
Fig. 8. NBASP reduces tumor growth via the FABP5-mediated MAPK pathway.
ad Kyoto Encyclopedia of Genes and Genomes of RNA-seq (a and b) and lipid metabolomics (c and d) were shown in ORF1 over-expressed cells, ORF1 over-expressed+FABP5 over-expressed cells, and control cells; eg General appearance (e), volumes (f), and weights (g) of subcutaneous tumor tissues from nude mice; h Western blotting showed that ORF1 inhibited MAPK signaling and FABP5 re-activated MAPK signaling; i Western blotting showed ERK and p-ERK protein levels in FAM201A over-expression, FAM201A over-expression with ORF1 depletion, and control groups; j Western blotting showed ERK and p-ERK protein levels in FAM201A knockout, ORF1 restore, ORF1 mutation at start codon(ATG to ATT) restore, and control groups. Results in (ej) are mean ± SD (n = 3). Statistical analysis was done by Student’s t test.(**p < 0.01, ***p < 0.001).

Similar articles

Cited by

References

    1. Maris JM, Hogarty MD, Bagatell R, Cohn SL. Neuroblastoma. Lancet. 2007;369:2106–2120. doi: 10.1016/S0140-6736(07)60983-0. - DOI - PubMed
    1. Matthay KK, et al. Neuroblastoma. Nat. Rev. Dis. Primers. 2016;2:16078. doi: 10.1038/nrdp.2016.78. - DOI - PubMed
    1. Maris JM. Recent advances in neuroblastoma. N. Engl. J. Med. 2010;362:2202–2211. doi: 10.1056/NEJMra0804577. - DOI - PMC - PubMed
    1. Tsubota S, Kadomatsu K. Origin and initiation mechanisms of neuroblastoma. Cell Tissue Res. 2018;372:211–221. doi: 10.1007/s00441-018-2796-z. - DOI - PubMed
    1. Upton K, et al. Epigenomic profiling of neuroblastoma cell lines. Sci Data. 2020;7:116. doi: 10.1038/s41597-020-0458-y. - DOI - PMC - PubMed

Publication types