. 2023 Jul;619(7970):606-615.
doi: 10.1038/s41586-023-06300-4. Epub 2023 Jul 12.

Co-transplantation of autologous Treg cells in a cell therapy for Parkinson's disease

Affiliations

Co-transplantation of autologous Treg cells in a cell therapy for Parkinson's disease

Tae-Yoon Park et al. Nature. 2023 Jul.

Abstract

The specific loss of midbrain dopamine neurons (mDANs) causes major motor dysfunction in Parkinson's disease, which makes cell replacement a promising therapeutic approach1-4. However, poor survival of grafted mDANs remains an obstacle to successful clinical outcomes5-8. Here we show that the surgical procedure itself (referred to here as 'needle trauma') triggers a profound host response that is characterized by acute neuroinflammation, robust infiltration of peripheral immune cells and brain cell death. When midbrain dopamine (mDA) cells derived from human induced pluripotent stem (iPS) cells were transplanted into the rodent striatum, less than 10% of implanted tyrosine hydroxylase (TH)+ mDANs survived at two weeks after transplantation. By contrast, TH- grafted cells mostly survived. Notably, transplantation of autologous regulatory T (Treg) cells greatly modified the response to needle trauma, suppressing acute neuroinflammation and immune cell infiltration. Furthermore, intra-striatal co-transplantation of Treg cells and human-iPS-cell-derived mDA cells significantly protected grafted mDANs from needle-trauma-associated death and improved therapeutic outcomes in rodent models of Parkinson's disease with 6-hydroxydopamine lesions. Co-transplantation with Treg cells also suppressed the undesirable proliferation of TH- grafted cells, resulting in more compact grafts with a higher proportion and higher absolute numbers of TH+ neurons. Together, these data emphasize the importance of the initial inflammatory response to surgical injury in the differential survival of cellular components of the graft, and suggest that co-transplanting autologous Treg cells effectively reduces the needle-trauma-induced death of mDANs, providing a potential strategy to achieve better clinical outcomes for cell therapy in Parkinson's disease.


Figures

Extended Data Fig. 1
Extended Data Fig. 1. Influence of neuroinflammation on transplanted post-mitotic neurons.
a-e, NSG mice were sacrificed 14 days after intra-striatal transplantation of B1/H9-mDAPs. The total number and percentage of TH+ mDA neurons were determined by immunofluorescence staining with anti-TH/Hoechst 33342 before transplantation (a, c, e) or immunohistochemistry staining with anti-TH/hNUCLEI antibodies after transplantation (b, d, e). f-i, NSG mice were sacrificed 14 days after intra-striatal transplantation of C4-iPSC/B1-iPSC/H9-ESC derived GABAergic progenitors. The total number and percentage of C4- (f), B1- (g), or H9-GABAergic neurons (h) were determined by immunofluorescence staining with anti-VGAT/Hoechst 33342 before transplantation and anti-VGAT/Nkx2.1/hNUCLEI antibodies after transplantation (i). Quantification of results are representative of 2-3 independent experiments with 4 mice per group. Each error bar represents means ± s.e.m.
Extended Data Fig. 2
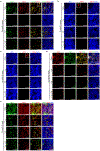
Extended Data Fig. 2. Early time-dependent analysis of inflammatory responses to the needle trauma.
a-e, TP media was injected into the striatum of Fischer 344 rats and rats were sacrificed on Day 1, 2, 3, 5, 7 after surgery. The level of needle trauma-induced neuroinflammation was determined by immunofluorescence staining with anti-TNF-α (a) and IL-1β (b) antibodies, and staining is quantified in a’ and b’. c, Astrocytes were stained with anti-GFAP antibody, and staining is quantified in c’. Representative images and quantitative analysis of Iba-1+ cells (yellow box: brain-resident microglia, red box: infiltrated Iba-1+ cells) (d, d’) after injection. Inhibition of needle trauma-induced host inflammatory response using TREG. Fischer 344 rats were sacrificed 2 days after intra-striatal co-transplantation of TP medium with or without autologous TREG from each rat (20 k cells/rat). The level of needle trauma-induced neuroinflammation was determined by immunofluorescence staining with anti-TNF-α (e, e’) and -IL-1β (f, f’) antibodies. Quantification of results are representative with 5 (a-d) or 3 (e,f) rats per group. Each error bar represents means ± s.e.m. *, P < 0.05, **, P < 0.01.
Extended Data Fig. 3
Extended Data Fig. 3. Long-term time-dependent analysis of cellular responses to the needle trauma.
a-d, TP media was injected into striatum of Fischer 344 rats and rats were sacrificed on Day 4, 7, 14 and 1, 3, 6 months after surgery. The level of inflammatory cell infiltration into the needle track was determined by immunohistochemical staining with anti-IbaI (a) and -MHCII (b) antibodies. c, The level of needle trauma-induced neuroinflammation was determined by immunofluorescence staining with anti-IFN-γ antibody. d, The level of cell death by needle trauma was analyzed by TUNEL assay. Quantification of results are representative of two independent experiments with 5 rats per group. The mean value was connected by a red line.
Extended Data Fig. 4
Extended Data Fig. 4. TREG function after ex vivo expansion.
a, b, The level of sorted CD4+CD25+Foxp3+ T cells (nTREG) (a) and ex vivo expanded rat CD4+CD25+Foxp3+ T cells (Expanded TREG) (b) were analyzed by flow cytometry staining. c, TREG suppression assay of Tconv cells proliferation based on CFSE dilution in the presence of rat nTREG or expanded TREG at 1:1 and 1:2 ratio (TREG : Tconv) and analyzed by flow cytometry. d-f, Interaction between rat TREG (rTREG) and C4-mDAPs. C4-mDAPs and rTREG were co-incubated for 72 hours at a ratio of 5:1 and 1:1. The level of TH (d), Foxa2 (e), or Lmx1a (f) mRNA expression in C4-mDAPs were determined by quantitative real-time PCR and normalized to Actin. (g) The level of isolated human CD4+CD127lowCD25+Foxp3+ TREG were analyzed by flow cytometry. These experiments were repeated three times (n=3) in triplicate using independently prepared samples. Each error bar represents means ± s.e.m. ns, not significant.
Extended Data Fig. 5
Extended Data Fig. 5. Localization and function of autologous TREG after co-transplantation.
a, After intra-striatal co-transplantation of Fischer 344 rats with TP medium and autologous TREG (20 k cells/rat), the localization of TREG was determined by immunofluorescence staining with anti-Foxp3 antibody at 1, 2, 3, 5, and 7 days after surgery. b, The level of inflammatory cell infiltration into needle track was determined by immunohistochemical staining with anti-MHCII antibody. Quantification of results are representative with 5 rats per group. Each error bar represents means ± s.e.m. *, P < 0.05, ***, P < 0.001.
Extended Data Fig. 6
Extended Data Fig. 6. Inhibition of needle trauma-induced neuroinflammation by CsA treatment.
a-e, Fischer 344 rats were sacrificed 7 days after intra-striatal co-transplantation of TP media with TREG (20 k cells/rat) or CsA treatment (i.p.). a, Schematic overview of experimental method. The level of inflammatory cell infiltration into the needle track was determined by immunohistochemical staining with anti-IbaI (b) and -MHCII (c) antibodies. d, The level of needle trauma-induced neuroinflammation was determined by immunofluorescence staining with anti-IFN-γ antibody. e, The level of neuroinflammation-induced cell death by needle trauma was analyzed by TUNEL assay. Quantification of results are representative of two independent experiments with 5 rats per group. Each error bar represents means ± s.e.m. *, P < 0.05, **, P < 0.01, ***, P < 0.001.
Extended Data Fig. 7
Extended Data Fig. 7. In vitro effects of pro-inflammatory cytokines treatment on C4-mDAPs.
a-g, C4-mDAPs were incubated in vitro with or without 20 ng/ml TNF-α, 10 ng/ml IL-1β or 100 ng/ml IFN-γ for 2 days. The level of neuroinflammation-induced immunogenicity was determined by flow cytometry analysis with anti-HLA-ABC/HLA-DR/CD80/CD86/CD40/PD-L1/PD-L2/CD47 antibodies (a) and by western blot analysis with anti-Zg16/Hormad1 antibodies (b). TH levels were assessed by immunofluorescence staining (c), the number of total cells (d) or TH+ cells (e), TH+ mean fluorescence intensity (f), and TH+ neurite length (g). h,i, C4-mDAPs were incubated in vitro with 20 ng/ml TNF-α or 10 ng/ml IL-1β for 7 days. The level of neuroinflammation-induced cell death was determined by flow cytometry analysis of Annexin-V/7-AAD staining (h) and TUNEL assay (i). j-m, C4-mDAPs with or without TREG were co-cultured for 7 days under in vitro inflammatory conditions (with or without 20 ng/ml TNF-α or 10 ng/ml IL-1β). j, Immunofluorescence staining of TH and FoxA2. Percentages of TH+ (k) and FoxA2+ (m) cells among total cells, and TH+ neurite length (l) were measured. n,o, C4-mDAPs with or without TREG and anti-TGF-β1 antibody were co-cultured for 7 days. The level of proliferation was determined by immunofluorescence staining with anti-Ki67 antibody (n) and staining is quantified in o. This experiment was repeated more than three times (n≥3) using independently prepared samples (a-i) and randomly analyzed multiple (n≥3) areas (j-o). Each error bar represents means ± s.e.m. *, P < 0.05, **, P < 0.01, ***, P < 0.001. ns, not significant.
Extended Data Fig. 8
Extended Data Fig. 8. TREG co-transplantation suppresses inflammatory cell infiltration and C4-mDAPs immunogenicity in xenogeneic PD model.
a-d, Fischer 344 rats were sacrificed 2 weeks after intra-striatal co-transplantation of C4-mDAPs with or without TREG and CsA. The levels of CD11b+/CD11c+ (a), NKp46+ (b), CD19+ (c), and CD4+/CD8+ (d) cells were assessed through immunofluorescence staining. (e) Expression of HLA class I/II was examined through immunofluorescence staining. Results are representative of 5-10 rats per group.
Extended Data Fig. 9
Extended Data Fig. 9. TREG co-transplantation suppresses C4-mDAPs proliferation in xenogeneic PD model.
a-p, Fischer 344 rats were sacrificed 20 weeks after intra-striatal co-transplantation of C4-mDAPs with or without TREG and CsA. a, b, Stereological estimation of graft volume through hNCAM+ staining. Number of Ki67+ cells (c, d) among hNUCLEI+ cells. e, Correlation between Ki67+ cell number and graft volume. f, The number of TH+ and FoxA2+ cells were analyzed by immunofluorescence staining. g-k, Representative images of neuronal (g, NeuN+), astrocyte (h, hGFAP+), VLMC (i, hCOL1A1+), oligodendrocyte (j, OLIG2+), and microglia (k, hIba-1+). Scale bars: 100 μm. Quantification of results are representative of 5-10 rats per group. Each error bar represents means ± s.e.m. *, P < 0.05, **, P < 0.01.
Extended Data Fig. 10
Extended Data Fig. 10. Effects of TREG co-transplantation with C4-mDAPs in autologous C4-humanized PD model.
a-h, C4-humanized mice were sacrificed 8 weeks after intra-striatal transplantation of C4-mDAPs with or without autologous C4-TREG (20 k cells/mouse). a, Schematic overview of experimental design. b, Survival of C4-humanized mice. Total number of transplanted C4-mDAPs (c), graft volume (d), and TH+ cells (g) were assayed. Number of Ki67+ (e) and correlation between Ki67+ and hNUCLEI+ cell number (f). h, The levels of hCD4+ T cells were confirmed through immunofluorescence staining. Quantification of results are representative with 2 (−TREG) or 3 (+TREG) mice per group. Each error bar represents means ± s.e.m. *, P < 0.05.
Extended Data Fig. 11
Extended Data Fig. 11. In vivo effects of TREG co-transplantation with C4-mDAPs.
a-d, NSG mice were sacrificed 20 weeks after intra-striatal transplantation of C4-mDAPs with or without autologous C4-TREG. a, b, Representative images (a) and quantitative assessment (b) of hSYP+ within the DL STR. c, d, Representative images (c) and quantitative assessment (d) of graft-derived TH+ fiber density in the (i) cingulate cortex (CTX), (ii) perirhinal CTX, (iii) DL STR, and (iv) ventrolateral (VL) STR. T, transplant. Quantification of results are representative with 5-10 mice per group. Each error bar represents means ± s.e.m. *, P < 0.05, **, P < 0.01, ***, P < 0.001.
Fig. 1.
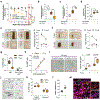
Fig. 1.. Influence of neuroinflammation on transplanted cells.
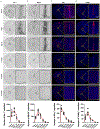
a-g, NSG or C4-hu mice were sacrificed 14 days after intra-striatal transplantation of C4-mDAPs. The total number and percentage of TH+ mDA neurons were determined by immunofluorescence staining with anti-TH/Hoechst 33342 before transplantation (a, c, d) or immunohistochemistry staining with anti-TH/hNUCLEI antibodies after transplantation (b, c, d). The level of inflammatory cell infiltration was confirmed by immunofluorescence staining with anti-hIba1 (e), -hCD45 (f), and -hCD4 (g) antibodies. h-k, Inhibition of needle trauma-induced host inflammatory response using TREG. Fischer 344 rats were sacrificed 7 days after intra-striatal co-transplantation of TP medium with or without autologous TREG from each rat (20 k cells/rat). The level of inflammatory cell infiltration into needle track was determined by immunohistochemical staining with anti-IbaI (h) and -MHCII (i) antibodies. j, The level of needle trauma-induced neuroinflammation was determined by immunofluorescence staining with anti-IFN-γ antibody. k, The level of neuroinflammation-induced cell death by needle trauma was analyzed by TUNEL assay. l-n, Advantages of co-transplantation of autologous TREG. The level of inflammatory cell infiltration into needle track was determined by immunohistochemical staining with anti-MHCII antibody. l, The inhibitory effect of neuroinflammation by needle trauma was compared 7 days after co-transplantation of syngeneic and autologous TREG (20 k cells/rat). m, Inhibition of needle trauma-induced neuroinflammation was measured 7 days after co-transplantation with 2 k, 20 k or 100 k autologous TREG per rat. n, Adoptive transfer of ex vivo expanded autologous TREG (1,000 k cells/rat) or intra-striatal co-transplantation of ex vivo expanded autologous TREG (20 k cells/rat) obtained from each rat was compared after 7 days. Quantification of results are representative of 4 mice or 5-10 rats per group. Each error bar represents means ± s.e.m. *, P < 0.05, **, P < 0.01, ***, P < 0.001.
Fig. 2.
Fig. 2.. Neuroinflammation-induced immunogenicity in transplanted C4-mDAPs.
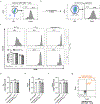
a-c, C4-mDAPs were incubated in vitro with 100 ng/ml IFN-γ for 2 days. The level of neuroinflammation-induced immunogenicity was determined by flow cytometry analysis with anti-HLA-ABC/HLA-DR (a), anti-CD80/CD86/CD40/PD-L1/PD-L2/CD47 antibodies (b), and by western blot analysis with anti-Zg16/Hormad1 antibodies (c). d-f, MLR assays using C4-mDAPs and C4/K2-PBMC. d, The level of T cell activation measured by flow cytometry analysis with anti-CD3/CD69 antibodies. e, The level of immunogenicity-induced cell death determined by flow cytometry analysis with anti-hNCAM/Annexin-V staining. f, The level of IFN-γ secretion measured by ELISA. These experiments were repeated more than three times in triplicate using independently prepared samples. ☨; Activated with Dynabeads Human T-Activator. Each error bar represents means ± s.e.m. *, P < 0.05, **, P < 0.01, ***, P < 0.001.
Fig. 3.
Fig. 3.. Neuroinflammation-induced cell death and gene expression of C4-mDAPs.
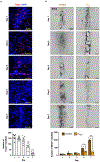
a-i, C4-mDAPs were incubated in vitro with 100 ng/ml IFN-γ for 7 days. The level of neuroinflammation-induced cell death was determined by western blot with anti-cleaved caspase-3 antibody (a), flow cytometry analysis of Annexin-V/7-AAD staining (b), and TUNEL assay (c). TH levels were assayed by immunofluorescence staining (d), and the number of total cells (e) or TH+ cells (f), TH+ mean fluorescence intensity (g), and TH+ neurite length (h) were measured. i, Apoptotic cell death (Annexin-V+) was analyzed by gating TH+ and TH cells using flow cytometry. j-l, C4-mDAPs with or without TREG were co-cultured for 7 days under in vitro inflammatory conditions (with or without 100 ng/ml IFN-γ). j, Immunofluorescence staining of TH and Ki67. Percentages of TH+ (k) and Ki67+ (l) cells among total cells. Scale bars: 100 μm. These experiments were repeated more than three times (n≥3) using independently prepared samples. Each error bar represents means ± s.e.m. *, P < 0.05, ***, P < 0.001.
Fig. 4.
Fig. 4.. Effects of TREG co-transplantation with C4-mDAPs in xenogeneic PD model.
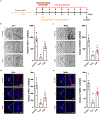
a, b, Fischer 344 rats were sacrificed 2 or 20 weeks after intra-striatal transplantation of C4-mDAPs with or without autologous TREG (20 k cells/rat) and CsA (control). Amphetamine-induced rotation scores were determined every 4 weeks for 20 weeks after transplantation. c, At 2 weeks, the level of inflammatory cell infiltration was determined by immunohistochemical staining with anti-MHCII antibody. d, The level of neuroinflammation-induced cell death was analyzed by TUNEL assay after 2 weeks. e, g, The total number of C4-mDAPs was confirmed through hNUCLEI staining after 2 weeks (e) and 20 weeks (g). f, h, The number of TH+ cells was determined after 2 weeks (f) and 20 weeks (h), respectively, through immunofluorescence staining. Quantification of results are representative of 5-10 rats per group. Each error bar represents means ± s.e.m. *, P < 0.05, **, P < 0.01, ***, P < 0.001.
Fig. 5.
Fig. 5.. In vivo effects of TREG co-transplantation with C4-mDAPs.
a, NSG mice were sacrificed 2 or 20 weeks after intra-striatal transplantation of C4-mDAPs with or without autologous C4-TREG (20 k cells/mouse). The amphetamine-induced rotation test was performed every 4 weeks after transplantation for 24 weeks. b-d, Behavioral assessments using amphetamine-induced rotation test (b), apomorphine-induced rotation test (c), and cylinder test (d) at 20 weeks post-transplantation. e, f, The total number of transplanted C4-mDAPs (hNUCLEI+) (e) and graft volume (hNCAM+) (f) were analyzed after 2 and 20 weeks, respectively. g, h, Percentages of Ki67+ and SOX1+PAX6+Ki67+ cells (g) and correlation between Ki67+ cell percentage and graft volume (h). i, The total number of TH+ cells were examined after 2 and 20 weeks, respectively. j, Representative images of A9-like or A10-like cells. k, Quantification of TH+ neurons co-expressing GIRK2+ ALDH1A1+ (A9) or Calbindin+ (A10). l, Percentage of NeuN+/hNUCLEI+ cells. m, Representative images of DA synaptic connections within the host striatum identified by TH+hSYP+DARPP32+ staining. Quantification of results are representative with 5-10 mice per group. Each error bar represents means ± s.e.m. *, P < 0.05, **, P < 0.01, ***, P < 0.001.

Comment in

References

    1. Parmar M, Grealish S & Henchcliffe C The future of stem cell therapies for Parkinson disease. Nat Rev Neurosci 21, 103–115 (2020). - PubMed
    1. Sonntag KC et al. Pluripotent stem cell-based therapy for Parkinson’s disease: Current status and future prospects. Prog Neurobiol 168, 1–20 (2018). - PMC - PubMed
    1. Barker RA, Drouin-Ouellet J & Parmar M Cell-based therapies for Parkinson disease-past insights and future potential. Nat Rev Neurol 11, 492–503 (2015). - PubMed
    1. Lindvall O. Clinical translation of stem cell transplantation in Parkinson’s disease. J Intern Med 279, 30–40 (2016). - PubMed
    1. Kim TW, Koo SY & Studer L Pluripotent Stem Cell Therapies for Parkinson Disease: Present Challenges and Future Opportunities. Front Cell Dev Biol 8, 729 (2020). - PMC - PubMed

Publication types

MeSH terms