. 2023 Jul;619(7971):724-732.
doi: 10.1038/s41586-023-06143-z. Epub 2023 Jul 12.

Diverse organic-mineral associations in Jezero crater, Mars

Affiliations

Diverse organic-mineral associations in Jezero crater, Mars

Sunanda Sharma et al. Nature. 2023 Jul.

Abstract

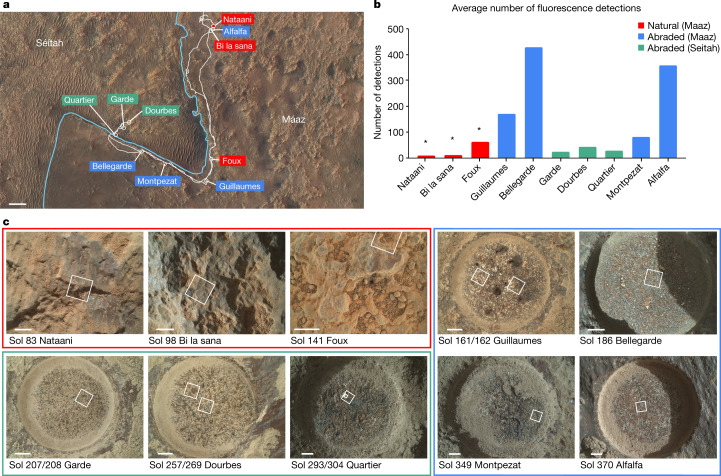
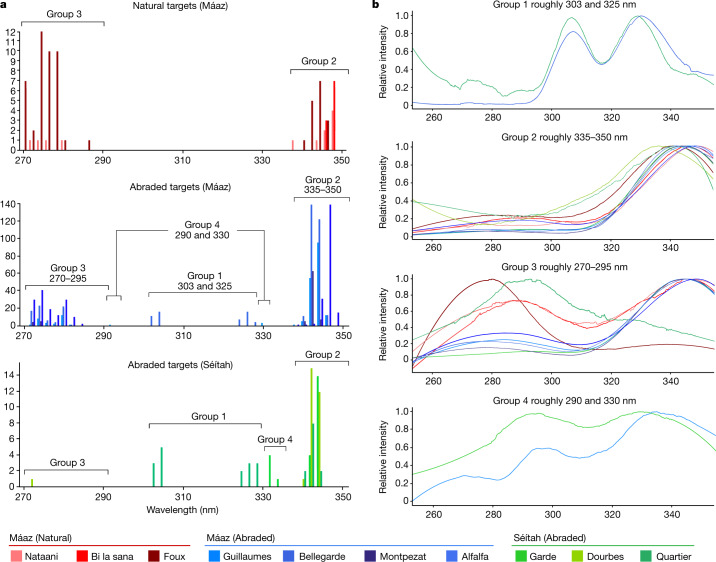
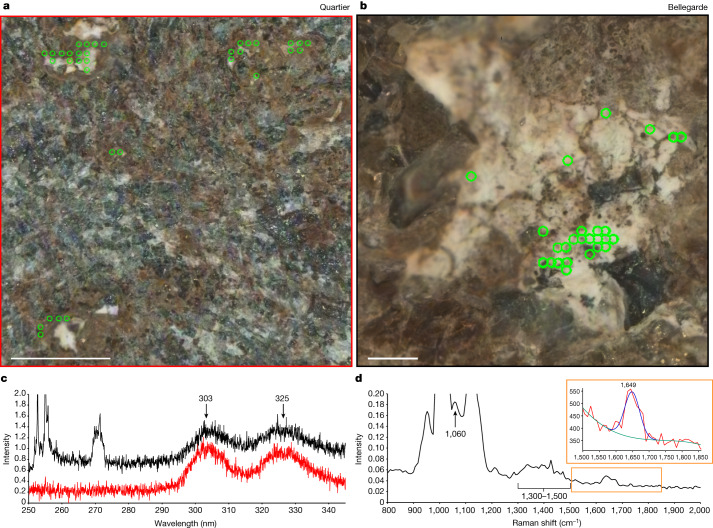
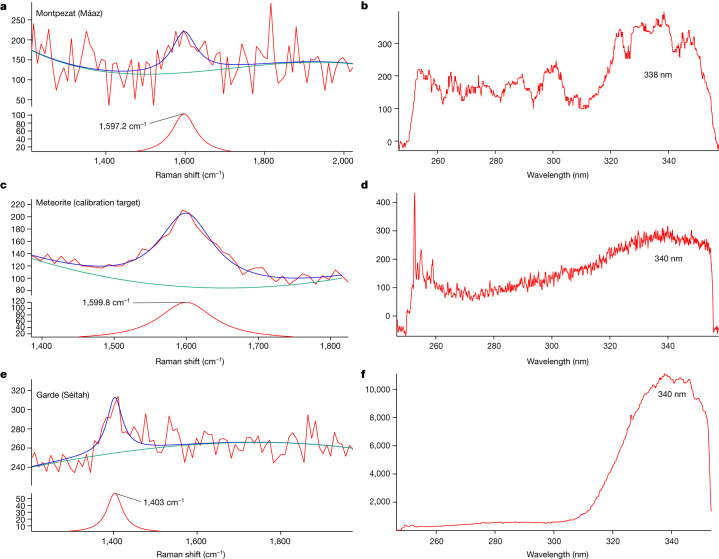
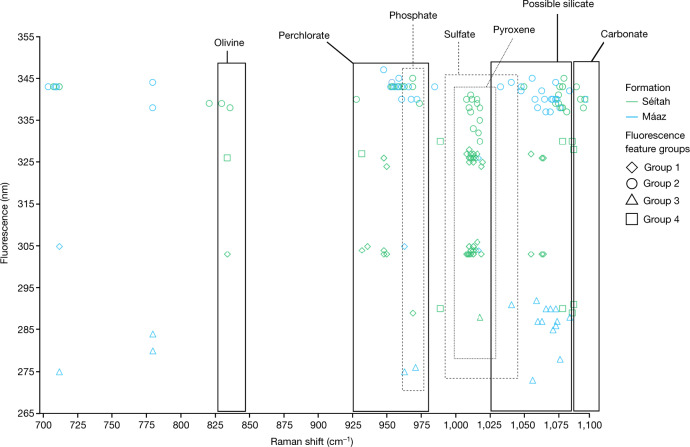
The presence and distribution of preserved organic matter on the surface of Mars can provide key information about the Martian carbon cycle and the potential of the planet to host life throughout its history. Several types of organic molecules have been previously detected in Martian meteorites1 and at Gale crater, Mars2-4. Evaluating the diversity and detectability of organic matter elsewhere on Mars is important for understanding the extent and diversity of Martian surface processes and the potential availability of carbon sources1,5,6. Here we report the detection of Raman and fluorescence spectra consistent with several species of aromatic organic molecules in the Máaz and Séítah formations within the Crater Floor sequences of Jezero crater, Mars. We report specific fluorescence-mineral associations consistent with many classes of organic molecules occurring in different spatial patterns within these compositionally distinct formations, potentially indicating different fates of carbon across environments. Our findings suggest there may be a diversity of aromatic molecules prevalent on the Martian surface, and these materials persist despite exposure to surface conditions. These potential organic molecules are largely found within minerals linked to aqueous processes, indicating that these processes may have had a key role in organic synthesis, transport or preservation.


Conflict of interest statement

The authors declare no competing interests.

Figures

Fig. 1
Fig. 1. Overview of targets analysed by SHERLOC during the crater floor campaign.
a, High Resolution Imaging ScienceExperiment (HiRISE) image of the region studied with the rover’s traverse marked in white, the boundary between the Séítah and Máaz fm delineated by the light blue line, and each rock target labelled. Scale bar, 100 m. b, Average number of fluorescence detections (out of 1,296 points) from survey scans for each target interrogated by SHERLOC, arranged in order of observation. *The acquisition conditions were different for dust-covered natural targets as compared to relatively dust-free abraded targets, possibly resulting in reduced detections. c, WATSON images of natural (red box) and abraded targets (Máaz is the blue box, Séítah is the green box) analysed in this study, with SHERLOC survey scan footprints outlined in white. Two survey scans were performed on Guillaumes, Dourbes and Quartier. Sol 141 imaging on Foux had an incomplete overlap of WATSON imaging and SHERLOC spectroscopy mapping. Scale bars, 5 mm.
Fig. 2
Fig. 2. Summary of fluorescence features across targets.
a, Histograms of the λmax (measured from raw data) of four fluorescence features that were observed in survey scans in natural targets in Máaz (top, n = 84), abraded targets in Séítah (bottom, n = 82) and abraded targets in Máaz (middle, n = 1070). Bins of 1 nm show variation in band centres, y axes scaled to each dataset. b, Filtered mean spectra from each target representing each fluorescence feature category demonstrate characteristic band positions, normalized relative intensities and colocated features between targets. The range of the SHERLOC CCD is 250–354 nm. The rise in baseline below 270 nm is a boundary artefact introduced by the filter and not representative of the sample data.
Fig. 3
Fig. 3. Group 1 (roughly 303 and 325 nm) doublet fluorescence feature mineral associations in Bellegarde and Quartier.
a, Colourized ACI image of a region where a survey scan (36 × 36 points over 5 × 5 mm2) was performed on the Bellegarde target from sol 186. Green rings (rough laser beam diameter) represent locations where the roughly 303 and 325 nm fluorescence doublet was detected. b, Colourized ACI image of a region where a detailed scan (10 × 10 points over 1 × 1 mm2) was performed on the Quartier target from sol 304. Green rings represent locations where the roughly 303 and 325 nm fluorescence doublet was detected. Scale bars, 1 mm. c, Median fluorescence spectra (unfiltered) from the green points indicated in Bellegarde (red, n = 33) and Quartier (black, n = 26) normalized to 303 nm band and offset for clarity. d, Median Raman spectra of four points with highest fluorescence band intensities from Quartier scans on sols 293 and 304. Roughly 1,010 cm−1 sulfate band is off scale; inset shows roughly 1,649 cm−1 band with Voigt fit (FWHM 53.737, area 12,559, height 192.79). In the inset, the unfitted spectrum (red), fitted spectrum (blue) and baseline (green) are shown; y axis is intensity.
Fig. 4
Fig. 4. Raman features of possible organic compounds.
a, Raman spectrum from point 40 of an HDR scan on Montpezat (sol 349) with a Lorentzian fit (FWHM 49.873, area 8,069.1, height 103). b, Corresponding average fluorescence spectrum to a (lambda max roughly 338 nm). c, Median Raman spectrum (n = 100) from an HDR scan on the SaU008 meteorite calibration target (sol 181), which contains the known graphitic (G) band, with a Lorentzian fit (FWHM 61.784, area 11,646, height 120). d, Corresponding average fluorescence spectrum to c (lambda max roughly 338 nm). e, Average Raman spectrum of points with the highest group 2 fluorescence (n = 28) on Garde (sol 207–208) with a Lorentzian fit (FWHM 47, area 4,500, height 60.953). f, Corresponding average fluorescence spectrum to c (lambda max roughly 340 nm). In all graphs, the unfitted spectrum (red), fitted spectrum (blue) and baseline (green) are shown; the y axis is intensity.
Fig. 5
Fig. 5. Summary of SHERLOC fluorescence-mineral associations across features and formations.
Select mineral detections (Raman shift, cm−1) and their fluorescence features (λmax, nm) for abraded targets analysed using unsmoothed data from HDR and detail scans; both Raman and fluorescence data are measured on the same point. Máaz scans (blue) used between 250 and 500 ppp, yielding low signal-to-noise ratio (less than 2) in some cases that were not included; Séítah scans (green) all used 500 ppp, allowing for comparatively more Raman detections. Mineral classifications based on high confidence Raman detections of major peaks are indicated by boxed regions: olivine (roughly 825–847 cm−1),,, range of hydrated and dehydrated perchlorate (roughly 925–980 cm−1),, phosphate (roughly 961–975 cm−1),,, pyroxene (roughly 1,000–1,026 cm−1), sulfate (roughly 990–1,041 cm−1),,, amorphous silicate (broad peak at roughly 1,020–1,080 cm−1), and carbonate (roughly 1,085–1,102 cm−1),. Markers outside a boxed region do not have a mineral assignment. Disambiguation of overlapping regions can generally be resolved by consideration of minor Raman peaks (not marked here) and corroboration by other instrument(s) (for example, PIXL/SuperCam).
Extended Data Fig. 1
Extended Data Fig. 1. Group 2 Fluorescence Across All Targets Analyzed by SHERLOC.
Colorized ACI images from survey scans of each of the 3 natural targets (top left), 4 Máaz abraded targets (right), and 3 Séítah abraded targets (bottom left). Green spots represent the relative laser beam diameter that have a positive identification for the ~335–350 nm fluorescence.
Extended Data Fig. 2
Extended Data Fig. 2. Group 3 Fluorescence Across All Targets Analyzed by SHERLOC.
Colorized ACI images from survey scans of each of the 3 natural targets (top left), 4 Máaz abraded targets (right), and 3 Séítah abraded targets (bottom left). Green spots represent the relative laser beam diameter that have a positive identification for the ~270–295 nm fluorescence. No ~270–295 nm fluorescence was observed on survey scans in Garde and Quartier.
Extended Data Fig. 3
Extended Data Fig. 3. Reference Fluorescence Spectra for 1 and 2 ring organic compounds.
Fluorescence emissions of a sample set of 1- and 2-ring organic compounds analyzed on a SHERLOC analog instrument.
Extended Data Fig. 4
Extended Data Fig. 4. Group 2 Fluorescence Feature Mineral Associations in Alfalfa and Dourbes.
A) Colorized ACI of Alfalfa (Máaz fm.) HDR scan on sol 370 with laser overlay (grey = no fluorescence detected, yellow = fluorescence at ~335–350 nm detected). Three points of interest with clear fluorescence are marked in white and correlate to the smoothed mean spectra below. Point 1 was co-located with Raman detections of amorphous silicate (broad ~1063 cm−1); Point 2 and 3 were co-located with potential perchlorate detections (~961 cm−1). B) Colorized ACI of Dourbes (Séítah fm.) Detail 1 scan on sol 269 with laser overlay (gray = no fluorescence detected, yellow = fluorescence at ~335–350 nm detected). Three points of interest with clear fluorescence are marked in white and correlate to the spectra below. Point 1 was co-located with Raman detections of potential olivine (~823 cm−1) and carbonate (~1077 cm−1); Point 2 was co-located with a potential carbonate detection (~10 cm−1); and Point 3 with an unassigned peak at ~1015 cm−1.
Extended Data Fig. 5
Extended Data Fig. 5. Mean Fluorescence Spectra on Two Regions of Meteorite Calibration Target.
A) Colorized ACI image from a survey scan of the meteorite calibration target from sol 181. Green spots represent the relative laser beam diameter that have a positive identification for the ~335–350 nm fluorescence. B) Mean fluorescence spectra from locations by all green spots in A (red spectrum, n = 137) and mean fluorescence spectra from green spots bounded by the black box from the vug (black spectrum, n = 36).
Extended Data Fig. 6
Extended Data Fig. 6. Group 3 Feature Mineral Association in Bellegarde and Group 4 Feature ~290 & 330 nm Feature and Mineral Associations in Garde.
A) Colorized ACI of Bellegarde (Máaz fm.) HDR scan on sol 186 with laser overlay (gray = no fluorescence detected, yellow = fluorescence at ~270–295 nm detected). Three points of interest with Group 3 fluorescence are marked in white and correlate to the smoothed mean spectra below. Point 1 and 2 were co-located with a potential phosphate or perchlorate detection (~973, ~965 cm−1); Point 3 was not co-located with a mineral detection. In all of these points, high intensity Group 2 fluorescence was also detected. B) Colorized ACI of Garde (Séítah fm.) Detail centre 1 scan on sol 208 with laser overlay (gray = no fluorescence detected, yellow = fluorescence at ~290 & 330 nm doublet detected). Three points of interest with clear fluorescence are marked in white and correlate to the spectra below. All three points were co-located with Raman detections of potential carbonate (~1088, ~1080, ~1085 cm−1).

References

    1. Steele A, McCubbin FM, Fries MD. The provenance, formation, and implications of reduced carbon phases in Martian meteorites. Meteorit. Planet. Sci. 2016;51:2203–2225. doi: 10.1111/maps.12670. - DOI
    1. Eigenbrode JL, et al. Organic matter preserved in 3-billion-year-old mudstones at Gale crater, Mars. Science. 2018;360:1096–1101. doi: 10.1126/science.aas9185. - DOI - PubMed
    1. Millan M, et al. Organic molecules revealed in Mars’s Bagnold dunes by Curiosity’s derivatization experiment. Nature Astronomy. 2022;6:129–140. doi: 10.1038/s41550-021-01507-9. - DOI
    1. Freissinet C, et al. Organic molecules in the sheepbed mudstone, Gale Crater, Mars. J. Geophys. Res. Planets. 2015;120:495–514. doi: 10.1002/2014JE004737. - DOI - PMC - PubMed
    1. Steele A, et al. Organic synthesis associated with serpentinization and carbonation on early Mars. Science. 2022;375:172–177. doi: 10.1126/science.abg7905. - DOI - PubMed